
Technology
December 08, 2025
Innovation and profitability in technology companies: a case study
Authors: Ryller Sousa de Moura and Marco Antonio Alves de Souza Junior
DOI: 10.22167/2675-6528-2025038
E&S 2025, 6: e2025038
Every business leader faces a constant dilemma: the pressure for short-term results, expressed in healthy profit margins, versus the need to invest in innovation to ensure the company’s future relevance and growth. This challenge becomes even more intense in the technology sector, a competitive environment where the ability to innovate is not just an advantage, but a condition for survival. Global high-tech exports showed significant expansion: they jumped from 2.2 trillion dollars in 2012 to 3.45 trillion in 2022, which highlights the acceleration of innovation and the intensity of competition in this market[1]. The central question facing the board is how to balance these two elements without compromising either.
In the context of economic growth and business competitiveness in the 21st century, technological innovation is a pillar of financial success, especially for software development companies. As Farhana and Swietlicki[2] highlight, the ability to innovate to uniquely meet customer needs is crucial for business sustainability, as is the ability to adapt to market changes for the implementation of disruptive innovations.
The relevance of innovation as a competitive differential is widely recognized in the literature. Studies such as those by Brown and Mawson[3] and Aghion et al.[4] highlight the strong correlation between investments in research and development (R&D) and the improvement in companies’ profitability. Analyses on the adoption of emerging technologies and their relationship with financial performance, such as those by Lee and Zhou[5] and Kostopoulos et al. [6] reinforce the importance of understanding how innovation strategies can be optimized to maximize results.
Given this scenario, this work aims to investigate, through a practical case study, how technological innovation affected the profitability of a Brazilian software company for budgeting during its consolidation period, between 2016 and 2023. The in-depth analysis seeks to understand the impact of technological advancements on a set of essential financial indicators.
Although the initial evaluation considered Return on Equity (ROE) and Net Margin, to strengthen the study’s robustness, operational performance indicators such as Return on Assets (ROA) and Return on Invested Capital (ROIC) were incorporated. This expansion offers relevant insights for managers and leaders facing the same strategic dilemma.
According to Gil[7], this study is characterized as descriptive research, whose purpose is to describe the characteristics of a given phenomenon and correlate its variables without manipulating them. The investigation adopts a quantitative approach, focused on objectivity and the use of numerical data to test hypotheses[8]. The single case study method was selected because it allows for a longitudinal analysis of financial dynamics in the specific context of the organization. This approach allows for the examination of a phenomenon in its real environment, a characteristic particularly useful for investigating complex processes within an organization over time (Yin, 2015)[9].
The research sought to describe and analyze the correlation between technology investment variables and financial performance indicators over an eight-year period, corresponding to the maturation phase of the analyzed company. The organization operates in the technology sector and is headquartered in Brazil. Founded in 2012, it conducted the first tests of its product in 2015, and the official launch occurred in 2016. Its portfolio includes advanced solutions that meet various budgeting needs, with tools that allow for efficient and precise budget preparation and control.
At the end of the observed period, in 2023, the organization qualified as medium-sized, with thousands of clients nationwide and operations based on software license sales.
The research covered the period from January 2016 to December 2023, an interval that allows us to observe the company’s evolution from its initial market entry phase to its consolidation. Data collection occurred from 96 monthly balance sheets of the organization, provided for this research under condition of anonymity. The annual financial statements, as of December 31 of each year, were registered with the corresponding commercial registry, and the 2023 balance sheet underwent external audit, which ensures the reliability of the information.
To identify innovation milestones, an internal analysis was conducted of the main product and technology launches that represented significant effort for the company, such as the development of artificial intelligence applied to budgeting and new data modules specific to clients.
The data processing and calculation were performed using Microsoft Excel software, due to its versatility in manipulating and evaluating financial information. The methodological approach comprised two stages to ensure the robustness of the findings. Firstly, five significant technological innovation moments that occurred up to 2022 were identified, selected based on their strategic relevance to the company’s product portfolio. In parallel, to validate the relationship between investment and return, an analysis was conducted of the five quarters that showed the largest percentage increases in intangible asset capitalization, a direct accounting reflection of R&D investment, according to Technical Pronouncement CPC 04 (R1) from the Accounting Pronouncements Committee of 2010[10].
For both approaches, profitability indicators were analyzed in the 12-month period following each milestone, which allows for evaluating the direct impact of these actions on the company’s performance.
The main financial indicators used to analyze profitability were ROE and Net Margin, established metrics for evaluating economic performance. According to Damodaran[11], ROE measures the efficiency with which a company generates profits from its equity capital, while Net Margin indicates the proportion of revenue converted into profit.
To refine the observed variation and mitigate distortions arising from oscillations in the scale of the business, the weighted average of the indices was calculated. This procedure assigns greater weight to periods in which the calculation base — net worth for ROE and net revenue for Net Margin — showed greater magnitude, resulting in a more precise view of the real impact of innovations over time.
To meet the reviewers’ recommendation and broaden the robustness of the analysis, two additional operational profitability metrics were included: ROA and ROIC. The former assesses managerial efficiency in the use of total assets to generate profit, while the latter, recognized as a more accurate measure of performance, measures the company’s return on all invested capital. The inclusion of these indicators allows for a multifaceted evaluation, capable of mitigating possible distortions of Net profit present in ROE.
The analysis of the company’s financial data between 2016 and 2023 revealed a complex, yet enlightening, scenario regarding the impact of innovation. The first finding is that the strategy of continuous investment in technology proved to be a decisive driver for revenue expansion. As shown in Figure 1, the company’s net revenue showed a robust and upward trajectory over the eight years.
This result validates the thesis that R&D investment was fundamental for market conquest and brand consolidation, a finding that aligns with the literature positioning innovation as a central element of business performance. In this sense, Coad et al.[12] highlight the positive relationship between innovation and the evolution of results, regardless of the company’s age.
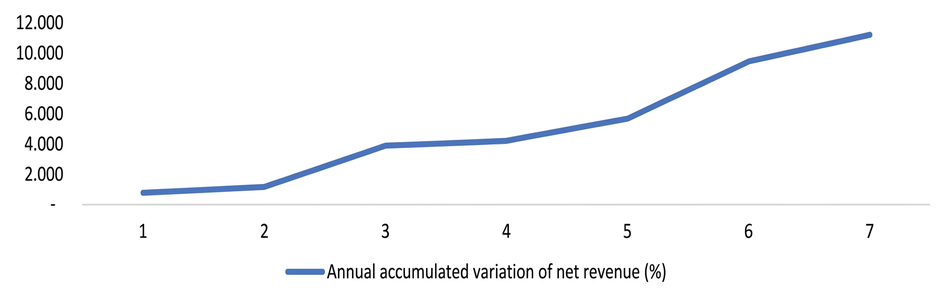
Source: Original research results.
To deepen the profitability analysis and meet the recommendations of the peer review, a joint examination of multiple indicators was carried out, consolidated in Table 1. This approach offers a more robust view, reduces possible distortions arising from the isolated observation of a single measure, and highlights the relationship between investment, efficiency, and return.
Table 1. Comparative analysis of post-innovation profitability indicators (variation %)
| Base month | Net Margin | ROE Var. | ROA Var. | ROIC Var. |
| Jun. 2017 | -14,16 | 932,06 | 55,26 | 58,39 |
| May. 2018 | 8,03 | -782,06 | -38,8 | -40,38 |
| Sep. 2019 | -2,71 | -21,73 | -0,22 | -0,25 |
| Apr. 2021 | 7,19 | 18,62 | -0,04 | -0,04 |
| Jan. 2022 | -4,44 | -4,56 | -0,95 | -0,95 |
Note. Var: Percentage variation (%).
The analysis of the first innovation milestone, in June 2017, reveals a fundamental scenario for the thesis of this work. A broadly positive impact was found on the return indicators (ROE, ROA, and ROIC). The extreme value of ROE (+932.06%) stems from the company’s low capital base in its initial phase. More importantly, ROA and ROIC, operationally more stable indicators, registered expressive increases of +55.26% and +58.39%, respectively, which confirms a real gain in efficiency. In contrast, the Net Margin showed a retraction of 14.16%, which constitutes the first explicit trade-off between growth-oriented investment and short-term profitability.
The May 2018 milestone highlights this dilemma even more clearly. During this period, the Net Profit improved (+8.03%), while all return indicators registered sharp declines. This apparent contradiction indicates a movement of strong capitalization and an increase in the asset base and net worth, which, temporarily, surpassed the profit generation capacity in the same proportion. The company was expanding its structure to reach a new revenue level, which resulted in a momentary dilution of the return on capital.
The three subsequent periods (Sep/2019, Apr/2021, and Jan/2022) demonstrate a stabilization trend. Variations in all indicators became much smaller, with results close to zero. The convergence of ROA and ROIC to marginal oscillations indicates that the company has reached a new stage of maturity. In this phase, innovations, of a more incremental nature, took on the role of sustaining competitiveness and operation, without producing the same return advances observed in the initial period of rapid growth.
In summary, the joint analysis of the four indicators validates the central thesis with a significantly greater degree of robustness. The volatility of ROE, especially in the early years, is contextualized and confirmed by the more stable trajectory of ROA and ROIC. Because they are based on operational metrics, these two indices demonstrate that the company’s innovation strategy generated a real trade-off between accelerated revenue expansion and short-term profitability.
This pattern of nonlinear returns is in line with the literature, especially with Hervas-Oliver et al.[13], who highlight the variable effectiveness of innovation investments, and with Díaz-Chao et al.[14], who recognize the impact of external and strategic factors on financial performance. The convergence of indicators in recent years suggests a successful maturation of the investment strategy, as predicted by Coad et al.[12] in their studies on firm growth and age.
In practice, this analysis offers relevant subsidies for managers and leaders of technology companies. First, it empirically demonstrates that evaluating the success of an innovation solely by immediate profit margin can lead to imprecise decisions, by disregarding the gain of market share and revenue growth. Second, it highlights the limitation of using ROE as the sole return metric in companies with volatile net worth, which reinforces the need for a set of indicators that incorporate ROA and ROIC to ensure a reliable reading of operational health.
Finally, the study presents an evaluation model capable of justifying, before boards and investors, the need for intensive reinvestment periods which, although they pressure profitability in the short term, constitute a fundamental element for value creation and business sustainability in the long term.
This practical case study demonstrated that technological innovation was a determining factor for the success of the analyzed company, although its impact on financial indicators should be interpreted strategically and contextually. The main conclusion is that, for technology companies in the growth phase, the isolated evaluation of Net Margin can lead to mistaken conclusions.
The robust revenue growth proved to be an equally—or even more—important sign of success, reflecting the effectiveness of the innovation strategy in market expansion. The impact on the margin is not immediate and can be negative in the short term, representing a deliberate investment in the future of the business and its long-term competitiveness.
The main limitation of this research is its single case study nature, which prevents the generalization of results to other companies or sectors. It is recommended that future investigations examine these dynamics in a larger sample of organizations or in different sectors, in order to validate the observed patterns.
Nevertheless, the lessons learned are significant for managers and investors: the role of strategic financial management transcends the mere analysis of numbers and becomes a decision-making tool that contextualizes the complex relationship between investment, growth, and profitability, allowing leadership to choose the most appropriate alternatives to ensure the business’s perpetuity.
REFERENCES
[1] The World Bank. 2022. High-technology exports (current US$). Disponível em: https://data.worldbank.org/indicator/TX.VAL.TECH.CD. Acesso em: 15 mar. 2024.
[2] Farhana, L.; Swietlicki, E. 2020. Dynamic Capabilities and Disruptive Innovation in Startups: A Study on Niche Market Interactions. Journal of Innovation and Entrepreneurship. 9(1): 1-14. DOI: https://doi.org/10.1186/s13731-020-00128-x.
[3] Brown, R.; Mawson, S. 2016. The role of innovation in industrial competitiveness: A review of the evidence. Journal of Industrial Economics and Management. 11(2): 25-47.
[4] Aghion, P.; Akcigit, U.; Hyytinen, A.; Toivanen, O. 2019. The social impact of innovation: A review and reassessment. Academic Journal of Economic Studies. 35(4): 1231-1249.
[5] Lee, S.M.; Zhou, Z. 2015. The effect of innovative technology adoption on operational efficiency: An empirical study. Journal of Technology Management & Innovation. 10(3): 20-30. DOI: http://dx.doi.org/10.4067/S0718-27242015000300002.
[6] Kostopoulos, K.; Spanos, Y.E.; Prastacos, G.P. 2021. Organizational innovation capabilities: A structured review and future research agenda. Organization Management Journal. 18(3): 164-183. DOI: https://doi.org/10.1108/OMJ-11-2019-0836.
[7] Gil, A.C. 2008. Métodos e técnicas de pesquisa social. 6ed. Atlas: São Paulo, SP.
[8] Creswell, J.W. 2010. Projeto de Pesquisa: Métodos Qualitativo, Quantitativo e Misto. 3ed. Porto Alegre, RS: Artmed.
[9] Yin, R.K. 2015. Estudo de Caso: Planejamento e Métodos. 5ed. Porto Alegre, RS: Bookman.
[10] Comitê de Pronunciamentos Contábeis. 2010. CPC 04 (R1) – Ativo Intangível. Diário Oficial da União, Brasília, 03 dez. 2010. Seção 1, p. 45-48. Disponível em: http://www.cpc.org.br/CPC/Documentos-Emitidos/Pronunciamentos/Pronunciamento?Id=35.
[11] Damodaran, A. 2020. Valuation: Measuring and Managing the Value of Companies. 7ed. Hoboken, NJ: Wiley.
[12] Coad, A.; Segarra, A.; Teruel, M. 2016. Innovation and firm growth: Does firm age play a role? Research Policy. 45(2): 387-400. DOI: https://doi.org/10.1016/j.respol.2015.10.010.
[13] Hervas-Oliver, J.L.; Sempere-Ripoll, F.; Boronat-Moll, C. 2017. Process innovation strategy in SMEs, organizational innovation and performance: A misleading debate? Small Business Economics. 49(2): 559-577. DOI: https://doi.org/10.1007/s11187-017-9878-3.
[14] Díaz-Chao, Á.; Sainz-González, J.; Torrent-Sellens, J. 2016. ICT, innovation, and firm productivity: New evidence from small local firms. Journal of Business Research. 69(7): 1925-1930. DOI: https://doi.org/10.1016/j.jbusres.2015.10.081.
COMO CITAR:
Moura, R.S.; Souza Júnior, M.A.A.S. Inovação e rentabilidade em empresas de tecnologia: um estudo de caso. Revista E&S. 2025; 6: e2025038.
ABOUT THE AUTHORS
 Ryller Sousa de Moura – Specialist in Finance and Controlling. Street 227, s/n, Q66, L04, Setor Leste Universitário, 74605-080, Goiânia, Goiás, Brazil.
Marco Antonio Alves de Souza Junior – Master in Business Administration. Ferdinando Pietro Pavan Street, 100, 13.606-238, Araras, São Paulo, Brazil.