
Technology
September 04, 2025
Financial inclusion of countries developing Central Bank Digital Currency through the clustering technique
Authors: Magali Susana Chalela and Anna Carolina Martins
DOI: 10.22167/2675-6528-2024051
E&S 2025, 6: e2024051
The Bank for International Settlements (BIS)[1] issued a report in 2022, in which it highlighted that more than 90% of central banks, representing 82% of the world’s population and 94% of all global economic capacity, are developing or studying projects for Central Bank Digital Currency (CBDC). According to Tan[2], CBDCs are digital currencies issued and regulated by central banks. Unlike traditional cryptocurrencies, which operate on a decentralized system, fiat digital currencies are centralized and have the backing and trust of the issuing government[3].
Cernev and Diniz[4] highlight that CBDC represents a secure payment instrument and is part of the country’s monetary base. In other words, under the responsibility of the central bank, it is a fiat currency that can be stored or transferred through different digital payment systems and services. Currently, four nations have already launched their own CBDC digital currencies (Nigeria – e-Naira; Jamaica – JAM-DEX; Bahamas – Sand Dollar and Zimbabwe – ZiG), 24 countries are in the pilot phase, 20 in proof of concept, and more than 90 in the research phase, as shown by the CBDC Tracker[5] non-governmental organization that compiles real-time information on countries developing CBDC.
The BIS[1] projects that, by 2030, the world will have at least 24 CBDCs in operation. Of these, 15 will be for retail – intended for individuals and businesses in daily transactions – and nine for wholesale – focused on transactions between banks and other financial institutions.
Interest in CBDCs has increased significantly in recent years, driven by technological advances and the COVID-19 pandemic, which accelerated the digitalization of payments. In this context, the BIS[6] conducted a survey in 2020 with 66 central banks and found that countries with developing economies, such as Brazil, Argentina, South Africa, and China, expect to increase financial inclusion by developing a CBDC. Figure 1 presents an overview with a map of countries developing CBDCs:
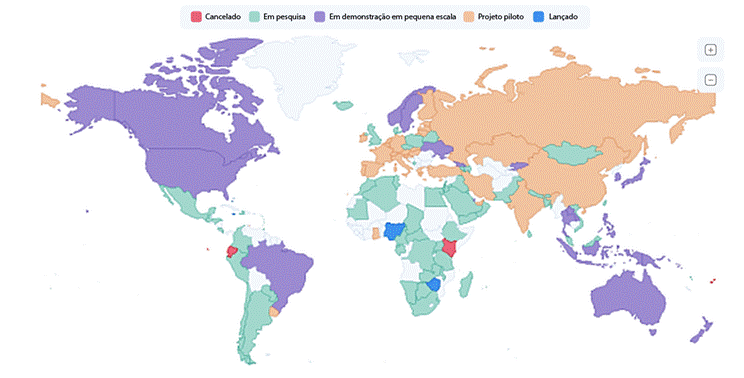
Source: CBDC Tracker[5].
Financial inclusion, as defined by the World Bank[7], means that individuals and businesses have access to useful and affordable financial products and services that meet their needs – such as transactions, payments, savings, credit and insurance – delivered in a responsible and sustainable way.
In the final declaration of the G20 [8] international economic cooperation forum, held in Rio de Janeiro in November 2024, digital public infrastructure was recognized as the foundation for equitable digital transformation and the transformative power of technologies to reduce social divisions and empower individuals in vulnerable situations. Initiatives such as Pix and Drex were highlighted as tools to expand access to financial services, especially in developing countries.
Different studies point to financial inclusion as a relevant variable for the economic development of several countries[9]. It is commonly measured by access to and use of financial services through accounts in banks or financial institutions. According to this metric, about 31% of the world’s adult population does not have a bank account or access to formal financial services. This represents approximately 1.7 billion people — or a quarter of the global population, according to World Bank data[10].
According to some analyses, CBDCs can serve as an entry point for unbanked and underbanked individuals to access electronic payment systems and, potentially, other financial products and services[11].
Furthermore, according to the report “CBDC: expanding financial inclusion or deepening exclusion?”[12], policymakers around the world have been exploring CBDCs for their potential to act as a public good, serving the collective interest both as central bank-issued money and as financial technology whose infrastructure is maintained by a state entity.
The report highlights that retail CBDC is the only form of digital money accessible to the common user and that it constitutes a central bank liability. Because of these characteristics, many believe that CBDC can promote financial inclusion. However, few have offered practical insights into how this occurs, especially for the unbanked. For the report’s authors[12] only after analyzing design and policy options is it possible to assess the economic viability of issuing a CBDC for this purpose.
Given the complexity of the topics related to CBDC and financial inclusion, the present study aims to conduct an exploratory analysis to ascertain whether CBDC can be an effective public policy strategy to expand financial inclusion in low-index countries. To this end, the financial inclusion indicator published by Centre for Economics and Business Research (Cebr), an institution globally recognized for the seriousness of its economic publications, was adopted. This metric comprehensively assesses financial inclusion, based on market data combined with global surveys of consumers and entrepreneurs.
Financial inclusion was measured by Cebr in 42 countries, based on indicators divided into three pillars: government, financial system, and employer support. Each country was assigned a score ranging from 0 (absence of financial inclusion) to 100 (optimal level), as stated in the Global Financial Inclusion Index 2023[13] report. The government pillar was weighted by six variables: (1) pensions, (2) deposit and consumer protection, (3) employment level, (4) education level, (5) financial literacy level, and (6) population connectivity. For this, data extracted from the Mercer CFA Institute Global Pension Index, the IMF Deposit Insurance Database, the Cebr Global Survey of Business Management Teams, the OECD Programme For International Student Assessment Scores, and the World Bank were used, according to the Global Financial Inclusion Index report of 2023[13].
In the pillar of the financial system, the following variables were considered: (1) availability and acceptance of products, services, and financial education; (2) number of bank accounts; (3) levels of access to credit; (4) financial technology; (5) use of real-time payments; (6) trust in financial services; and (7) presence and quality of fintechs. The data used to compose these variables were extracted from the World Economic Forum Global Competitiveness Index, the Cebr Global Survey of Business Management Teams, the World Bank and the Findexable Global FinTech Ranking”, as stated in the Global Financial Inclusion Index report of 2023[13].
Finally, the employer’s support pillar for employees considers the variables: (1) social security contributions, (2) insurance, and (3) financial guidance provided, based on data from the Cebr Global Survey of Business Management Teams, according to the Global Financial Inclusion Index report of 2023[13].
Database
The database for this study was composed of the 42 countries evaluated by the Cebr’s global financial inclusion indicator, namely: Singapore, Hong Kong, Switzerland, United States of America, Sweden, Denmark, United Kingdom, Norway, Australia, Thailand, Finland, Netherlands, South Korea, Canada, Israel, New Zealand, Vietnam, Malaysia, China, Taiwan, Brazil, Germany, Ireland, United Arab Emirates, France, India, Japan, Poland, Spain, Indonesia, Turkey, Kenya, Chile, Saudi Arabia, Mexico, South Africa, Italy, Peru, Colombia, Nigeria, Ghana, and Argentina.
Furthermore, based on the information from the countries consulted in the CBDC Tracker in October 2023 [5], those whose CDBC development stage is categorized as research, pilot project, proof of concept, or launched were selected.
Thus, the present study does not include countries that have canceled CBDC projects or that do not show development in this area, as the objective is to evaluate financial inclusion only in countries with more advanced stages of CBDC development.
After applying these two criteria, a database was obtained with 36 countries categorized as “research project” (PESQ.); “pilot project” (PP); “proof of concept” (PC) and “launched” (LAN), according to Table 1, which presents, by country, the name of the currency and the development stage of the CBDC as well as the total score of the financial inclusion index released by Cebr:
Table 1. Countries that are part of the Cebr index and are developing CBDCs
| Country | CBDC Name5 | Stage of the CBDC5 | Note of financialinclusion |
| Singapore | Project Unib+ | PP¹ | 73,9 |
| Hong Kong | e-HKD | PC² | 71,09 |
| Switzerland | Helvetia | PP¹ | 68,43 |
| USA | Project Hamilton | PC² | 66,21 |
| Sweden | E-Krona | PC² | 65,47 |
| Denmark | Denmark CBDC | RESEARCH.³ | 65,25 |
| United Kingdom | United Kingdom CBDC | RESEARCH.³ | 60,82 |
| Norway | Norway CBDC | PC² | 59,42 |
| Australia | EAUD (wholesale) | PC² | 58,88 |
| Thailand | Thailand CBDC | PC² | 58,79 |
| South Korea | South Korea CBDC | PC² | 55,06 |
| Canada | Jsper-Ubin | PC² | 53,8 |
| Israel | e-shekel | PC² | 53,71 |
| New Zealand | New Zealand CBDC | PC² | 53,59 |
| Vietnam | Vietnam CBDC | RESEARCH.³ | 53,11 |
| Malaysia | E-ringgit | PC² | 52,84 |
| China | mBridge | PP¹ | 51,53 |
| Taiwan | Taiwan CBDC | RESEARCH.³ | 49,35 |
| Brazil | DREX | PC² | 47,63 |
| United Arab Emirates | mBridge | PP¹ | 46,83 |
| France | French Wholesale CBDC | PP¹ | 45,39 |
| India | Digital Rupee | PP¹ | 45,19 |
| Japan | Digital Yen | PC² | 43,16 |
| Poland | Digital zloty | RESEARCH.³ | 42,09 |
| Spain | Spanish Wholesale CBDC | RESEARCH.³ | 41,43 |
| Indonesia | Digital Rupiah | RESEARCH.³ | 41,35 |
| Turkey | Digital Lira | PC² | 40,93 |
| Chile | Chile CBDC | RESEARCH.³ | 38,91 |
| Saudi Arabia | Open | PP¹ | 38,1 |
| Mexico | MDBC | RESEARCH.³ | 37,55 |
| South Africa | Khokha | RESEARCH.³ | 33,1 |
| Peru | Peru CBDC | RESEARCH.³ | 31,39 |
| Colombia | Colombia CBDC | RESEARCH.³ | 30,19 |
| Nigeria | e-Naira | LAN4 | 29,56 |
| Ghana | E-cedi | PP¹ | 24,85 |
| Argentina | Digital Currency | RESEARCH.³ | 23,86 |
Note. ¹PP: Pilot project; ²PC: Proof of concept; ³PESQ: Research project; 4LAN: Launched; 5CBDC: Central Bank Digital Currency.
The countries included in the financial inclusion index analyzed, but which were not studied due to cancellation of the CBDC research or lack of interest in developing the tool, are: Finland, Kenya, Netherlands, Germany, Ireland, and Italy. Table 1 presents the selected variables for the study’s application.
Table 1. Description of the variables present in the database
| Metrics | Type | Description |
| Government | Numeric | Assesses the degree to which each government promotes financial inclusion |
| Financial | Numeric | Examines the availability and use of various financial products essential for inclusion |
| Employers | Numeric | Refers to the level of support that employers offer to employees |
According to Gil[14], the exploratory technique, adopted in this study, seeks to elaborate hypotheses, validate instruments, and provide greater familiarity with the problem. Regarding the technical procedure, the research adopts a quantitative approach focusing on the analysis of clusters. Thus, cluster analysis was applied to verify the existence of similar behaviors among observations in relation to certain variables and to create groups, or clusters, that present internal homogeneity[15].
Basically, this unsupervised machine learning technique does not depend on data labeling, meaning it does not depend on human judgment about data characteristics. The model aims to identify patterns in the data systematically and automatically, i.e., without relying on manual or improvised case-by-case (ad hoc) solutions[16]. Euclidean distance was chosen, which is a mathematical measure that calculates the “straight-line” distance between two points in a space, as a measure of dissimilarity, as it meets the research assumptions that seek to analyze the similarities between observations in each cluster and the differences between the identified groups.
Furthermore, as a reasonable estimate of the number of clusters to be formed from the database observations was not found in the literature, the hierarchical method was previously applied to K-means to explore different allocation possibilities and define an adequate number of clusters based on the clustering stages. Subsequently, the non-hierarchical clustering method K-means, which uses previously defined cluster centers, from which observations are allocated according to proximity[17], was applied.
It is a non-hierarchical method, characterized by the formation of K groups, where K corresponds to the number of previously defined clusters. As not all K values produce satisfactory results, it is essential to apply the method with different values in order to identify the solution with the best interpretation of the groups[18]. The development of this research required the use of the R programming language, which is functional, object-oriented and focused on data manipulation, transformation, analysis and visualization.
The chosen chaining method was the complete (furthest neighbor)[15], which favors the greatest distances between observations or groups in the formation of new clusters. The choice is justified by the analyses performed in the R software, which indicated an absence of significant deviations between observations (countries) and the need to identify heterogeneities among them.
The single and average[15] methods were also tested, however the complete method presented the best distribution for the formation of clusters, which is why it was adopted in this study. Furthermore, as all factors that make up the financial inclusion index have values in the same unit of measurement (scores from 0 to 100), standardization by the Z-scores procedure, one of the most used methods for this purpose according to specialized literature, was not applied.
A tree-shaped graph, known as a dendrogram, was constructed to illustrate the step-by-step groupings and facilitate the visualization of each observation’s allocation at each stage. After completing this procedure, it was verified whether the variability between clusters is significantly higher than the internal variability of each cluster. For this purpose, the F-test of one-way analysis of variance (in English, one-way analysis of variance or one-way ANOVA), which allows this analysis, was applied. Its null and alternative hypotheses are defined in Table 2.
Table 2. F-test of analysis of variance (ANOVA)
| Hypotheses | Variable |
| H0 | The variable under analysis presents the same mean in all the formed groups |
| H1 | The variable under analysis presents a different mean in at least one of the groups in relation to the others |
The criteria for interpreting the F-test of the analysis of variance are presented in Table 3.
Table 3. Criteria for interpreting the F test
| Statistics | Description |
| Mean Sq of cluster_H | Variability between the formed groups |
| Mean Sq of Residuals | Variability within groups (internal to each cluster) |
| F-value | Test statistic (Sum Sq of cluster_H divided by Sum Sq of Residuals) |
| Pr(>F) | P-value of the statistic |
| p-value < 0.05 | At least one cluster presents an average statistically different from the others |
In the non-hierarchical K-means clustering process, the result of the agglomerative hierarchical method was used to define the initial centers, from which the observations were allocated according to proximity. To identify the optimal number of clusters, the Elbow[15] method was applied, which evaluates the total variation within the clusters for different numbers of groups.
This method is a technique to find the ideal value of the parameter k of a K-means or K-Modes algorithm and considers k to be ideal when the increase in the number of clusters does not represent a significant gain[19]. According to Tussevana[20], the elbow is considered the point where the cumulative explained variance flattens. After the completion of this procedure, the F-test of one-way analysis of variance was applied to the values of the three metric variables studied.
From the descriptive statistics obtained from the database under study, it was found that the variable “employers”, which assesses the availability and impact of programs offered by the employer to improve employees’ financial well-being and inclusion in various dimensions, such as pension contributions, insurance programs, and financial guidance, stands out for presenting the highest (87.54) and lowest (9.82) scores among the 36 countries studied.
Meanwhile, the “financial” variable, which analyzes the availability and acceptance of various financial products, services, and education, based on data on access to bank accounts and credit, maturity of financial technology, and use of real-time payments, and the “government” variable, which examines the extent to which governments promote and enable financial inclusion, present similar maximum scores, according to Table 2.
Table 2. Descriptive statistics of the database
| Statistics | Government | Financial | Employers |
| Minute¹ | 23,32 | 11,18 | 9,82 |
| 1st Qtr.² | 40,49 | 31,23 | 44,28 |
| Median³ | 51,78 | 45,31 | 56,04 |
| Mean4 | 50,07 | 45,92 | 54,93 |
| 3rd Qu.5 | 57,91 | 63,45 | 68,66 |
| Max.6 | 75,32 | 77,42 | 87,54 |
Note. ¹Min.: Minimum value, the lowest value observed in the dataset; ²1st Qu: First quartile; ³Median: Median; 4Mean: Mean; 53rd Qu. Third quartile; 6Max.: Maximum value, the highest value observed in the dataset.
From the analysis of the boxplot by variable generated, it is verified that there is no need to perform standardization by the Z-score criterion, since the scores of the three financial inclusion variables range from 0 to 100, as shown in Figure 2.

Source: Original research results.
For the purpose of analyzing the distributions of the observations, a dendrogram was generated, as presented in Figure 3.

Source: Original research results.
In order to avoid very pronounced jumps, which could group very distinct observations together in the same cluster, a dendrogram was generated by applying the agglomerative technique at a height between 40 and 45, which resulted in five clusters, according to Figure 4.
Source: Original research results.
Subsequently, a categorical variable was created to indicate the cluster in the database and the database was generated with the allocation of the 36 observations into five clusters, as shown in Table 4.
Table 4. Hierarchical clustering and complete linkage method
| Grouping | Countries |
| 1 | Singapore, Hong Kong, Switzerland, USA, Sweden, Denmark and Thailand |
| 2 | United Kingdom, Norway, Australia, South Korea, Canada, Israel, New Zealand, Taiwan, Brazil, France, Spain and Chile |
| 3 | Vietnam, Malaysia, China, United Arab Emirates, India, Poland, Indonesia, Turkey and Saudi Arabia |
| 4 | Japan |
| 5 | Mexico, South Africa, Peru, Colombia, Nigeria, Ghana, and Argentina |
The cluster 1 was formed by seven countries that are among the top 10 in the financial inclusion ranking, according to Table 3.
Table 3. Cluster 1 – Hierarchical clustering
| Country | Internship | Inclusion | Classification | Government | Financial | Entrepreneurs | ||||
| Singapore | PP¹ | 73,9 | 1 | 75,32 | 70,74 | 81,75 | ||||
| Hong Kong | PC² | 71,09 | 2 | 75,30 | 67,12 | 69,97 | ||||
| Switzerland | PP¹ | 68,43 | 3 | 71,65 | 64,82 | 70,20 | ||||
| USA | PC² | 66,21 | 4 | 54,91 | 77,42 | 66,57 | ||||
| Sweden | PC² | 65,47 | 5 | 64,16 | 69,94 | 51,28 | ||||
| Denmark | RESEARCH.³ | 65,25 | 6 | 65,75 | 65,88 | 60,19 | ||||
| Thailand | PC² | 58,79 | 10 | 44,32 | 71,10 | 68,53 | ||||
Note. ¹PP: Pilot project; ²PC: Proof of concept; ³PESQ: Research project.
Regarding CBDCs, four countries in cluster 1 (Hong Kong, USA, Sweden, and Thailand) are in the proof-of-concept stage for their digital currencies, suggesting they prioritize using the tool as a component to further expand financial inclusion and, consequently, improve economic development.
The cluster 2 was formed by 12 countries that, for the most part, have medium scores for the variables that make up the financial inclusion indicator. Furthermore, it should be noted that seven countries in this cluster are in the CBDC proof-of-concept stage, according to Table 4 below.
Table 4. Cluster 3 – hierarchical clustering
| Country | Internship | Inclusion | Classification | Government | Financial | Employers | ||||
| United Kingdom | RESEARCH.¹ | 60,82 | 7 | 57,56 | 70,68 | 31,12 | ||||
| Norway | PC² | 59,42 | 8 | 68,78 | 51,43 | 53,27 | ||||
| Australia | PC² | 58,88 | 9 | 58,94 | 62,99 | 40,18 | ||||
| South Korea | PC² | 55,06 | 13 | 51,03 | 65,61 | 25,71 | ||||
| Canada | PC² | 53,80 | 14 | 58,85 | 54,33 | 28,66 | ||||
| Israel | PC² | 53,71 | 15 | 57,59 | 48,82 | 58,24 | ||||
| New Zealand | PC² | 53,59 | 16 | 60,73 | 49,3 | 40,76 | ||||
| Taiwan | RESEARCH.¹ | 49,35 | 20 | 53,40 | 43,48 | 57,54 | ||||
| Brazil | PC² | 47,63 | 21 | 39,45 | 54,24 | 54,66 | ||||
| France | PPP³ | 45,39 | 25 | 55,54 | 35,24 | 45,45 | ||||
| Spain | RESEARCH.¹ | 41,43 | 29 | 48,04 | 35,95 | 36,36 | ||||
| Chile | RESEARCH.¹ | 38,91 | 33 | 43,63 | 35,57 | 32,75 | ||||
Note. ¹RESEARCH: Project in research; ²POC: Proof of concept; ³PILOT: Pilot project.
The cluster 3 was formed by nine countries that show weak performance in the “government” and “financial” variables, but above-average scores in the “employers” indicator. In terms of CBDC, most countries are in pilot projects or research, as shown in Table 5 below.
Table 5. Cluster 3 – hierarchical clustering
| Country | Internship | Inclusion | Classification | Government | Financial | Employers |
| Vietnam | RESEARCH.¹ | 53,11 | 17 | 55,37 | 45,5 | 77,18 |
| Malaysia | PC² | 52,84 | 18 | 51,8 | 48,92 | 75,19 |
| China | PPP³ | 51,53 | 19 | 51,77 | 45,13 | 79,30 |
| United Arab Emirates | PPP³ | 46,83 | 24 | 51,11 | 38,03 | 67,14 |
| India | PPP³ | 45,19 | 26 | 29,46 | 51,5 | 87,54 |
| Poland | RESEARCH.¹ | 42,09 | 28 | 49,4 | 30,79 | 60,04 |
| Indonesia | RESEARCH.¹ | 41,35 | 30 | 51,86 | 26,45 | 61,15 |
| Turkey | PC² | 40,93 | 31 | 39,99 | 35,6 | 69,14 |
| Saudi Arabia | PPP³ | 38,1 | 34 | 41,22 | 28,11 | 69,05 |
Note. ¹PESQ: Research project; ²PC: Proof of concept; ³PP: Pilot project.
The cluster 4 was formed by only one country, Japan, which presents a slightly above-average score for the “government” variable and low for the “financial” and “employers” indicators, and is in the CBDC proof-of-concept stage, as can be verified in Table 6 below.
Table 6. Cluster 4 – hierarchical clustering
| Country | Internship | Inclusion | Classification | Government | Financial | Employers |
| Japan | PC¹ | 43,16 | 27 | 55,11 | 38,62 | 9,82 |
Note. ¹PC: Proof of concept.
The cluster 5 was formed by seven countries that present weak scores for the variables “finance” and “government”, and, for the most part, medium scores for the “employers” indicator. CBDC research projects are predominant in this cluster, as shown in Table 7.
Table 7. Cluster 5 – hierarchical clustering
| Country | Internship | Inclusion | Classification | Government | Financial | Employers |
| Mexico | RESEARCH.¹ | 37,55 | 35 | 40,66 | 31,37 | 51,37 |
| South Africa | RESEARCH.¹ | 33,1 | 36 | 35,43 | 29,98 | 36,63 |
| Peru | RESEARCH.¹ | 31,39 | 38 | 35,25 | 22,46 | 54,23 |
| Colombia | RESEARCH.¹ | 30,19 | 39 | 29,97 | 27,03 | 45,45 |
| Nigeria | LAN² | 29,56 | 40 | 25,15 | 27,77 | 57,42 |
| Ghana | PPP³ | 24,85 | 41 | 23,32 | 19,97 | 53,68 |
| Argentina | RESEARCH.¹ | 23,86 | 42 | 30,72 | 11,18 | 50,08 |
Note. ¹PESQ: Project in research; ²LAN: Launched; ³PP: Pilot project.
Finally, a one-way analysis of variance (ANOVA) was performed on the three variables that make up the financial inclusion index, and it was found that all of them present a p-value less than 0.05. This indicates that the clusters contain very similar observations within each group. The most significant indicator among the groups was the financial one, with an F value of 23.43, as shown in Table 8.
Table 8. Hierarchical clustering method (ANOVA)
| Variable | F Value | p-value (Pr (>F)) |
| Government | 14,45 | 9,173-07 ***¹ |
| Financial | 23,43 | 5.39e-09 ***² |
| Employers | 20,44 | 2.48e-8 ***³ |
Note. ¹The p-value is 0.0000009173, i.e., highly significant; ²The p-value is 0.00000000539, i.e., highly significant; ³The p-value is 0.0000000248, i.e., highly significant; ***: p < 0.001.
In other words, access to bank accounts and loans with ease, the development and maturity of fintechs, the use of tools for instant payment, trust in the financial sector, among others, are elements that make up the financial variable and that, statistically, have a significant effect on the analysis of financial inclusion.
After performing the hierarchical clustering method, the output of five clusters was used in the non-hierarchical K-means clustering method. Then, the Elbow method was applied to identify the optimal number of clusters. It was observed that, after the value of five, there is a significant drop in the improvement of the grouping, as shown in Figure 5.

Source: Original research results.
Subsequently, non-hierarchical K-means clustering was performed with the parameter of five centers for this function, which resulted in the clusters described in Table 5.
Table 5. K-means and complete linkage method
| Grouping | Countries |
| 1 | France, Spain, Chile, Mexico, South Africa, Peru, Colombia, Nigeria, Ghana and Argentina |
| 2 | Israel, Vietnam, Malaysia, China, Taiwan, United Arab Emirates, Poland, Indonesia, Turkey, Saudi Arabia |
| 3 | United Kingdom, Australia, South Korea, Canada, New Zealand and Japan |
| 4 | Singapore, Hong Kong, Switzerland, Denmark and Norway |
| 5 | Thailand, Brazil, and India |
The cluster 1 was formed by ten countries that, for the most part, are positioned in the last places of the general ranking of the financial inclusion indicator, according to Table 9.
Table 9. Cluster 1 – K-means
| Country | Internship | Inclusion | Classification | Government | Financial | Employers |
| France | PP¹ | 45,39 | 25 | 55,54 | 35,24 | 45,45 |
| Spain | RES.² | 41,43 | 29 | 48,04 | 35,95 | 36,36 |
| Chile | RES.² | 38,91 | 33 | 43,63 | 35,57 | 32,75 |
| Mexico | RES.² | 37,55 | 35 | 40,66 | 31,37 | 51,37 |
| South Africa | RES.² | 33,1 | 36 | 35,43 | 29,98 | 36,63 |
| Peru | RES.² | 31,39 | 38 | 35,25 | 22,46 | 54,23 |
| Colombia | RES.² | 30,19 | 39 | 29,97 | 27,03 | 45,45 |
| Nigeria | LAN3 | 29,56 | 40 | 25,15 | 27,77 | 57,42 |
| Ghana | PP¹ | 24,85 | 41 | 23,32 | 19,97 | 53,68 |
| Argentina | RES.² | 23,86 | 42 | 30,72 | 11,18 | 50,08 |
Note. ¹PP: Pilot project; ²PESQ: Research project; ³LAN: Launched.
It is interesting to note that seven countries in Cluster 1 are in the research stage of CBDC development, which could improve the financial variable and, in turn, the financial inclusion index, directly linked to economic development.
The cluster 2 was formed by ten countries that, for the most part, present medium scores for the three variables studied. It should be noted that three countries (Israel, Malaysia, and Turkey) are in the CBDC proof-of-concept phase, according to Table 10.
Table 10. Cluster 2 – K-means
| Country | Internship | Inclusion | Classification | Government | Financial | Employers |
| Israel | PC¹ | 53,71 | 15 | 57,59 | 48,82 | 58,24 |
| Vietnam | RES.² | 53,11 | 17 | 55,37 | 45,50 | 77,18 |
| Malaysia | PC¹ | 52,84 | 18 | 51,8 | 48,92 | 75,19 |
| China | PPP³ | 51,53 | 19 | 51,77 | 45,13 | 79,30 |
| Taiwan | RES.² | 49,35 | 20 | 53,40 | 43,48 | 57,54 |
| United Arab Emirates | PPP³ | 46,83 | 24 | 51,11 | 38,03 | 67,14 |
| Poland | RES.² | 42,09 | 28 | 49,40 | 30,79 | 60,04 |
| Indonesia | RES.² | 41,35 | 30 | 51,86 | 26,45 | 61,15 |
| Turkey | PC¹ | 40,93 | 31 | 39,99 | 35,60 | 69,14 |
| Saudi Arabia | PPP³ | 38,10 | 34 | 41,22 | 28,11 | 69,05 |
Note. ¹PC: Proof of concept; ²PESQ: Research project; ³PP: Pilot project.
The cluster 3 was formed by six countries that show average performance in the variables “government” and “financial”, and quite weak performance in the indicator “employers”, as shown in Table 11. This cluster includes five countries with CBDCs in the proof-of-concept stage.
Table 11. Cluster 3 – K-means
| Country | Internship | Inclusion | Classification | Government | Financial | Employers |
| United Kingdom | RESEARCH.¹ | 60,82 | 7 | 57,56 | 70,68 | 31,12 |
| Australia | PC² | 58,88 | 9 | 58,94 | 62,99 | 40,18 |
| South Korea | PC² | 55,06 | 13 | 51,03 | 65,61 | 25,71 |
| Canada | PC² | 53,8 | 14 | 58,85 | 54,33 | 28,66 |
| New Zealand | PC² | 53,59 | 16 | 60,73 | 49,3 | 40,76 |
| Japan | PC² | 43,16 | 27 | 55,11 | 38,62 | 9,82 |
Note. ¹PESQ: Research project; ²PC: Proof of concept.
The cluster 4 was formed by seven countries that rank among the best in financial inclusion, four of which have CBDCs in the proof-of-concept stage, according to Table 12.
Table 12.Cluster 4 – Kmeans
| Country | Internship | Inclusion | Classification | Government | Financial | Employers |
| Singapore | PP¹ | 73,9 | 1 | 75,32 | 70,74 | 81,75 |
| Hong Kong | PC² | 71,09 | 2 | 75,3 | 67,12 | 69,97 |
| Switzerland | PP¹ | 68,43 | 3 | 71,65 | 64,82 | 70,2 |
| USA | PC² | 66,21 | 4 | 54,91 | 77,42 | 66,57 |
| Sweden | PC² | 65,47 | 5 | 64,16 | 69,94 | 51,28 |
| Denmark | RESEARCH.³ | 65,25 | 6 | 65,75 | 65,88 | 60,19 |
| Norway | PC² | 59,42 | 8 | 68,78 | 51,43 | 53,27 |
Note. ¹PP: Pilot project; ²PC: Proof of concept; ³PESQ: Research project.
The cluster 5 was formed by three countries that present low scores for the variable “government” and considerable scores for the financial and “employers” indicators, as shown in Table 13.
Table 13.Cluster 5 – K-means
| Country | Internship | Inclusion | Classification | Government | Financial | Employers | |
| Thailand | PC¹ | 58,79 | 10 | 44,32 | 71,1 | 68,53 | |
| Brazil | PC¹ | 47,63 | 21 | 39,45 | 54,24 | 54,66 | |
| India | PP² | 45,19 | 26 | 29,46 | 51,5 | 87,54 | |
Note. ¹PoC: Proof of concept; ²Pilot project.
According to the outputs generated from the variables, it was verified that all three present a p-value less than 0.05. This confirms that the clusters contain very similar observations within each group, as shown in Table 14.
Table 14. K-means method – ANOVA
| Variable | F-statistic value | SWOT (>F) |
| Governmental | 17,72 | 1.15e-7 ***¹ |
| Financial | 34,99 | 4.39e-11 ***² |
| Employers | 17,80 | 1.1e-07 ***³ |
Note. ¹The p-value is 0.000000115, i.e., highly significant; ²The p-value is 0.0000000000439, i.e., highly significant.; ³ The p-value is 0.00000011, i.e., highly significant.
The most discriminant variable between the groups, which presented the highest F statistic (and significant), was the financial variable, with an F value of 34.99. This means that the volume of real-time transactions, the relative levels of access to credit, access to bank accounts, and advances in the fintech sector, indicators that make up the support pillar of the financial system, are determinants for measuring financial inclusion in countries. The higher the countries’ scores in this pillar, the more they stand out in promoting effective financial inclusion for their population.
From the comparative analysis of the results of the hierarchical and non-hierarchical methods, the following conclusions were obtained:
- The cluster 1 of the hierarchical method and the cluster 4 of the non-hierarchical method are composed of countries well-positioned in the financial inclusion ranking, with expressive scores in the three variables studied, which indicates that they are mature economies in this aspect. The use of CBDC can further enhance the growth of these economies.
- The clusters 5 of the hierarchical and non-hierarchical method present countries with low financial inclusion, which suggests that the strategy of using CBDC could leverage their economies, so that the variables “government” and “financial” achieve higher scores.
- In general, developed economies tend to group into specific clusters, as occurs in cluster 1 of the hierarchical method and cluster 4 of the non-hierarchical method, while emerging and developing economies concentrate in other groups, such as cluster 5 of both methods.
- Economies that rely on strong governmental and financial system support tend to show lower levels of employer support – and the inverse is also observed.
- From the analysis of the clusters formed, it is observed that developed economies, such as the USA, Switzerland, and Sweden, tend to present higher scores in the governmental and financial variables. On the other hand, emerging economies, such as Nigeria, Ghana, and Argentina, generally stand out in the “employers” indicator.
This result suggests that, as developing countries have less structured public and financial systems, employers end up playing a more active role in the financial well-being of workers, by offering benefits such as pension contributions, insurance, and financial guidance. More mature economies, on the other hand, tend to rely on strong governmental support and robust financial systems, which reduces the need for direct employer intervention. Therefore, paradoxically, they score lower on this specific variable. The results suggest that financial inclusion, mainly supported by the “financial” variable, can be a powerful indicator for driving economic development.
After the evaluation and interpretation of the collected data, it was possible to perceive that the countries that present strong support from the government and the financial system formed a specific cluster by the K-means method, and, for the most part, they are developed economies, such as USA, Denmark, Norway, Switzerland.
In turn, emerging countries, such as Thailand, Brazil, and India, formed another cluster that stands out for strong employer support, suggesting low investment in financial education and consumer protection, limited digital infrastructure that hinders access to online financial services, a less developed financial system with lower access to credit and bank accounts, weak regulation, and little presence of fintechs.
In terms of CBDC development, emerging countries are mostly in an advanced phase, with digital currencies at the proof-of-concept stage, such as DREX for Brazil, CBDC Thailand for Thailand, E-ringgit for Malaysia, and Digital Lira for Turkey. In this context, it is possible to ascertain that countries with deficiencies in the “government” and “financial” variables may offer greater financial inclusion with the launch of CBDC; however, it is still necessary to await the effective circulation of CBDC to assess economic growth.
Another observed factor is the relevance of the “financial” variable, which proved to be the most significant in both the hierarchical clustering method and the K-means method. This indicates that financial technology, trust in financial services, the presence of fintechs, among other aspects, are important in the current digital economy scenario to promote greater financial inclusion.
It should be noted the sensitivity of the results in relation to the countries selected for the study, since countries that develop CBDCs but are not included in the adopted global financial inclusion index were not considered. It is important to reinforce that, given the multiplicity of ongoing CBDCs, which have specific technological particularities, the present analysis is merely exploratory, and the results do not imply causality, but only observational patterns.
In summary, this study will serve as a basis for new works that can contribute to applying data science in the analysis, interpretation, and grouping of countries that aim to develop CBDCs as an effective public policy strategy to expand financial inclusion in low-income nations.
REFERENCES
[1] BIS. 2022.Options for access to and interoperability of CBDCs for cross-border payments. Disponível em: https://www.bis.org/publ/othp52.htm. Acesso em: 22 out. 2023.
[2] Tan, B. J. 2023. IMF Working Paper. Monetary and Capital Markets Central Bank Digital Currency and Financial Inclusion.
[3] Abreu, P.V.S. 2023 Real digital (Drex): o impacto das moedas digitais fiduciárias nas stablecoins. Revista Jus Navigandi. Disponível em: https://jus.com.br/artigos/105546/real-digital-drex-o-impacto-das-moedas-digitais-fiduciarias-nas-stablecoins. Acesso em: 13 ago. 2023.
[4] Cernev, A.K.; Diniz, E.H. 2021. Caminhos para pagamentos digitais. GV Executivo. 20(2): 13-15. https://doi.org/10.12660/gvexec.v20n2.2021.83950.
[5] CBDC Tracker. s/n. Today’s Central Bank Digital Currencies Status. Disponível em: https://cbdctracker.org/. Acesso em: 10 out. 2023.
[6] BIS. 2021. Ready, steady, go? Results of the third BIS survey on central bank digital currency (CBDC). Disponível em: https://www.bis.org/publ/bppdf/bispap114.pdf. Acesso em: 22 ago. 2023.
[7] World Bank Group. 2023. Financial Inclusion Overview. Disponível em: https://www.worldbank.org/en/topic/financialinclusion/overview. Acesso em: 29 set. 2023.
[8] Governo do Brasil. 2024. Declaração final do G20 exalta combate à fome, taxação de super-ricos e mudanças na governança global. https://www.gov.br/planalto/pt-br/acompanhe-o-planalto/noticias/2024/11/declaracao-final-do-g20-exalta-combate-a-fome-taxacao-de-super-ricos-e-mudancas-na-governanca-global. Acesso em: 10 julho 2025.
[9] Beck, T.; Demirguc-Kunt, A.; Peria, M. S. M. 2007. Reaching out: Access to and use of banking services across countries. Journal of Financial Economics. 85(1) 234-266.
[10] World Bank Group. 2025. Global Findex Database 2025. Disponível em: https://globalfindex.worldbank.org/. Acesso em: 10 jul. 2025.
[11] Allen, M.; Esser, A.; Cooper, B. 2019. Central Bank Digital Currency (CBDC) and financial inclusion. Cenfri. Disponível em: https://cenfri.org/publications/central-bank-digital-currency-cbdc-and-financial-inclusion/. Acesso em: 22 out. 2023.
[12] Narula, N.; Swartz, L.; Frizzo-Barker, J. 2023. CBDC: Expanding financial inclusion or deepening the divide? Exploring design choices that could make a difference. MIT Digital Currency Initiative & Maiden Labs. Disponível em: https://www.dci.mit.edu/projects/cbdc-expanding-financial-inclusion-or-deepening-the-divide. Acesso em: 22 out. 2023.
[13] Global Financial Inclusion Index 2023. 2023. Principal Financial Group. Disponível em: <secure02.principal.com/publicvsupply/GetFile?fm=WW1074&ty=VOP&_gl=1*8lh25p*_gcl_au*MTkxOTU1MjY0Ny4xNzU1NTI2NTQw*_ga*MTQ1ODI1NTgyMi4xNzU1MjY2NzAw*_ga_GP3ZP21MGH*czE3NTU3MDEzMjUkbzUkZzEkdDE3NTU3MDEzNDIkajQzJGwwJGgw >. Acesso em 20 de fev. 2024.
[14] Gil, A.C. 2002. Como elaborar projetos de pesquisa. 4ed. São Paulo, SP: Atlas.
[15] Fávero, L.P.; Belviore, P.P. 2017. Manual de análise de dados: estatística e modelagem multivariada com excel®, SPSS e Stata. Rio de Janeiro, RJ: Elsevier.
[16] Hocking. A.; Geach. J.E.; Sun. Y.; Davey. N. 2018. An automatic taxonomy of galaxy morphology using unsupervised machine learning. Monthly Notices of the Royal Astronomical Society 473(1): 1108-1129. https://doi.org/10.1093/mnras/stx2351.
[17] Johnson, R.; Wichern, D. 2002. Applied Multivariate Statistical Analysis. 4ed. New Jersey: Prentice-Hall.
[18] Bussab, W.; Miazaki, E.; Andrade, D. 1990. Introdução à análise de agrupamentos. São Paulo, SP: Associação Brasileira de Estatística.
[19] Bholowalia, P.; Kumar, A. 2014. EBK-means: A clustering technique based on elbow method and K-means in WS. International Journal of Computer Applications. 105(9): 17-24.
[20] Tussevana, M. s/d. K-means Clustering (Agrupamento K-means). Disponível em: https://aprenderdatascience.com/K-means-clustering-agrupamento-K-means/. Acesso em: 18 out. 2023.
COMO CITAR
Chalela, M.S.; Martins, A.C. 2025. Inclusão financeira dos países que desenvolvem Central Bank Digital Currency por meio da técnica de clusterização. Revista E&S, 6: e2024051.
ABOUT THE AUTHORS
Magali Susana Chalela – Data Science and Analytics Specialist. Tax manager. Bradesco Bank, Cidade de Deus, s/n, 06029-900, Vila Yara, Osasco, SP, Brazil.
Anna Carolina Martins – PhD in Economics. Supervising Professor. Rua Cezira Giovanoni Moretti, 580, Santa Rosa, 13414-157, Piracicaba, São Paulo.