
September 15, 2026
Financial Customer Segmentation by Clustering and Unsupervised Learning
Luciana Martins Esteves; Henrique Raymundo Gioia
DOI: 10.22167/2675-6528-202602263
Article derived from a Final Course Work (TCC), with content based on the student’s original work and adapted to the editorial format of the Revista E&S with the support of the ResumeAI tool, an artificial intelligence solution developed by the Pecege Institute for textual synthesis and organization.
Summary
The growing availability of data in the financial sector has made the use of analytical techniques for segmentation and decision support relevant. The study aimed to apply clustering techniques to a customer base in order to identify homogeneous groups and interpret distinct profiles based on financial, behavioral, and registration variables. Methodologically, the research was classified as applied, descriptive, and quantitative, conducted as a case study with 750 records. Initially, the data were prepared, treated, and standardized. Subsequently, the K-Means algorithm was applied, testing different values of k and using internal validation metrics (WCSS, silhouette, Calinski-Harabasz, and Davies-Bouldin). A comparison with hierarchical methods and complementary statistical analysis by ANOVA was also performed. The results showed that, although the solution with two clusters presented better statistical performance in some metrics, the configuration with three groups had greater interpretive and analytical capacity. The identified clusters distinguished customers with higher financial vulnerability, an intermediate profile, and higher economic value, with relevant differences in income, indebtedness, credit utilization, investment, and emergency savings. It was concluded that clustering was effective in segmenting the analyzed base and demonstrated potential for supporting profile interpretation and data-driven decision-making.
Keywords: unsupervised learning; data science; clustering; K-Means; customer segmentation.
1. Introduction
The growing digitalization of the financial sector has significantly expanded the generation, storage, and strategic use of customer data. In the contemporary banking context, competitiveness is no longer solely dependent on the offering of standardized products but now requires greater analytical capacity to understand consumer profiles, behaviors, and specific needs.
In Brazil, this movement has been intensified by the expansion of digital channels, the maturation of Open Finance, and the growing use of artificial intelligence and predictive analytics for personalizing products and services. The Brazilian Federation of Banks (FEBRABAN, 2025) points out that personalization is driven, among other factors, by the use of data shared via Open Finance and by analyses based on artificial intelligence. The Central Bank of Brazil (BCB, 2023) highlights that the Open Finance ecosystem seeks to expand access to financial services that are more suited to each client’s profile and needs. In this scenario, the use of analytical methods capable of transforming large volumes of data into applicable knowledge has become relevant for both competitive differentiation and improving customer experience.
From a theoretical point of view, clustering occupies an important position in Data Science and data mining by allowing the identification of latent structures in unlabeled databases. Jain, Murty, and Flynn (1999) define clustering as the unsupervised classification of patterns into groups, highlighting its usefulness as an exploratory data analysis step. In the same direction, Han, Kamber, and Pei (2012) treat clustering as one of the central data mining techniques for pattern discovery, organization of complex databases, and support for knowledge generation from data.
From a broader perspective of statistical learning, Hastie, Tibshirani, and Friedman (2009), as well as James et al. (2021), situate unsupervised methods as appropriate tools when the researcher’s interest is less in predicting a response variable and more in understanding the internal structure of the data, identifying similarities, and describing profiles based on multiple observed attributes. Thus, clustering proves especially relevant when the research problem involves customer heterogeneity, behavioral diversity, and the need for evidence-based segmentation, rather than just intuitive or administrative criteria.
In the banking and financial sector, recent literature has reinforced the utility of analytical customer segmentation for personalization, retention, offer design, and commercial prioritization. Recent studies show that clustering algorithms, especially K-Means, have been employed to group customers based on financial, transactional, and behavioral attributes, allowing for the distinction of consumption patterns, risk, and economic value. In a recent work, Yan et al. (2025) demonstrated that clustering approaches applied to the banking context can support more precise marketing strategies, while Nofal (2024) showed that the combination of transactional characteristics and machine learning techniques enables the identification of higher-value customers in real banking databases.
These results dialogue with the broader applied literature, which recognizes segmentation as an instrument to convert raw data into actionable profiles, with the potential to guide more precise decisions. Despite this, the quality of segmentation depends on consistent methodological choices, such as variable selection, data standardization, definition of the number of clusters, and validation of the found solution, which requires technical rigor and theoretical justification so that the results are not interpreted as simple arbitrary groupings.
The relevance of this work stems, therefore, from two complementary aspects. On a practical level, the research responds to the growing need to segment customers more precisely in financial environments marked by competition, digitalization, and intensive personalization. On an academic level, the study contributes by applying Data Science fundamentals to a concrete segmentation problem, articulating clustering techniques with validation metrics and analytical interpretation of the formed groups. In this way, a merely descriptive or institutional reading of the phenomenon is avoided, and a methodologically sound approach is reinforced, supported by the literature on data mining, unsupervised learning, and financial applications. In this sense, the objective of this work was to apply clustering techniques to a customer base in the financial sector, in order to identify segments with homogeneous and statistically distinguishable characteristics, capable of supporting profile interpretation and supporting data-driven decisions.
2. Material and Methods
The research was classified as applied, descriptive, and quantitative. Regarding its purpose, it sought to generate knowledge with practical utility for understanding and segmenting customers based on financial and behavioral data. In relation to its objectives, it aimed to identify, analyze, and describe patterns present in the database, highlighting differences between the formed groups. From the perspective of the problem approach, it was quantitative, involving the use of numerical data, statistical metrics, and computational techniques. In terms of technical procedures, the work assumed the characteristics of a case study, developed from a specific database analyzed in depth.
The database used was composed of 750 customer records and 26 columns, including variables of a financial, behavioral, and registration nature, in addition to the generated cluster labels. It was an anonymized database, originating from the analytical environment of an institution in the financial sector operating in Brazil, without nominal identification of the organization, customers, or individualized sensitive information. The analyzed variables covered indicators of income, assets, account balance, credit limit, monthly investment, credit utilization, delinquency percentage, indebtedness rate, emergency fund, relationship duration, predominant interaction channel, and classification into previously identified segments. The choice of these variables was justified by their adherence to the research problem, requiring attributes capable of discriminating different customer profiles in terms of economic value, risk exposure, intensity of use of financial products, and relationship pattern with the institution. The final database incorporated the labels generated by the applied clustering methods, including K-Means and hierarchical approaches.
The data preparation and treatment stage aimed to ensure the quality, consistency, and suitability of the database for applying clustering techniques. Initially, an inspection was carried out to identify inconsistencies, such as duplicate records (removed) and missing values (treated according to the nature of the variable, with simple imputation or maintenance). Subsequently, variable typing adjustments were made (numeric, categorical, and temporal). Exploratory analysis was also conducted to understand the distribution of variables and identify possible outliers, which were kept when they represented real customer characteristics and removed only if they were inconsistencies or errors. Relevant categorical variables were retained for cluster interpretation. The database was structured in a format suitable for applying clustering algorithms.
The standardization of variables was performed using the z-score, a technique that transforms variables to the same scale with a mean of zero and a standard deviation of one. This procedure was applied exclusively to the numerical variables used in the modeling stage, with the objective of ensuring that all attributes contributed in a balanced way to the formation of groups, preventing variables with a larger numerical scale from exerting disproportionate influence.
The clustering stage was performed to identify homogeneous groups of customers, using the K-Means algorithm. K-Means divides a dataset into k groups, seeking greater internal similarity and external dissimilarity, measured by Euclidean distance. The process involves defining k, random selection of initial centroids, assignment of observations to the nearest centroid, and iterative recalculation of centroids until convergence. The algorithm’s objective is to minimize the sum of squared distances between points and the centroids of their respective clusters (WCSS), represented by Equation 1:
WCSS = Σ₁=1* Σ(x ∈ Ci) ||x – μ₁||²
(Eq. 1)
Where Ci represents the set of points belonging to cluster i, x represents each observation of the group, and μ¡ corresponds to the centroid of that cluster. The algorithm was applied to the previously treated and standardized database, being justified by its ability to handle moderately sized databases and multiple numerical variables.
The definition of the number of clusters (k) and the validation of the quality of the groupings were essential steps. Different values of k, ranging from 2 to 10, were tested using internal validation metrics: Within-Cluster Sum of Squares (WCSS), silhouette score, Calinski-Harabasz index, and Davies-Bouldin index. The joint analysis of these metrics indicated better statistical performance for the configuration with two clusters (k = 2). However, the adoption of three clusters (k = 3) was chosen for the final analysis, based on the greater capacity for interpretation and segmentation of customer profiles. Additionally, the inertia curve (elbow method) was analyzed, which showed a significant reduction in variability up to a certain point.
To compare the structure of the groups and evaluate the robustness of the segmentation, hierarchical clustering approaches were tested, including single linkage, complete linkage, and average linkage. To compare the generated clusters, the Adjusted Rand Index (ARI) was used, which assesses the degree of agreement between two clustering solutions. The results showed that the complete linkage and average linkage hierarchical methods exhibited high agreement with each other, while single linkage showed low stability. In comparison, K-Means produced more balanced groups in terms of observation distribution and showed moderate agreement with the more robust hierarchical approaches.
After the definition and validation of the groupings, the analysis of the cluster profiles was carried out to interpret their predominant characteristics. The analysis was conducted based on the means of the numerical variables in each cluster, considering financial, behavioral, and relationship indicators. Categorical variables, such as predominant interaction channel and segmentation classification, were also considered to enrich the interpretation. The clusters were described interpretatively, synthesizing the main traits of each group and comparing the differences that distinguish them from each other.
In order to verify if the identified clusters presented statistically significant differences, ANOVA was applied to the numerical variables considered in the study. ANOVA was applied to the main financial and behavioral variables in the database, such as monthly income, account balance, investment, credit utilization, delinquency percentage, and indebtedness rate. In addition to statistical significance (p-value), the magnitude of the effect was considered through partial eta squared (η²). The ANOVA results indicated that most of the analyzed variables presented statistically significant differences between the clusters, with p-values below the adopted significance level, and several variables presented high values of partial eta squared.
The execution of the analytical pipeline was performed with the Python programming language. For data treatment and manipulation, the Pandas and NumPy libraries were used. Exploratory data analysis and visualization, including inertia curve analysis, were conducted with the support of the Matplotlib library. For the application of clustering techniques (K-Means and hierarchical methods) and cluster validation (silhouette score, Calinski-Harabasz index, and Davies-Bouldin index), the Scikit-learn library was used. Statistical analysis, including ANOVA, was performed with the support of specialized computational statistics libraries. The development environment used was based on interactive notebooks.
3. Results and Discussion
The application of clustering techniques to the customer base evidenced the capacity to transform heterogeneous data into analytically distinct and interpretable groups, aligning with the literature on data mining and unsupervised learning. The quality of the segmentation depended on the combination of internal cohesion, separation between groups, and substantive utility of the results (Jain, 2010; Han, Kamber, and Pei, 2012; Hair et al., 2019). The discussion was organized to examine the definition of the number of clusters, the comparison between methods, the balance of the final partition, and the interpretation of the identified profiles.
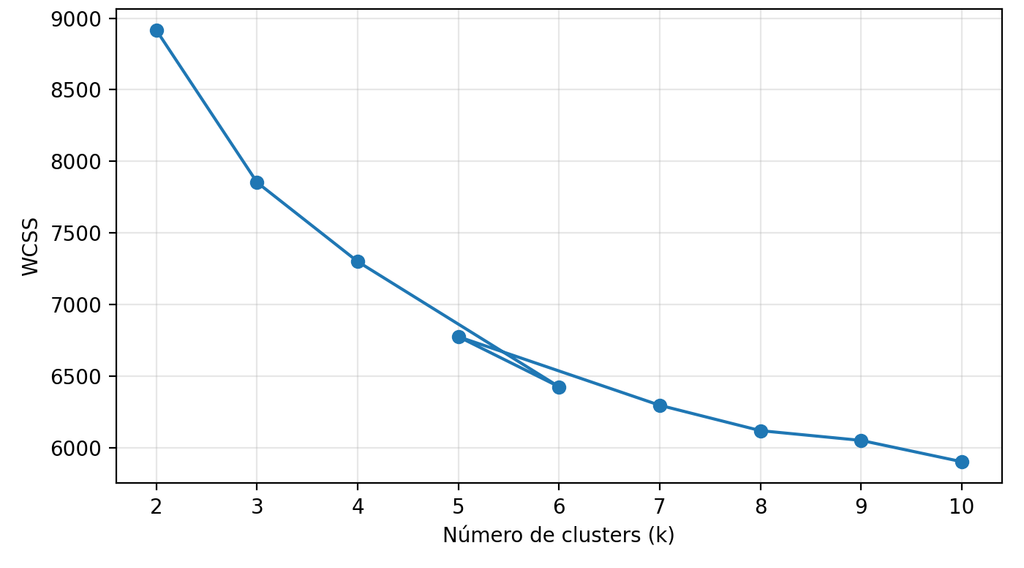
The inertia curve was used to evaluate the reduction of intra-cluster variability as the number of groups increased. Figure 1 illustrates this behavior.
Figure 1. K-Means inertia curve
Source: Original research results
Figure 1 demonstrated a sharp drop in inertia between k=2 and k=4, followed by a progressively smaller reduction for higher values. This pattern, consistent with the elbow method, suggested that the greatest compaction gains occurred in the early partitions. This indicates that solutions with few clusters already capture a relevant portion of the base’s internal structure, but joint analysis with additional metrics and the interpretability of the generated segments are indispensable.
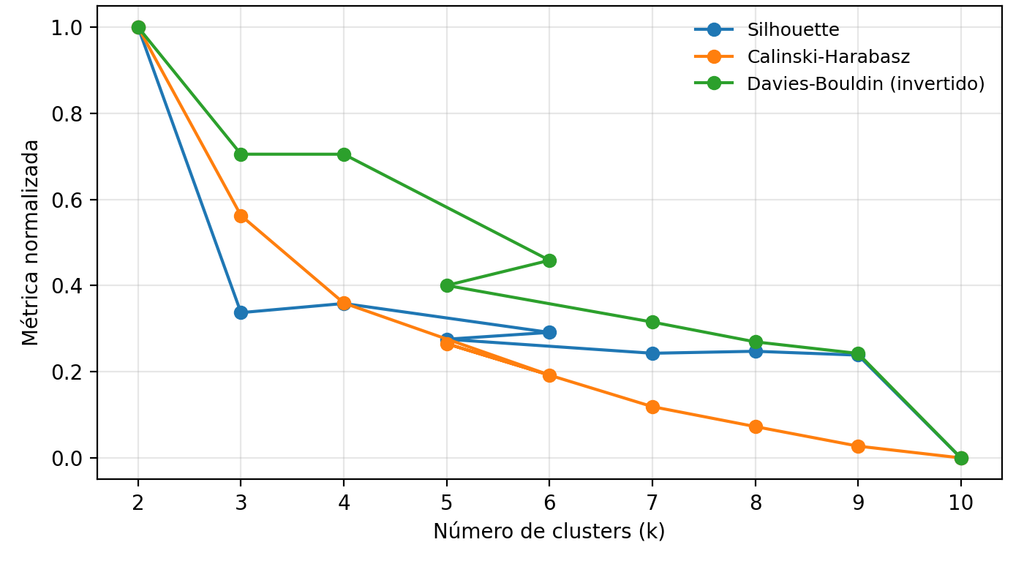
The normalized comparison of internal validation metrics, presented in Figure 2, allowed different quality criteria to be confronted for the choice of the number of clusters.
Figure 2. Normalized comparison of internal validation metrics
Source: Original research results
Figure 2 indicated that k=2 presented the best relative performance in the silhouette, Calinski-Harabasz, and Davies-Bouldin (inverted) metrics, signaling greater balance between internal cohesion and separation between groups. However, the decision was made to deepen the analysis with k=3, a methodologically defensible choice that considered the greater interpretability and segmentation capacity of customer profiles, according to literature that recommends considering the analytical and practical utility of clusters (Han, Kamber, and Pei, 2012).
To compare the structural consistency of the groupings obtained by distinct techniques, Table 1 presents the Adjusted Rand Index (ARI) values between the K-Means solutions and the hierarchical methods.
Table 1. Comparison between clustering methods by Adjusted Rand Index
| Comparison | ARI | Reading |
|---|---|---|
| kmeans vs. hier_single | -0.000 | Low |
| kmeans vs. hier_complete | 0.452 | Moderate |
| kmeans vs. hier_average | 0.581 | Moderate |
| hier_single vs. hier_complete | 0.007 | Low |
| hier_single versus hier_average | 0.009 | Low |
| hier_complete versus hier_average | 0.886 | High |
Source: Original research results
Table 1 showed that the greatest convergence occurred between complete linkage and average linkage, with a high ARI, while single linkage presented low adherence to the other solutions. This result confirmed the limitation of single linkage in datasets with higher variability. K-Means, in turn, presented moderate agreement with the more robust hierarchical approaches, suggesting that the final partition preserved structural coherence without losing balance and interpretability.
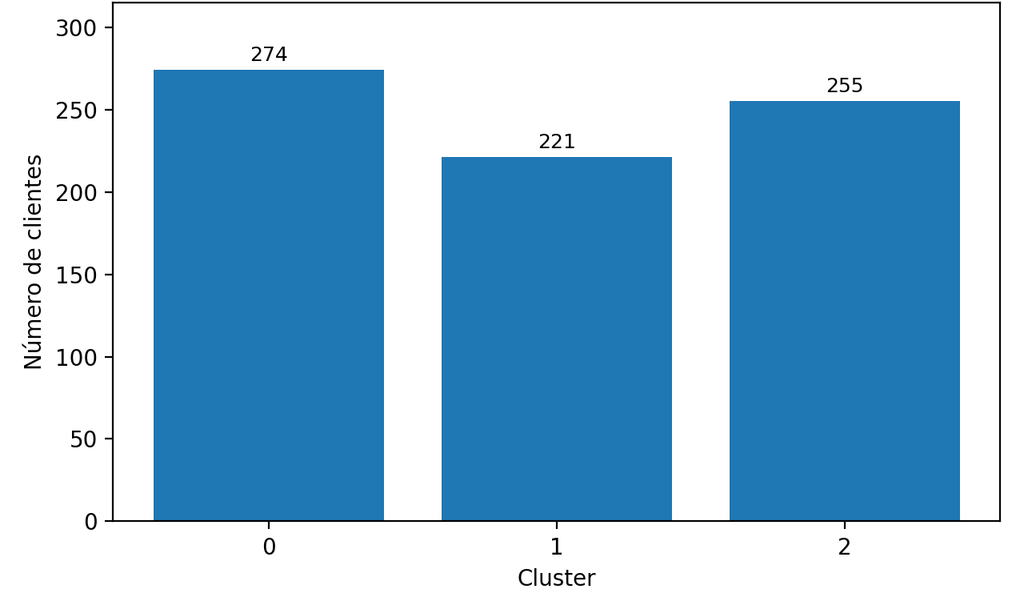
The final distribution of clients in the adopted solution can be observed in Figure 3, which allows verifying whether the formed groups remained representative and operationally useful.
Figure 3. Distribution of clients by cluster in K-Means
Source: Original research results
Figure 3 showed a relatively balanced partition, with 274 clients in Cluster 0, 221 in Cluster 1, and 255 in Cluster 2. This balance is relevant from an analytical standpoint, as it reduces the risk of a residual cluster compromising the substantive interpretation of the results, ensuring sufficient critical mass to support consistent interpretations.
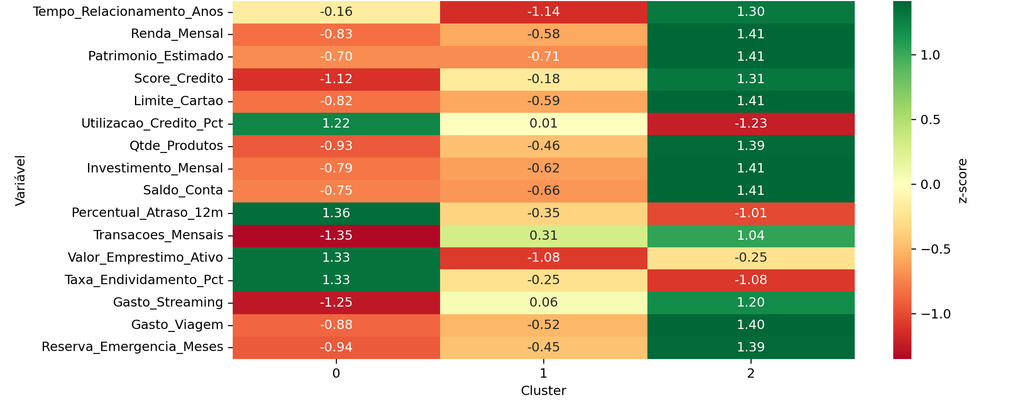
Figure 4 deepens the reading of the groupings by presenting the standardized profile of the clusters in the most relevant variables of the model.
Figure 4. Standardized profile of K-Means clusters
Source: Original research results
Figure 4 showed three quite distinct structures. Cluster 0 concentrated higher standardized values in credit utilization, delinquency, and indebtedness, combined with lower levels of income, wealth, investment, and emergency savings, characterizing a profile of greater financial vulnerability. Cluster 1 presented a more intermediate behavior, with shorter relationship time and generally moderate indicators, suggesting a transition segment. Cluster 2, on the other hand, brought together the highest relative levels of income, wealth, credit limit, investment, account balance, and emergency savings, in addition to lower delinquency and lower credit utilization, configuring the group with the highest economic value and lowest risk sensitivity.
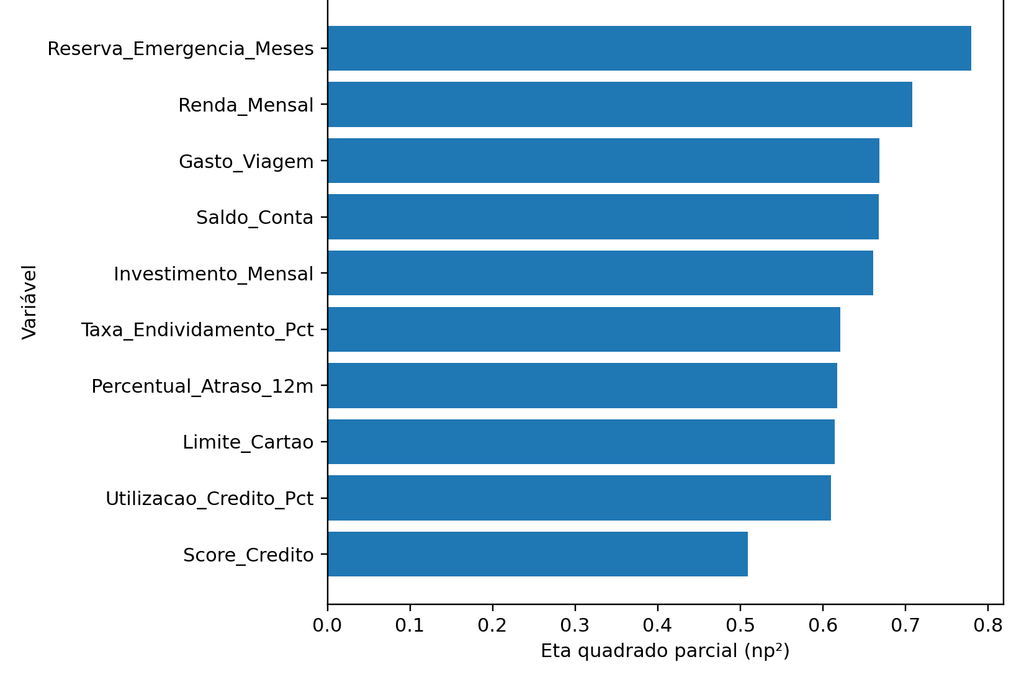
To verify which attributes contributed most to the statistical separation between the groups, Figure 5 presents the main discriminant variables according to the magnitude of the partial eta squared in the ANOVA.
Figure 5. Main discriminant variables between clusters
Source: Original research results
Figure 5 demonstrated that emergency savings, monthly income, travel expenses, account balance, monthly investment, indebtedness rate, delinquency percentage, credit limit, credit utilization, and credit score were the attributes with the greatest discriminant power among the clusters. This result reinforces that the segmentation was not formed by statistical noise, but by structural differences associated with financial capacity, liquidity, consumption patterns, and credit risk. The predominance of these variables strengthens the internal validity of the solution, confirming that the groups were defined by dimensions substantively coherent with the problem studied.
Together, the results showed consistency between data preparation, modeling, validation, and interpretation of the clusters. Although internal metrics indicated a better statistical fit for k=2, the choice of k=3 revealed greater analytical discrimination power and greater practical utility, which is compatible with applied Data Science studies when the methodological decision is explicitly stated transparently. The base analysis supports that clustering was able to convert a complex financial base into useful segments for interpreting customer profiles and supporting data-driven decision-making.
The execution of the analytical pipeline was performed with the aid of the Python programming language, using libraries such as Pandas and NumPy for data handling, Matplotlib for exploratory analysis, and Scikit-learn for clustering (K-Means and hierarchical methods) and validation. Statistical analysis, including ANOVA, was also supported by specialized libraries. The interactive notebook environment facilitated the organization and reproducibility of the analyses (VanderPlas, 2016).
The analysis of the results obtained from the application of the clustering pipeline evidenced that the segmentation of the customer base was capable of identifying consistent and statistically relevant patterns, in line with the study’s objective of identifying homogeneous and interpretable groups through unsupervised learning techniques. The differences observed between the clusters were statistically significant, with variables such as monthly income, emergency savings, investment, and indebtedness rate presenting high discriminant power, which reinforces that the groupings reflect real differences in the data structure (Hair et al., 2019). The obtained segmentation not only met the analytical purpose of the research but also showed potential for practical application, by allowing the differentiation of strategies according to the profile of the identified groups.
4. Conclusion
This research sought to apply clustering techniques to a customer base in the financial sector, with the purpose of identifying homogeneous and statistically distinguishable segments, capable of supporting profile interpretation and data-driven decision-making. It was found that clustering was effective in segmenting the analyzed base, revealing three distinct customer profiles. The first group was characterized by greater financial vulnerability, with high levels of credit utilization, delinquency, and indebtedness, and lower levels of income, wealth, investment, and emergency savings. The second group presented an intermediate profile, while the third gathered customers of higher economic value, with superior indicators of income, wealth, investment, and emergency savings, and lower risk sensitivity. Statistical analysis confirmed that variables such as monthly income, emergency savings, investment, and indebtedness rate were the main discriminating attributes among the groups, reinforcing the internal validity of the segmentation. This approach demonstrated the potential of unsupervised learning techniques to transform complex data into structured knowledge, offering a relevant practical contribution to the differentiation of strategies and decision-making in the financial sector.
However, some limitations of the study should be acknowledged. The analysis was performed based on a single database and a specific selection of variables, which restricts the generalization of the results to other contexts or populations. Although the solution with three clusters was adopted for its greater interpretive utility, internal metrics indicated better statistical performance for a configuration with two groups, suggesting that the final choice involved a criterion of analytical utility. For future studies, it is suggested to expand the analytical base with new variables, such as indicators of transactional behavior and digital relationship, in order to deepen the discriminant capacity of the models. It is also recommended to test other clustering approaches, such as DBSCAN or Gaussian Mixture Models, and explore the integration between clustering and supervised models for risk or purchase propensity prediction, expanding the applicability of Data Science in financial environments.
Bibliographic References
Banco Central do Brasil [BCB]. (2023). Open Finance no Brasil. https://www.bcb.gov.br/estabilidadefinanceira/openfinance
Federação Brasileira de Bancos [FEBRABRAN]. (2025). Pesquisa Febraban de Tecnologia Bancária 2025. https://cmsarquivos.febraban.org.br
Han, J., Kamber, M., & Pei, J. (2012). Data mining: Concepts and techniques (3rd ed.). Morgan Kaufmann.
Hastie, T., Tibshirani, R., & Friedman, J. (2009). The elements of statistical learning: Data mining, inference, and prediction (2nd ed.). Springer.
Jain, A. K., Murty, M. N., & Flynn, P. J. (1999). Data clustering: A review. ACM Computing Surveys, 31(3), 264-323.
James, G., Witten, D., Hastie, T., & Tibshirani, R. (2021). An introduction to statistical learning: With applications in Python (2nd ed.). Springer.
Nofal, S. (2024). Identifying highly-valued
Yan, X., Li, Y., Nie, F., & Li, R. (2025). Bank customer segmentation and marketing strategies based on improved DBSCAN algorithm. Applied Sciences, 15(6), 3138.
Article originating from the Course Conclusion Work of the Specialization in Data Science and Analytics of the MBA USP/Esalq
To learn more about the course, click here and access the MBX Academy platform