
October 22, 2026
Statistical Regression in Microgrids for Operational Performance Estimation: Campusgrid Case
Kevin Dessanai; Luiz Henrique Lino de Oliveira
DOI: 10.22167/2675-6528-202603756
Article derived from a Term Paper (TCC), with content based on the student’s original work and adapted to the editorial format of the E&S Magazine with the support of the ResumeAI tool, an artificial intelligence solution developed by the Pecege Institute for textual synthesis and organization.
Summary
A multiple statistical regression model was proposed to estimate the operational performance of UNICAMP’s CampusGrid microgrid, based on internal electrical quantities. The microgrid integrates photovoltaic generation, batteries, and a gas generator. Energy management system data were collected at five-minute intervals over one month. The Operational Reliability Index, defined as the ratio between supplied and demanded energy, was established as the dependent variable. The model was adjusted for the islanded operation mode, evaluating the impact of demand, state of charge, solar generation, and supplied energy. The results revealed high explanatory power, indicating that operational reliability depends on the interaction between supply and demand. It was observed that the nighttime period concentrated the highest rate of partial supply, attributed to the reduction in solar generation. It was concluded that multiple regression offers an interpretable and useful framework for microgrid monitoring and support for control strategies.
Keywords: Battery storage; Photovoltaic generation; Reliability Index; Islanded operation; Energy Management System.
1. Introduction
The evolution of electric power systems, historically composed of generation, transmission, distribution, control, and electricity consumption stages, has been associated with the expansion of large centralized plants and extensive grids. This model was essential for the universalization of electricity access (Kagan et al., 2005; Grigsby, 2012), but it began to show limitations due to the need for greater reliability, flexibility, sustainability, and integration of distributed renewable sources, which are intermittent in nature (Lasseter, 2007).
In this context, the concept of microgrid has gained relevance as an alternative for controlling energy resources in a coordinated and dispatchable manner. The conception of microgrid was driven by the “CERTS Microgrid” concept in the early 2000s, which proposed treating distributed generation, loads, and control devices as an electrical subsystem capable of operating connected to the main grid or autonomously (Lasseter et al., 2002). According to the U.S. Department of Energy (2024), a microgrid is defined as a set of loads and distributed energy resources inserted within clearly defined electrical boundaries, capable of acting as a single controllable entity in relation to the main grid.
Microgrids thus emerge as a response to the need for more resilient, decentralized electrical systems capable of integrating different energy sources. Their use allows for the combination of renewable generation, dispatchable fossil generators, energy storage systems, demand-response loads, and smart meters (Liu et al., 2023). Among their main benefits are improved supply reliability, increased resilience to main grid failures, the possibility of islanded operation, integration of renewable sources, and greater efficiency in local energy management (Feng et al., 2018). However, the implementation of microgrids also presents significant challenges, such as the high initial investment cost, the need for communication, protection, and control infrastructure, as well as the requirement for operational strategies to deal with uncertainties in renewable generation and demand (Eyimaya, 2024).
The presence of battery storage systems enhances the operational flexibility of microgrids, but introduces challenges related to state of charge, charge cycles, and degradation (Shamarova et al., 2022). In this scenario, the energy management system (EMS) plays a central role, coordinating resource dispatch, balancing generation and demand, and preserving operational stability under different conditions, including the transition between grid-connected and islanded modes (Khan et al., 2024).
In the Brazilian context, CampusGrid, implemented on the campus of the State University of Campinas (UNICAMP), represents a relevant example of a microgrid focused on research, technological demonstration, and operational evaluation in a real environment. This infrastructure allows for the investigation of aspects related to the integration of renewable sources, energy storage, control strategies, and different operating modes, contributing to the advancement of applied studies on the subject in the country (UNICAMP, 2024).
The operational complexity of microgrids demands the development of methods to support performance analysis. Data-driven approaches, such as statistical models and machine learning techniques, are increasingly employed for forecasting, control, and identification of operational patterns (Porawagamage et al., 2024). However, while advanced techniques offer high predictive capacity, interpretable models are crucial in engineering applications, especially when the goal is not only to predict system behavior but to understand the relationships between operational variables and performance indicators.
In this context, regression models provide a transparent, useful, and computationally inexpensive framework for the analysis of microgrids (Javadi and Pong, 2025). The choice of this approach seeks to evaluate the extent to which internal microgrid variables can explain and estimate its operational behavior, contributing to the monitoring and improvement of operation strategies. Thus, this work proposes the use of a multiple statistical regression model to estimate the operational performance of UNICAMP’s CampusGrid microgrid, based on internal electrical quantities.
2. Material and Methods
The research methodology was structured in two complementary stages: I) acquisition, treatment, and organization of the microgrid’s operational data and II) statistical modeling, validation, and analysis of the obtained results. The study sought to evaluate how internal variables of the microgrid can explain and estimate its operational behavior, contributing to the monitoring and improvement of operation strategies.
In the first stage, documentary and technological research was carried out, with extraction of temporal data, event records, and operational logs from the CampusGrid energy management system. Internal electrical variables of the microgrid were collected and organized, including generation source power, load electrical demand, storage system state of charge, and other operational quantities. For this purpose, a continuous time window was defined to consider load variability, differences between weekdays and non-weekdays, distinct dispatch conditions, and eventual islanding or contingency occurrences.
The database was subjected to inclusion and exclusion criteria, with elimination of duplicate records, discarding of outliers, and standardization of days with gaps in critical variables. From the processed variables, the Operational Reliability Index [ICO] was constructed, used as the dependent variable of the statistical model. The ICO represents the microgrid’s ability to meet the required demand and was calculated by the ratio between the energy effectively supplied and the total energy demanded at the respective time instant, according to Equation (1):
ICO₁ = Met / Demanded (1)
Where ICO: is the operational reliability index at instant t; Eatendidať : is the energy effectively supplied by the microgrid; and Edemandadať : is the total energy required by the loads in the same period. The index assumes values between 0 and 1, indicating greater operational reliability the closer it is to 1.
In the second stage, statistical modeling of the treated data was performed using multiple regression. The model was structured to estimate the daily operational reliability index from the internal electrical variables of the microgrid, according to Equation (2):
ICO₁ = Bo + B₁X1,t + B2X2,t + … + BXn,t + Et (2)
Where ICOdt: is the dependent variable at instant t; X1,t, X2,t,…, Xn,t: are the explanatory variables of the microgrid’s internal measurements; β₀: is the intercept; β₁,β2,…,βn: are the estimated coefficients for each explanatory variable; and ɛt: is the error term.
The model validation included the analysis of residuals, verification of the statistical significance of the coefficients, and evaluation of performance metrics such as the coefficient of determination [R²], mean absolute error, and root mean squared error. Aspects such as multicollinearity between explanatory variables and adherence of residuals to model assumptions were also evaluated.
The statistical treatment was performed in the Python environment, using libraries such as Pandas, NumPy, and Scikit-learn, in addition to other libraries for statistical inference and pattern visualization. Model performance tables, coefficient estimates, confidence intervals, collinearity indicators, diagnostic tests, residual plots, and sensitivity analyses were generated.
The research exclusively used technical and de-identified data, without processing personal information, ensuring a transparent and replicable process.
Area of Study
CampusGrid, located on a university campus (coordinates -22.815762 and -47.072456), served as a platform for demonstration and technological development. The infrastructure integrates photovoltaic generation (565 kilowatts-peak [kWp]), battery storage (1.27 Megawatt-hours [MWh]), a natural gas generator (250 kilovolt-amperes [kVA]), low and medium voltage infrastructure, and an intelligent supervision and control system. This architecture is suitable for studies of grid-connected and islanded operation, energy dispatch, load management, and dynamic system behavior assessment.
Figure 1. Campusgrid Microgrid

Source: Original survey data
3. Results and Discussion
Statistical analysis
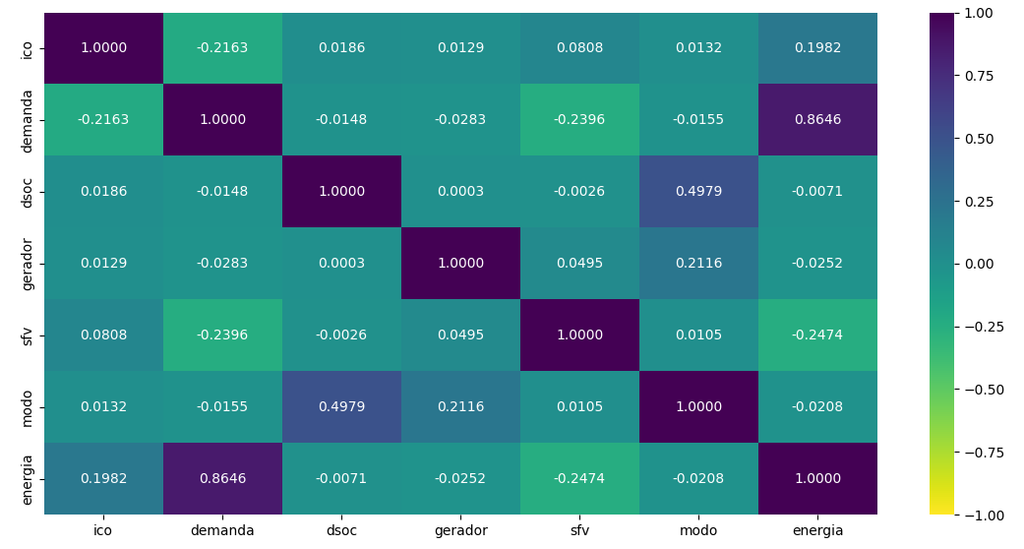
The operation of a microgrid, characterized by the interaction between intermittent renewable generation, storage, dispatchable generation, load profiles, and control strategies, presents technical complexity. An initial analysis evaluated data from the CampusGrid energy management system (EMS), covering both grid-connected and islanded modes. The data were standardized and organized into 5-minute intervals, spanning one month of uninterrupted operation. Figure 2 illustrates the correlation matrix between the variables recorded by the monitoring system.Figure 2. Correlation matrix of data obtained from the Campusgrid Microgrid
Source: Original research results
The initial correlation matrix indicated that the operational reliability index (ICO), considering both connected and disconnected modes, showed little to no correlation with most variables. This was mainly due to the main grid’s power supply, whose data was not monitored by the microgrid. In connected mode, without local generation, the ICO would always be 1, as the demand would be supplied by the main grid. It was observed that the delta variation of the energy storage system’s state of charge (dsoc) and the natural gas generator set (generator) showed a slight to moderate correlation with the operating mode, as they act as backup during power outages. The photovoltaic system (sfv) did not show significant correlations, while the energy delivered locally by the microgrid correlated mainly with demand.
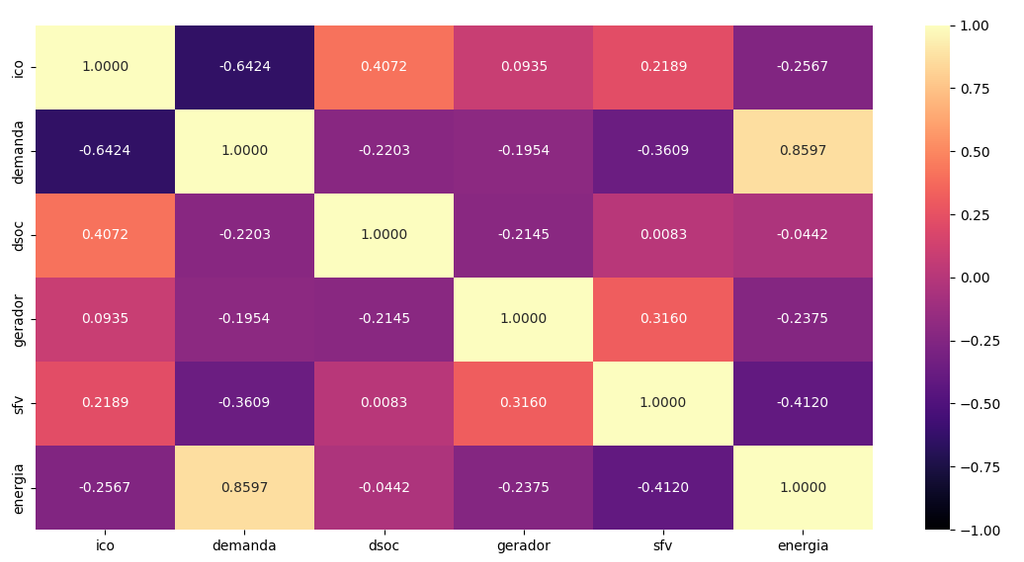
For a more precise analysis of the ICO, the data were debugged to include only the instants when the microgrid operated in islanded mode, eliminating the interference of the main grid. Of the total 8640 observations, 195 referred to islanded mode, which, although reduced, allowed for a more realistic assessment of the local load-carrying capacity. Figure 3 presents the correlation matrix for the system operating exclusively in islanded mode.Figure 3. Correlation matrix of the Campusgrid Microgrid data for islanded mode
Source: Original research results
In islanded operation mode, the ICO showed a more pronounced positive relationship with battery operation and the photovoltaic system, indicating that higher battery charge states and greater photovoltaic generation are associated with higher ICO values. The sfv also showed slight interdependence with the gas generator. Regarding demand, the correlation was moderate to strong and negative, suggesting that the ICO tends to decrease with increasing demand. Based on this data, it was possible to obtain equation (4) which describes the system’s behavior:
ICO = 0.899025 – 0.129712demand + 0.000546dsoc + 0.001845generated + 0.011725sfv + 0.150857energy (4)
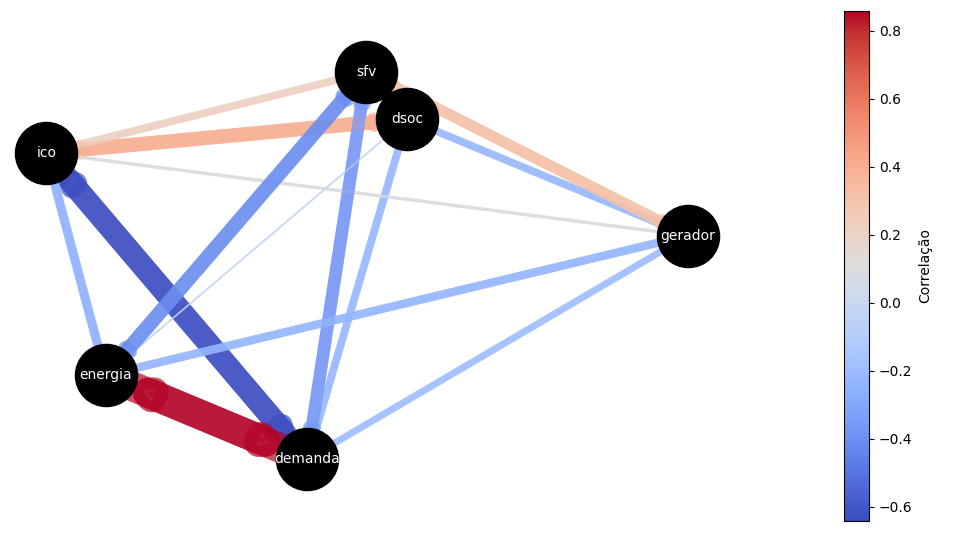
The regression analysis, according to Table 1, revealed that the generator does not have relevant statistical significance as an explanatory variable for ICO, with a p-value of approximately 0.152. Figure 4 illustrates this behavior in graph form, where the bluer and redder lines indicate weaker and stronger correlation levels, respectively. Table 1. Table with individual variable results
| Variables | Coefficient | Error | t | P > | t | | [ 0.025 | 0.975 ] |
|---|---|---|---|---|---|---|
| Intercept | 0.899025 | 0.015 | 58.838 | 0.000 | 0.874 | 0.934 |
| demand | -0.129712 | 0.06 | -21.082 | 0.000 | -0.143 | -0.0118 |
| dsoc | 0.000546 | 0.000 | 3.193 | 0.002 | 0.000 | 0.001 |
| generator | 0.001845 | 0.00128 | 1.438 | 0.152 | -0.000685 | 0.004374 |
| sfv | 0.011725 | 0.004 | 3.297 | 0.001 | 0.005 | 0.021 |
| energy | 0.150857 | 0.010 | 15.427 | 0.000 | 0.131 | 0.170 |
Source: Original research resultsFigure 4. Correlation graphs of the Campusgrid Microgrid data for the islanded mode
Source: Original research results
The generator coefficient interval, as per Figure 4, crosses zero, suggesting that statistically it is plausible that its real effect is null, slightly negative or positive. Thus, the model cannot confidently assert a proper effect of the generator’s explanatory variable, which can be excluded from the main equation, resulting in equation (5):
ICO = 0.899025 – 0.129712demand + 0.000546dsoc + 0.011725sfv + 0.150857energy (5)
The summary of the Ordinary Least Squares (OLS) adjustment, presented in Table 2, demonstrated satisfactory statistical performance. The coefficient of determination R² indicated that approximately 77.2% of the observed variability in ICO is explained by the independent variables, suggesting high explanatory power. The adjusted R² of 0.767 confirmed that the model maintains explanatory capacity, even after penalization for the number of predictors, indicating that the inserted variables contribute relevantly to the explanation of ICO.Table 2. Table with the OLS results of the model
| Variables | Coefficient |
|---|---|
| R2 | 0,772 |
| Adjusted R² | 0,767 |
| Statistics-F | 161,0 |
| Probability (Statistics-F) | 6.86 x 10-60 |
| Log-likelihood | 178,53 |
| AIC | – 347,1 |
| BIC | – 330,7 |
| MAE | 0,0607 |
| RMSE | 0,1032 |
Source: Original research results
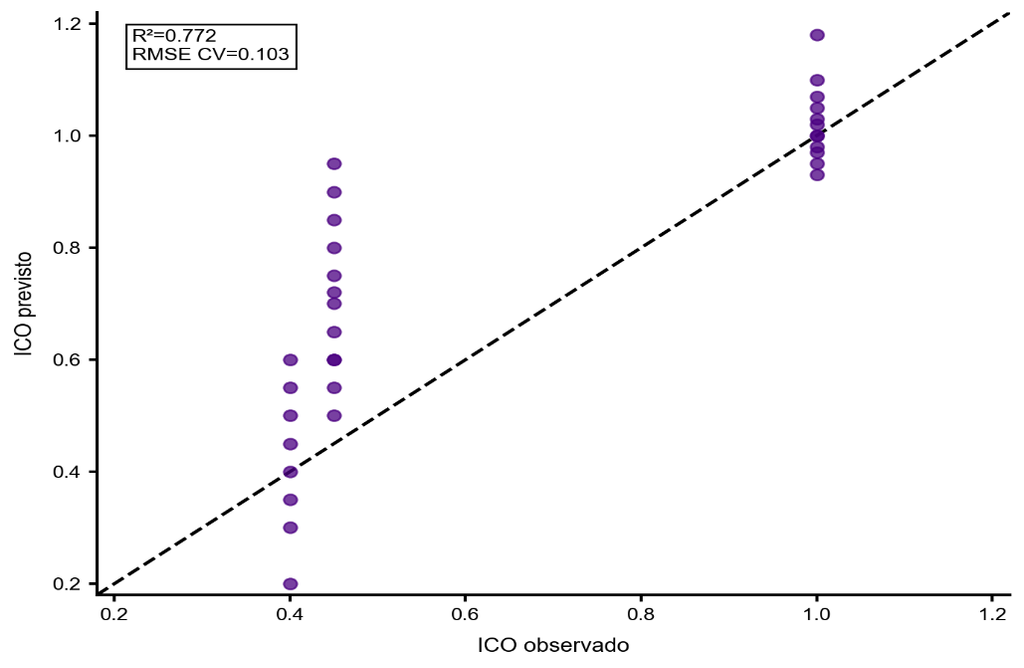
The value of the F statistic of 161.0, associated with a p-value of 6.86 × 10⁻⁶⁰, allowed rejecting the null hypothesis that all angular coefficients are simultaneously equal to zero. This means that the set of explanatory variables has statistically significant capacity to explain the behavior of the dependent variable. The model was adjusted with the 195 observations from the original database, resulting in 190 residual degrees of freedom and 4 degrees of freedom for the model, indicating four explanatory predictors. The mean absolute error (MAE) of 0.0607 and the root mean squared error (RMSE) of 0.1032 indicated that the model reproduces with good approximation the observed operational reliability level, although the dispersion increases in partial service events. Figure 5 illustrates the relationship between the observed and predicted confidence index.Figure 5. Observed confidence index x Predicted confidence index
Source: Original research results
Figure 5 shows a strong concentration of points close to the unit value of the index, with greater dispersion for lower values, indicating that episodes of partial service are more difficult to capture with perfect accuracy. However, the visual proximity of the points to the reference line suggests that the multiple linear model maintains a useful explanatory capacity for operational analysis and monitoring. Operational reliability is predominantly influenced by the relationship between the required load and the energy effectively supplied, while photovoltaic generation and the state of the storage system act as support, rather than as isolated main determinants. Demand and energy share a significant portion of the explanatory information, which is expected from a physical standpoint, given the direct relationship with load fulfillment.
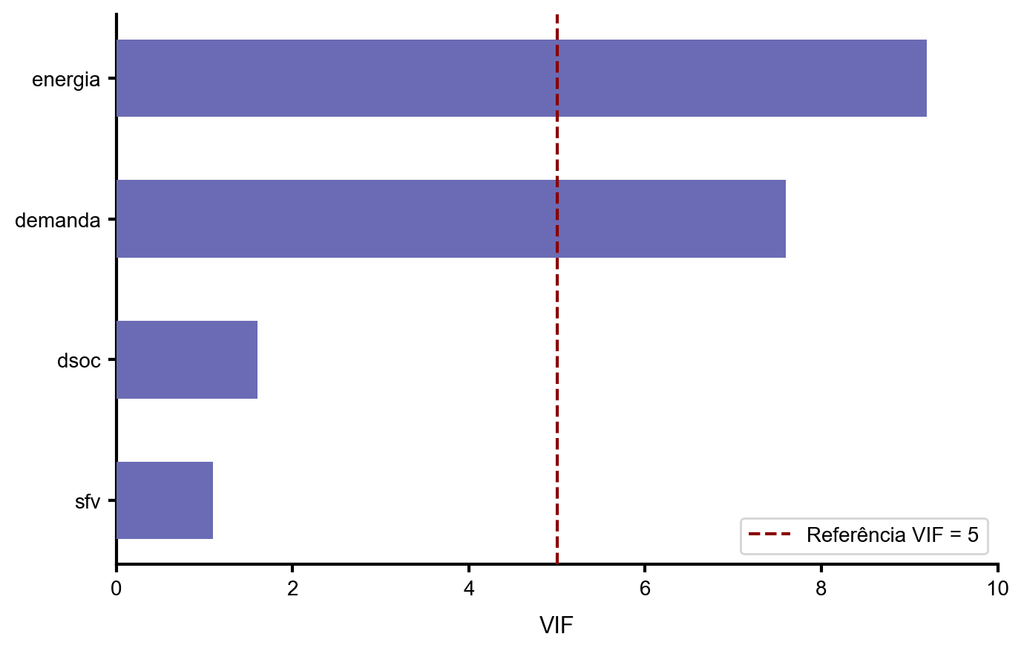
The multicollinearity analysis, presented in Figure 6 and Table 3, indicated variance inflation factors (VIF) of 8.973 for energy and 7.722 for demand, while dsoc and sfv remained at low levels, with 1.689 and 1.177, respectively. Despite moderate to high multicollinearity between demand and energy, the coefficients maintained consistent signs and high statistical significance, justifying the inclusion of these variables in the model from an interpretive standpoint. This result suggests that the behavior of the confidence index emerges from a close interaction between the need for supply and the effective capacity for local service, reinforcing the physical meaning of the estimated regression.Figure 6. Variance inflation factor (VIF) of the reduced model variables
Source: Original research resultsTable 3. VIF values for the explanatory variables
| Variables | Value |
|---|---|
| energy | 8,973 |
| demand | 7,722 |
| dsoc | 1,689 |
| sfv | 1,177 |
Source: Original research results
To diagnose heteroscedasticity, the Breusch-Pagan test was performed. The test returned an LM value of 21.183 with a p-value of 0.000748, and an F value of 4.607 with a p-value of 0.000546. Thus, the null hypothesis of homoscedasticity was rejected at the 5% level, indicating that the model’s residuals exhibit non-constant variance, as detailed in Table 4.Table 4. Values for the Breusch-Pagan test
| Variables | Value |
|---|---|
| LM | 21,183 |
| LM p-value | 0,000748 |
| F Statistic | 4,606626 |
| F p-value | 0,000546 |
Source: Original research results
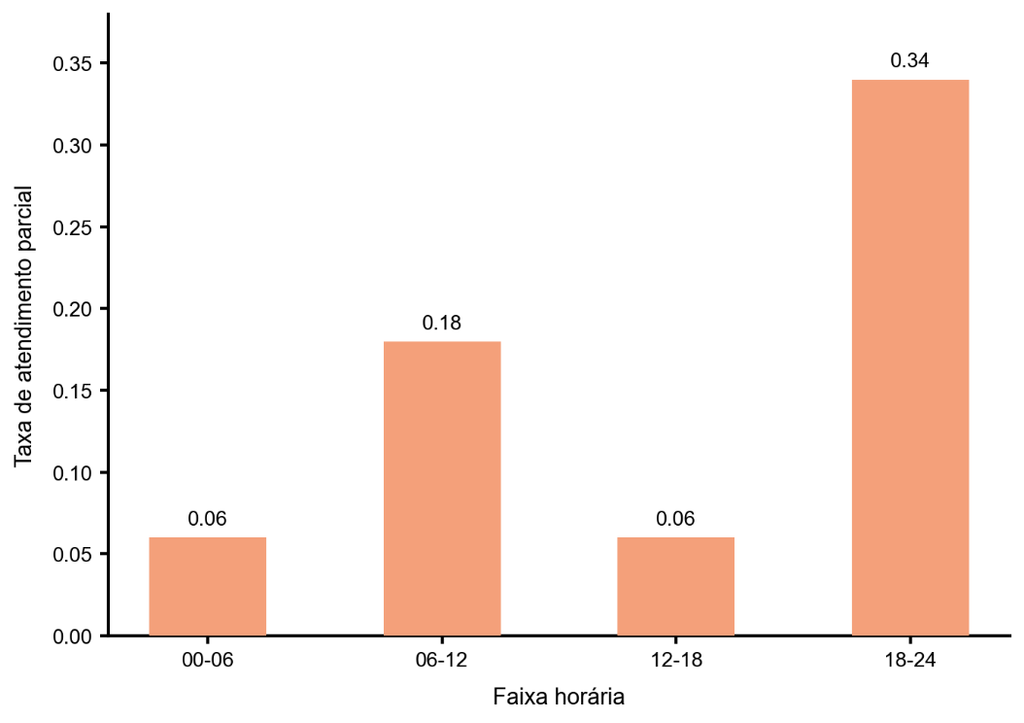
When grouping observations by time slot, it was found that the period from 6:00 PM to 12:00 AM concentrated the largest share of events with ICO less than 1. In this range, the partial service rate was 0.3409, more than double the rate for the 6:00 AM to 12:00 PM slot and more than five times higher than the intervals from 12:00 AM to 6:00 AM and from 12:00 PM to 6:00 PM, both with 0.0638. During this nighttime period, the lowest average ICO (ICOm) and the highest average supply gap (GAPm) were observed, as shown in Table 5 and Figure 7. This result is consistent with the microgrid’s operating logic, as in the late afternoon, photovoltaic contribution decreases or ceases, while demand remains high, especially for post-work loads or at the beginning of the peak period. Under these conditions, the system relies more on stored energy and the coordination of available resources. Table 5. ICO results by time slot
| Schedule | Observations | ICO <1 | Rate | ICOm | GAPm |
|---|---|---|---|---|---|
| 00:00-06:00 | 47 | 3 | 0,0638 | 0,9643 | 0,2178 |
| 06:00-12:00 | 57 | 10 | 0,1754 | 0,9020 | 0,3187 |
| 12:00-18:00 | 47 | 3 | 0,0638 | 0,9651 | 0,1915 |
| 18:00-00:00 | 44 | 15 | 0,3409 | 0,8115 | 1,3594 |
Source: Original research resultsFigure 7. Frequency of ICO < 1 by time slot
Source: Original research results
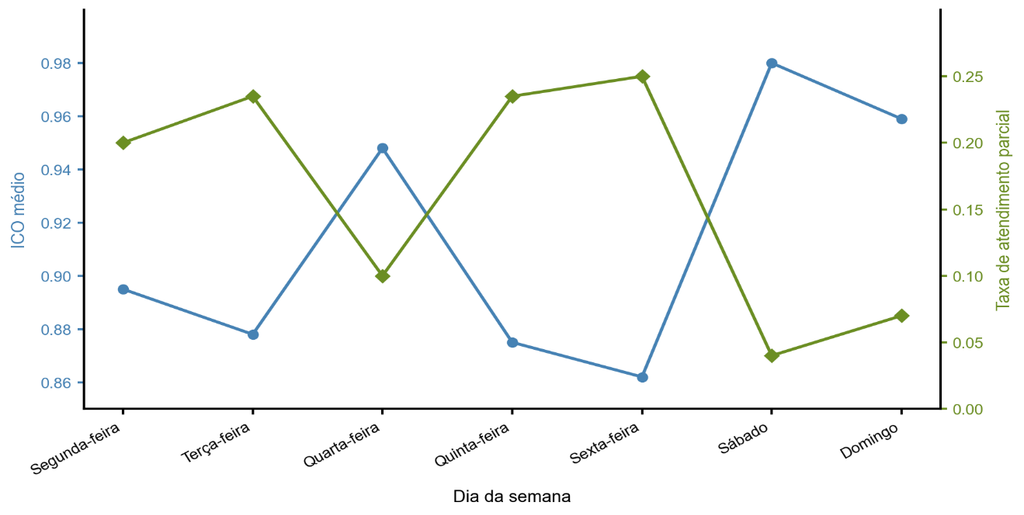
The weekly analysis, presented in Figure 8, reinforced this behavior. On weekdays, the lowest average reliability levels were observed on Friday and Thursday, while Saturday showed the best performance and the lowest partial attendance rate. Sunday also showed superior performance to weekdays. This pattern indicates that the microgrid responds not only to intraday variability but also to changes in consumption profile throughout the week, which is compatible with the operation of a university campus, where the intensity of infrastructure use tends to drop on weekends. Figure 8. Frequency of ICO < 1 by day of the week
Source: Original research results
Exploratory observation by time slot indicated that events with ICO less than 1 were mainly concentrated between 6 PM and 12 AM, suggesting the influence of the temporal regime on operational reliability. Based on this finding, dummy time slot variables were introduced into the regression model to verify the statistical relevance of the time of day after controlling for electrical variables. Four categories were considered (early morning, morning, afternoon, and night), with an n-1 dummies procedure, and the results are in Table 6.Table 6. Table with the coefficients of the model adapted with dummies
| Variables | Coefficient | Error | t | P > | t | | [ 0.025 | 0.975] |
|---|---|---|---|---|---|---|
| Intercept | 0,916820 | 0,0163 | 56,376 | 0,000 | 0,8847 | 0,948900 |
| demand | -0,128049 | 0,0605 | -21,16 | 0,0014 | -0,1399 | -0,116114 |
| dsoc | 0,000590 | 0,00016 | 3,812 | 0,000 | 0,00028 | 0,000895 |
| generator | 0,002826 | 0,00129 | 2,195 | 0,0294 | -0,00028 | 0,005365 |
| sfv | 0,012682 | 0,00404 | 3,144 | 0,0019 | 0,00473 | 0,020655 |
| energy | 0,144647 | 0,0097 | 14,92 | 0,000 | 0,12553 | 0,163764 |
| morning | -0,053940 | 0,016581 | -3,253118 | 0,001353 | -0,086648 | -0,021231 |
Source: Original research results
After the stepwise procedure, only the dummy corresponding to the morning period remained statistically significant (β = -0.053940; p = 0.001353). The adapted model presented an adjusted R² of 0.7799, higher than the purely quantitative model. However, the Breusch-Pagan test remained significant, indicating the persistence of heteroscedasticity, as per Table 7.Table 7. Values for the Breusch-Pagan test for the model with dummies
| Variables | Coefficient |
|---|---|
| R² | 0,786 |
| Adjusted R² | 0,779 |
| AIC | – 355,9 |
| BIC | – 332,9 |
| LM | 29,70 |
| LM p-value | 0,000045 |
Source: Original research results
The study demonstrated the feasibility of applying multiple statistical regression models to estimate the operational performance of microgrids, using UNICAMP’s CampusGrid as a case study. The construction of the Operational Reliability Index allowed for the quantification of the system’s capacity to meet demand, especially in islanded mode. The results indicated that demand and effectively delivered energy are the main determinants of system performance, with photovoltaic generation and storage acting as support. The developed statistical model presented high explanatory power, confirming that internal electrical variables are sufficient to provide a consistent estimate of the microgrid’s behavior. The temporal analysis revealed important operational patterns, such as the greater susceptibility to supply deficits during the night, when solar generation ceases and demand remains high. The incorporation of categorical time-band variables improved the model, reinforcing the influence of the consumption profile throughout the day, and the better performance observed on weekends corroborates the model’s adequacy to the dynamics of a university campus.
4. Conclusion
This study proposed the use of a multiple statistical regression model to estimate the operational performance of UNICAMP’s CampusGrid microgrid, focusing on islanded mode operation based on internal electrical quantities. It was found that the developed model presented high explanatory power, with an adjusted R² of 0.767, indicating that approximately 77.2% of the variability in the Operational Reliability Index (ICO) was explained by the independent variables. The results showed that demand and effectively delivered energy were the main determinants of the system’s performance, while photovoltaic generation and the storage system’s state of charge acted as essential supporting elements for maintaining supply. The analysis demonstrated that internal electrical variables, monitored by the energy management system, are sufficient to provide a consistent estimate of the microgrid’s behavior, offering an interpretable and useful framework for monitoring and supporting control strategies.
The temporal analysis revealed important operational patterns, such as increased susceptibility to supply deficits during the night, specifically between eighteen and twenty-four hours, when solar generation ceases and demand remains high. Better performance was also observed on weekends, which corroborates the model’s suitability for the dynamics of a university campus. Despite the inherent limitations of the data-driven approach, such as dependence on the quality of historical records and the persistence of heteroscedasticity in the residuals, the Ordinary Least Squares (OLS) model proved to be a transparent and computationally inexpensive analytical tool. The interpretability of the coefficients allows operators and researchers to understand the relationships between system variables. For future studies, it is suggested to incorporate explicit meteorological variables, explore non-linear regression or time series techniques to handle heteroscedasticity, and apply the model to different microgrid architectures to validate its generalization.
Bibliographic References
DOE – U.S. Department of Energy. The U.S. Department of Energy’s Microgrid Initiative. [S.I.]: U.S. Department of Energy, 2016. Disponível em: . Acesso em: 07 mar. 2026.
Eyimaya, S. E.; Altin, N. Review of Energy Management Systems in Microgrids. Applied Sciences, v. 14, n. 3, art. 1249, 2024. Disponível em: . Acesso em: 01 abr. 2026.
Feng, W. et al. A review of microgrid development in the United States. Applied Energy, 2018.
Grigsby, L. L. Electric Power Generation, Transmission, and Distribution. 3. ed. Boca Raton: CRC Press, 2012.
Javadi, A. B.; Pong, P. A review on symbolic regression in power systems: Methods, applications, and future directions. Renewable and Sustainable Energy Reviews, v. 224, art. 116075, 2025. Disponível em: . Acesso em: 07 fev. 2026.
Kagan, N.; Oliveira, C. C. B.; Robba, E. J. Introdução aos sistemas de distribuição de energia elétrica. São Paulo: Blucher, 2005.
Khan, M. R. et al. A Comprehensive Review of Microgrid Energy Management Systems. Processes, v. 12, n. 2, 2024.
Lasseter, R. H. Microgrids and Distributed Generation. Journal of Energy Engineering, v. 133, n. 3, p. 144-149, 2007.
Liu, X. et al. Microgrid Energy Management with Energy Storage Systems. 2023.
Porawagamage, G. et al. A review of machine learning applications in power system protection and control. Frontiers in Smart Grids, 2024.
Shamarova, N. et al. Review of Battery Energy Storage Systems Modeling in Microgrids with Renewables Considering Battery Degradation. Energies, 2022.
UNICAMP – State University of Campinas. Unicamp and CPFL inaugurate energy microgrid on the Barão Geraldo campus. Campinas: UNICAMP, Nov. 22, 2024. Available at: . Accessed on: Apr. 07, 2026.
Article originating from the Final Course Work of the Specialization in Data Science and Analytics of the MBA USP/Esalq
To learn more about the course, click here and access the MBX Academy platform