
July 08, 2026
Socioeconomic Factors of Urban Lethal Violence: a Multilevel and Machine Learning Analysis in Brazilian Municipalities
Lucas Valoz Castellucci; Édipo Menezes da Silva
DOI: 10.22167/2675-6528-202600003
Article developed by the ResumeAI tool, an artificial intelligence solution developed by the Pecege Institute focused on synthesis and writing.
Summary
Urban lethal violence in Brazil represents a persistent social challenge, with high homicide rates and the need to understand its socioeconomic roots. This study analyzed 282 Brazilian municipalities to identify the contribution of socioeconomic indicators in explaining the rates of intentional violent deaths in 2010. To mitigate multicollinearity, Principal Component Analysis (PCA) was employed, which condensed 18 variables into five complex indicators: Poverty and Inequality, Education, Employment, Infrastructure, and Population. Subsequently, five statistical and machine learning models were applied, among which Multilevel Regression and Random Forest stood out. The multilevel model achieved a relevant explanatory power (R² ≈ 0.617), indicating that Population and Employment presented the largest coefficients, followed by Education and Infrastructure. It was observed that population density and unemployment were positively associated with an increase in lethal violence, while education exerted a reducing effect. Random Forest achieved a better fit (R² ≈ 0.683), with more balanced importances among the factors and accuracy in future predictions. The comparison between the models revealed that, while Multilevel Regression highlighted linear relationships, Random Forest captured complex and lasting nonlinear interactions, underscoring the need for integrated public policies that address employment, urbanization, and inequality.
Keywords: Principal Component Analysis; Random Forests; Socioeconomic Indicators; Public Policies; Multilevel Regression.
1. Introduction
Violence and crime represent persistent challenges in urban societies, and Brazil is no exception. Despite recent decreases in some indicators, the numbers of lethal violence remain alarming. According to the Brazilian Public Security Forum (FBSP, 2024), the country registered 46,328 Intentional Violent Deaths (MVI) in 2023, equivalent to 22.8 deaths per 100,000 inhabitants, almost four times the world average of 5.8 homicides per 100,000 inhabitants. The 2024 Atlas of Violence (IPEA; FBSP, 2024) suggests that these data may be underestimated due to the high number of deaths classified as “undetermined cause” (Cerqueira and Bueno, 2024). Police lethality also intensified, with 6,393 deaths resulting from police interventions in 2023, resulting in a rate of 3.1 deaths per 100,000 inhabitants, indicating an escalation of police violence in the last decade (FBSP, 2024).
Historically, attempts to explain violence and social deviance were marked by unscientific, often prejudiced and pseudoscientific approaches. In the 19th century, criminology, for example, attributed criminality to innate or racial characteristics (Lombroso, 1876; Rodrigues, 2011). However, from the second half of the 20th century onwards, social theories promoted a paradigm shift. Violence and criminality began to be understood as a product of environmental and socioeconomic factors. In this context, the use of social indicators became fundamental to operationalize abstract concepts, such as violence, poverty, and inequality, providing the basis for the formulation and evaluation of public policies (Januzzi, 2001).
In this scenario of seeking robust explanations, pioneering studies emerged that investigated the relationship between lethal violence and socioeconomic factors. Works such as Shaw and Mckay (1969) in the United States and the discussion by Cano and Santos (2001) on lethal violence, income, and social inequality in Brazil were important milestones. These studies, however, faced limitations related to the quality of records and the computational capacity of the time. In contrast, the current context, characterized by the vast availability of data and high computational processing power, offers a unique opportunity to deepen these theories through machine learning models. It is crucial, however, to consider the ethical dimensions of using machine learning and artificial intelligence algorithms in the predictive analysis of criminality, in order to avoid reinforcing inequalities (O’Neil, 2016; Ludwig and Mullainathan, 2021; Silva, 2022; Coelho, 2024). The theoretical foundation of sociology is essential for critical analysis and for the proposition of explanatory variables, especially socioeconomic ones, as predictors of lethal violence.
Empirical literature already presents studies that explore the relationship between crime, socioeconomic indicators, and machine learning. In the United States, Goin et al. (2018) developed a model that identified predictors of gun violence in urban communities in California. In Brazil, Alves et al. (2018) proposed a model to predict crimes based on urban indicators, pointing to factors such as unemployment, illiteracy, and the male population as relevant for homicide prediction. More aligned with the present research, the work of Ribeiro and Cano (2016) on lethal violence and inequality in Brazilian municipalities demonstrated the income of the poorest as one of the main explanatory factors. These studies serve as precedents for the application of statistics and machine learning in the field of violence and crime, while sociological theories provide hypotheses about which indicators, such as education, unemployment, and inequality, may be most associated with violence rates.
Based on these considerations and the need to deepen the understanding of the complex factors driving lethal urban violence in Brazil, this research is justified by its potential contribution to the formulation of more effective public policies. The gap lies in the need for models that capture the linear and non-linear interactions between multiple socioeconomic factors and violence. Thus, this study proposes to investigate the relationships between lethal violence and socioeconomic indicators in Brazilian municipalities through an approach that combines machine learning and multilevel regression, aiming to identify the main explanatory factors of lethal violence in urban municipalities.
2. Material and Methods
This research was characterized as a cross-sectional observational study, quantitative in nature, according to the classification by Kellstedt and Whitten (2018). The central objective was to investigate the relationships between lethal violence and socioeconomic indicators in Brazilian municipalities, using an approach that combined machine learning and multilevel regression. The data used were secondary, from public agencies and institutes, aggregated and made available by the Institute of Applied Economic Research (IPEA). The selection of social indicators, defined by Januzzi (2001), was based on existing literature and availability at the municipal level, with all socioeconomic data referenced to the year 2010.
The study’s dependent variable was the Violent Death Rate per 100,000 inhabitants (“TAXA_VIOLENCIA”), calculated by IPEA from the sum of Lethal and Intentional Violent Crimes (CVLI) and Deaths by State Agent Intervention (MIAE), standardized as MVI, with primary source in the DATASUS system. The unit of analysis consisted of Brazilian municipalities. Initially, a database with 5565 municipalities and 19 variables was built. To ensure standardization and mitigate underreporting, the base was restricted to municipalities with a population greater than 100,000 inhabitants. After removing cities without violence data, the final sample comprised 282 municipalities.
The presence of multicollinearity among the socioeconomic predictor variables was diagnosed through the Pearson correlation coefficient and the Variance Inflation Factor (VIF), according to James et al. (2023). To mitigate this problem, Principal Component Analysis (PCA) was employed, a dimensionality reduction technique that transformed the 18 original variables into five complex and orthogonal indicators. These thematic factors were: Population, Education, Infrastructure, Poverty and Inequality, and Employment. The interpretation of these factors, which functioned as synthetic indicators according to Januzzi (2002), was based on the factor loadings. After the transformation, the VIF diagnosis for the new factors confirmed values below five, ensuring the assumption of predictor independence.
To answer the research question, five supervised models were tested: Multiple Linear Regression (MLR), MLR with Logarithmic Transformation (Log-MLR), MLR with Box-Cox transformations (MLR-BC), Multilevel MLR with Box-Cox transformations (MLR-BC) and Random Forest Regressor (RFR). The parametric models were implemented using Python’s `statsmodels` library, while the RFR was developed with the `RandomForestRegressor` class from the `scikit-learn` library. The assumptions of normality of residuals were diagnosed by the Shapiro-Francia and Shapiro-Wilk tests, and the constant variance of residuals by the Breusch-Pagan test, both implemented via `statsmodels` or `scipy`.
The hyperparameter optimization for RFR was performed using the `RandomizedSearchCV` class from the `scikit-learn` library, which employed cross-validation and exhaustive search. The choice of the RLMM-BC model was justified by the hierarchical structure of violence data, nested within Federative Units and Regions of the country, as per Goldstein (2011). To address the dependency between observations, Restricted Maximum Likelihood (REML) was used. The Random Forest Regressor, being non-parametric, was based on constructing multiple decision trees from distinct samples, combined for a final prediction (Géron, 2023; Mandalapu et al., 2023), allowing for the capture of non-linear relationships. Model performance comparison was conducted using the coefficient of determination (R²), Mean Squared Error (MSE), and Root Mean Squared Error (RMSE).
The exploratory analysis of the municipal rate of intentional violent deaths, standardized per 100,000 inhabitants, revealed considerable dispersion across the 282 municipalities studied. The data indicated an average of 31.60 deaths per 100,000 inhabitants, exceeding the median of 25.30 by 6.3 points, which suggests a positive skew in the distribution. This skew is reinforced by the range of values, which varied from a minimum of zero to a maximum of 113.67 deaths per 100,000 inhabitants, a rate considered extremely high by the World Health Organization (WHO) for any value equal to or greater than ten.
The distribution of lethal violence rates in the studied municipalities, as visualized, shows that the majority of municipalities are concentrated in lower rates, but there is a long tail of municipalities with high rates, contributing to the higher average. The standard deviation of 22.59 highlights the heterogeneity of violence among cities, indicating that the problem does not manifest uniformly across the territory. This initial variability already points to the complexity of the phenomenon and the need to investigate explanatory factors that can account for these disparities. An example of a regression tree brought by Géron (2023, p. 279) can be visualized in Figure 1.
Figure 1. Operation of a Regression Tree
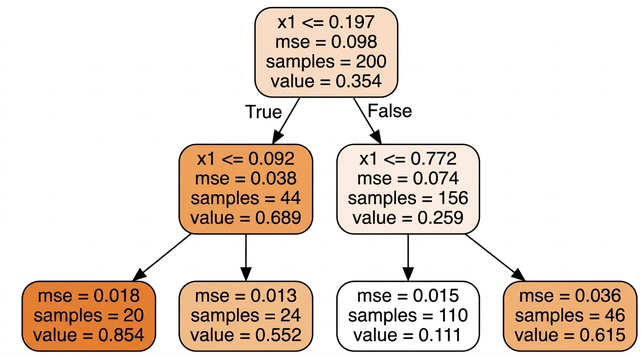
Source: Géron (2023, p. 279)
3. Results and Discussion
When examining the temporal evolution of the lethal violence rate between 2010 and 2021, an initial upward trend was observed, peaking in 2017 when the mean reached 33.83 and the median 27.66. During this period, dispersion was also at its maximum, with a standard deviation of 25.02 and an extreme value of 137.20, indicating a scenario of high and unequal violence. However, from 2018 onwards, there was a structural break, with a sharp decline that led violence to its historical minimum in 2020, the year of the COVID-19 pandemic, with the median falling to 9.70 and the mean to 18.05.
The recovery of violence in 2021, with the median almost doubling to 18.51 and the mean rising to 23.03, was accompanied by a reduction in dispersion, with the standard deviation falling to 17.18. This pattern suggests that the resumption of violence in 2021 was more homogeneous and widespread, affecting a broader set of municipalities similarly. The persistence of the mean above the median throughout the entire time series confirms a positive skew in the distribution, indicating the continued presence of municipalities with extreme violence rates that elevate the overall average.
Figure 2. Distribution of lethal violence rates in the studied municipalities
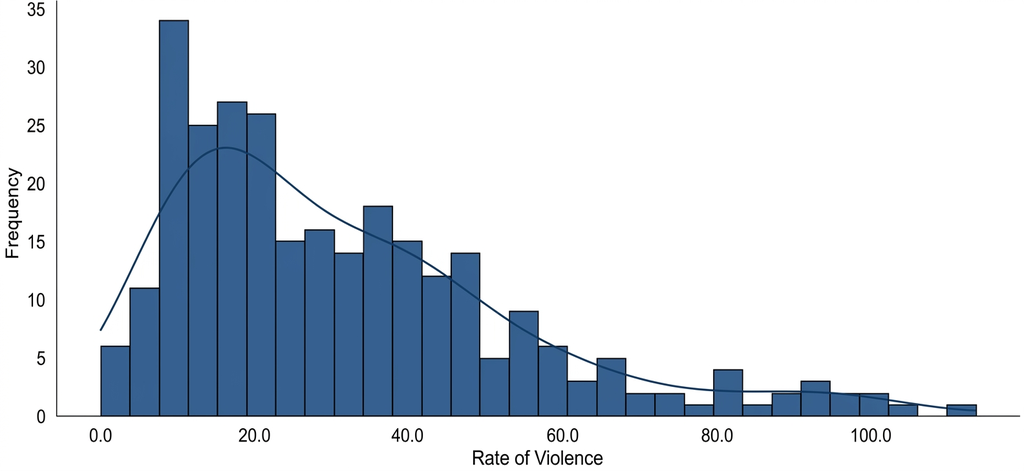
Source: Original research results
The aggregation of the rate of Intentional Violent Deaths (IVD) by major Region of Brazil in 2010 revealed a profound territorial inequality. The North and Northeast regions stood out as the epicenters of lethal violence, with the Northeast presenting the highest median, slightly above 40 deaths per 100,000 inhabitants. This region also exhibited a vast dispersion, indicating the presence of municipalities with moderate violence and others with the highest rates in the country.
In contrast, the Southeast region presented the lowest median and a more compact distribution, followed by the South region, suggesting a scenario of less intense and more homogeneous violence. The Center-West occupied an intermediate position, with the smallest “outliers”. This regional disparity underscores the need for differentiated approaches to public security policies, considering the socioeconomic and structural particularities of each geographical area, as visualized in the distribution.
Figure 3. Boxplot of the lethal violence rate 2010 to 2021
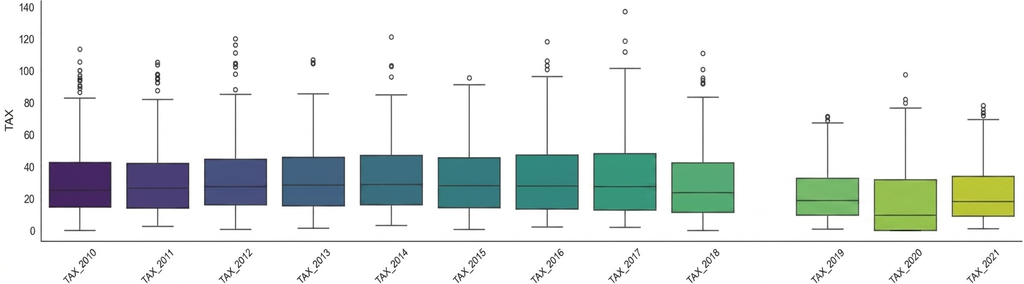
Source: Original research results
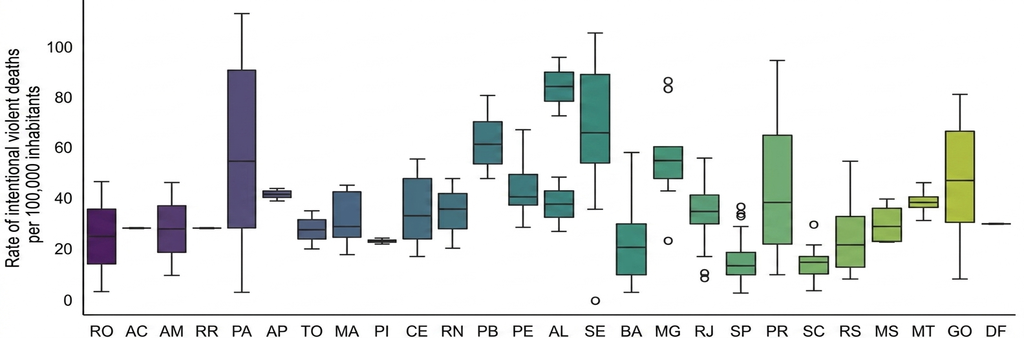
The disaggregation of the dependent variable by Federative Unit (UF) revealed an even deeper heterogeneity in lethal violence, being one of the most relevant findings of the exploratory analysis. States such as Alagoas, Bahia, Paraíba, and Pará presented the highest medians, with Pará exhibiting high intra-state variability, indicating a severe and unequal violence problem within the state itself. This situation contrasts sharply with states like Santa Catarina and São Paulo, which registered substantially lower medians and more compact distributions, suggesting a more homogeneous and less intense violence scenario.
Figure 4. Distribution of lethal violence rates of municipalities according to Region of Brazil
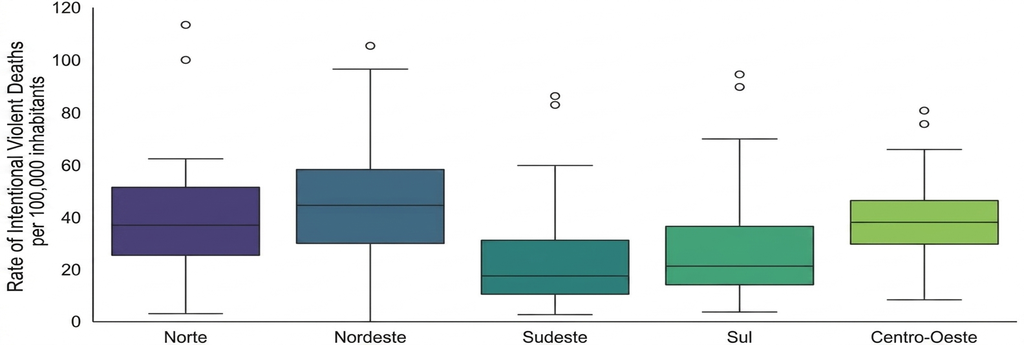
Source: Original research results
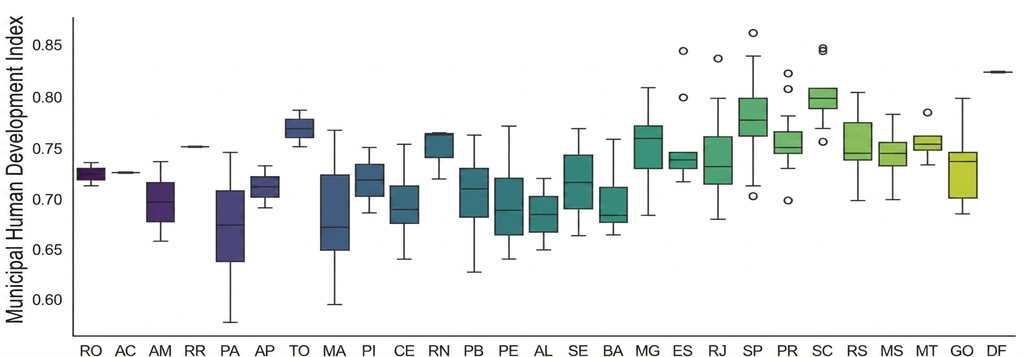
In the analysis of independent variables, the Municipal Human Development Index (IDHM) by UF presented a geographic pattern that is almost a mirror of the violence distribution, revealing an inverse visual correlation. States with the highest lethal violence rates, such as Alagoas, Pará, and Bahia, exhibited the lowest IDHM medians. On the other hand, states with better security scenarios, such as Santa Catarina and São Paulo, possessed the highest IDHM medians and distributions more concentrated at higher levels.
This finding provides strong exploratory evidence for the central research hypothesis, indicating a clear relationship between socioeconomic indicators and lethal violence. The inversion of geographical patterns between violence and IDHM suggests that human development, which encompasses income, education, and longevity, acts as a protective factor against lethal violence. Visualizing these relationships is crucial for understanding the complexity of the phenomenon and directing effective interventions.
Figure 5. Distribution of violence rates in municipalities by UF
Source: Original research results
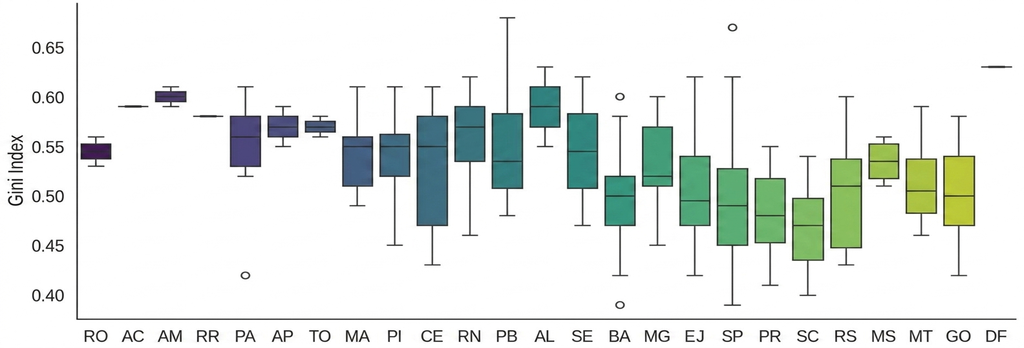
The analysis of the Gini Index by UF, which measures income inequality, also followed a well-defined geographic pattern, similar to previous indicators. States in the North and Northeast regions, along with the Federal District, tended to show the highest Gini indices, indicating a greater concentration of income. In contrast, states in the South region, particularly Santa Catarina, exhibited the lowest levels of inequality.
The overlap of this pattern with that of lethal violence suggests a potential positive correlation, raising the hypothesis that environments with greater inequality may be more prone to violence. This relationship is consistent with the literature that points to inequality as a risk factor for crime, reinforcing the importance of policies to reduce social disparities for violence prevention. The visualization of these data is fundamental to contextualize subsequent analyses.
Figure 6. Municipal Human Development Index in 2010
Source: Original research results
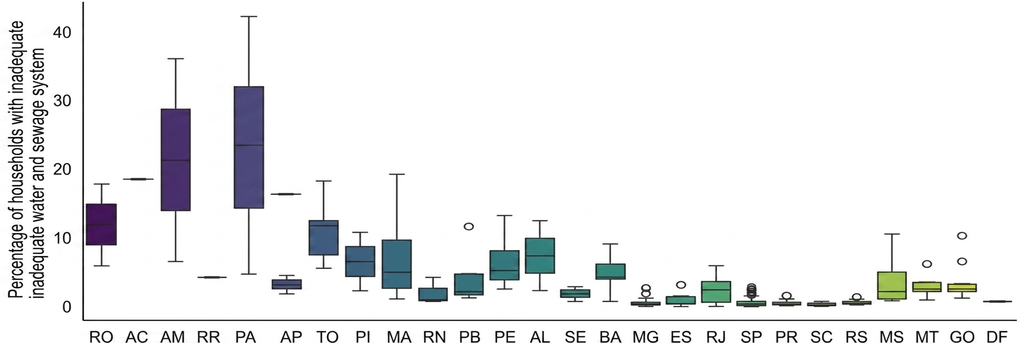
The infrastructure conditions, evaluated by the percentage of households with inadequate sanitation and water supply, served as an indicator of housing precariousness and absence of state services. The boxplot showed a strong regional contrast, with the North concentrating the largest deficits, while most municipalities in the Southeast and South registered inadequacy close to or below five percent. This geography of infrastructure deficit overlaps with that of lethal violence.
This correspondence suggests that the absence of the State in the provision of essential services and precarious living conditions favor the incidence of lethal violence. Inadequate infrastructure can be a reflection of public disinvestment and unfavorable socioeconomic conditions, which, in turn, create an environment conducive to crime. The visualization of these data reinforces the interconnection between different dimensions of social vulnerability and violence.
Figure 7. GINI Index in 2010
Source: Original research results
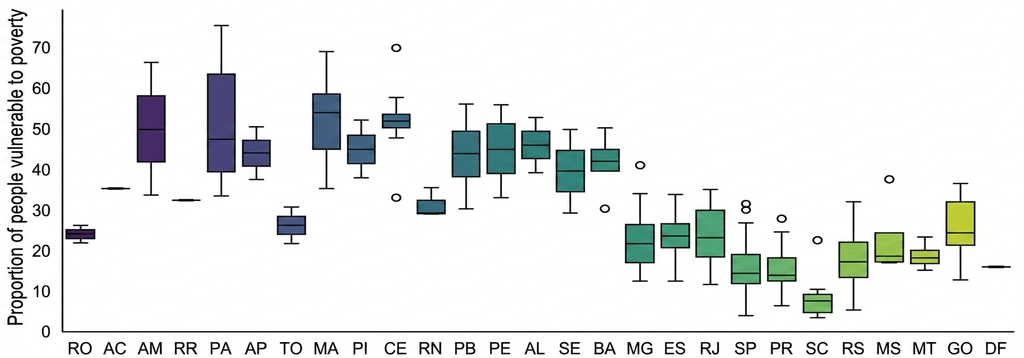
The distribution of poverty-vulnerable populations by UF consolidated the observed geographic patterns, indicating a sharp concentration in the North and Northeast, where states like Maranhão and Pará exhibited medians above fifty percent. In contrast, the Southern states, particularly Santa Catarina, registered the lowest percentages. The strong visual correspondence between the geography of poverty vulnerability and that of lethal violence suggests that economic precariousness, combined with deficits in development, inequality, and infrastructure, forms a synergy of factors associated with higher levels of violence.
Figure 8. Inadequate sewage and water supply network in 2010
Source: Original research results
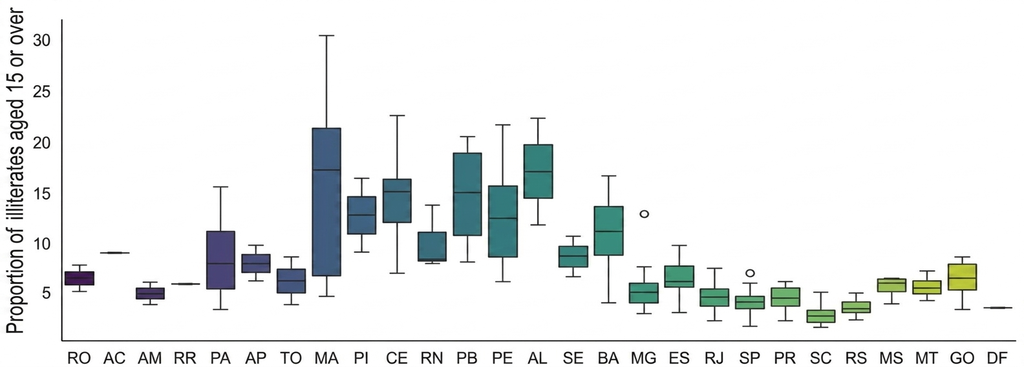
The proportion of illiterates aged 15 and over, a fundamental indicator of human and educational capital, reiterated the observed geographic pattern. There was a strong concentration of illiteracy rates in the Northeastern states, with Alagoas, Maranhão, and Paraíba showing the most critical levels. In contrast, the Federal District and the South and Southeast regions, led by Santa Catarina and São Paulo, exhibited the lowest medians. This finding reinforces the hypothesis that education plays a crucial role in reducing violence.
Figure 9. Proportion of poverty vulnerable
Source: Original research results
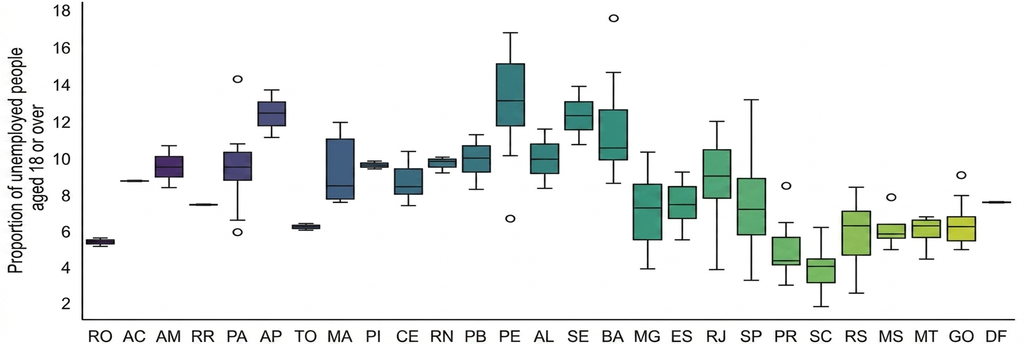
Finally, the proportion of unemployed individuals aged 18 and over, a direct measure of economic instability and the scarcity of opportunities in the labor market, also revealed a clear positive visual correlation with the lethal violence rate. States with high rates of violent mortality, such as Bahia and Alagoas, were precisely those that exhibited the highest unemployment medians. In contrast, states with the most favorable public safety scenarios, such as Santa Catarina and São Paulo, presented the lowest unemployment rates.
This geographical alignment between precariousness in the labor market and the incidence of lethal violence strengthens the hypothesis that the deterioration of economic conditions constitutes an environment that potentiates the occurrence of violent crimes. In summary, the analysis of socioeconomic predictors (IDHM, Gini, sanitation, poverty vulnerability, illiteracy, and unemployment) reveals a notable convergence of vulnerabilities. The same Federative Units that suffer from the highest rates of lethal violence tend to consistently present the worst social and economic indicators, providing a solid empirical basis for the hypothesis that violence is a phenomenon associated with a complex of socioeconomic factors.
Figure 10. Proportion of illiterates aged 15 and over in 2010
Source: Original research results Multicollinearity Analysis and Principal Component Analysis
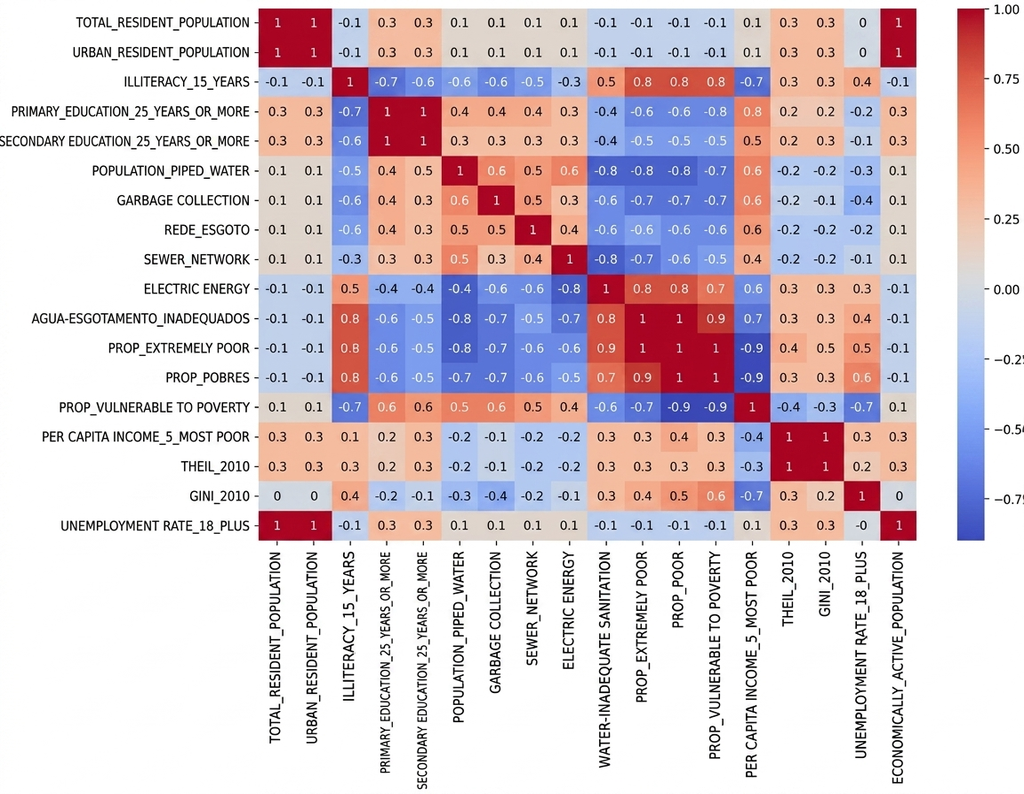
The initial analysis of the Pearson correlation matrix between the study’s predictor variables, illustrated in Figure 11, indicated the presence of multicollinearity. Many cross-sections showed coefficients above 0.4, suggesting that the socioeconomic variables were highly correlated with each other. This phenomenon is common in social studies, where different indicators of development and well-being tend to move together, but it can seriously bias regression models, making coefficient interpretation difficult.
Figure 11. Proportion of unemployed aged 18 years or over
Source: Original research results
To confirm the presence and severity of multicollinearity, the Variance Inflation Factor (VIF) was calculated for each variable. The results showed extremely high levels of VIF, with values such as 8,324.28 for Resident Population and 6,376.48 for Resident Urban Population. Other variables, such as Percentage of households with electricity (4,283.77) and Gini Index (3,849.12), also presented VIFs well above the limit of 5 or 10, which James et al. (2023) consider problematic. This high collinearity made it impossible to use the variables in their raw state in the models.
Faced with this challenge, Principal Component Analysis (PCA) was employed to transform the 18 original variables into a smaller set of orthogonal, i.e., independent, thematic factors. This dimensionality reduction technique is crucial for mitigating multicollinearity and improving model interpretability. PCA condensed the variables into five complex indicators: Population, Education, Infrastructure, Poverty and Inequality, and Employment, each with significant explained variance.
The Population factor, composed of Total Resident Population and Resident Urban Population, explained 99.99% of the variance of its original variables. The Education factor, which included Percentage of the population with complete elementary and secondary education and Illiteracy, explained 84.10%. Infrastructure, with variables such as Electric Energy, Garbage Collection, Piped Water, and Inadequate Sewage, explained 66.86%. Poverty and Inequality, encompassing Gini, Theil, Proportion of Poor, Vulnerable, and Extremely Poor People, explained 68.73%. Finally, the Employment factor, composed of Economically Active Population and Unemployment Rate, explained 50.21% of the variance. These synthetic factors function as thematic indicators, condensing multiple variables into interpretable dimensions, according to Januzzi (2002).
The interpretation of the factors was performed based on the factor loadings of the original variables, where the magnitude indicates the strength of the contribution and the sign, the direction of the association. For example, the Population factor (weight 0.707 for both variables) represents the total population size and, to a lesser extent, the urban population. The Education factor (positive weights for schooling and negative for illiteracy) indicates the population’s educational level. Infrastructure (positive weights for access to services and negative for inadequacy) measures the quality of basic infrastructure. Poverty and Inequality (positive weights for poverty and inequality and negative for per capita income of the poorest) reflects economic precariousness and income concentration. The Employment factor (positive weight for economically active population and negative for unemployment rate) reflects a favorable labor market situation.
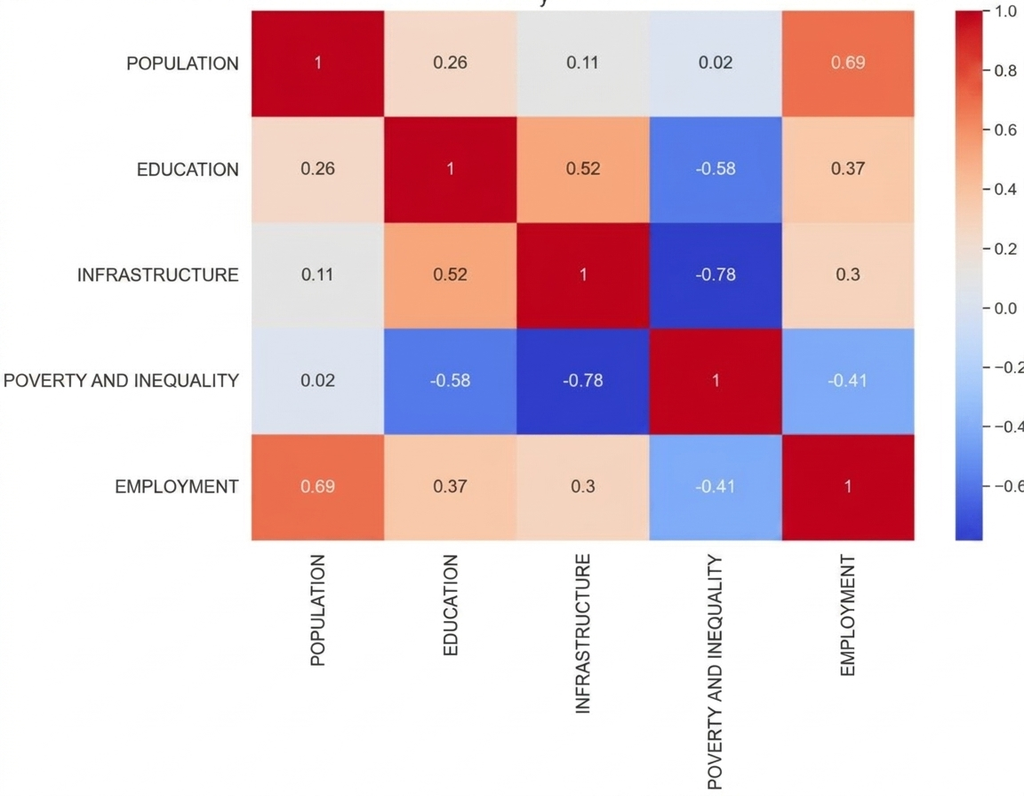
Despite the transformation by PCA, which generated partial orthogonality within each thematic factor, the correlation between the new factors still persisted, as shown in Figure 12. However, the VIF diagnosis for these new factors revealed that all had values less than 5, ensuring the assumption of independence of the predictor variables necessary for regression modeling. The VIFs ranged from 4.575 for Poverty and Inequality to 1.707 for Education, indicating that multicollinearity was significantly reduced, allowing the research to continue with greater reliability in the models’ results.
Figure 12. Correlation matrix between the predictor variables
Source: Original research results Parametric modeling results
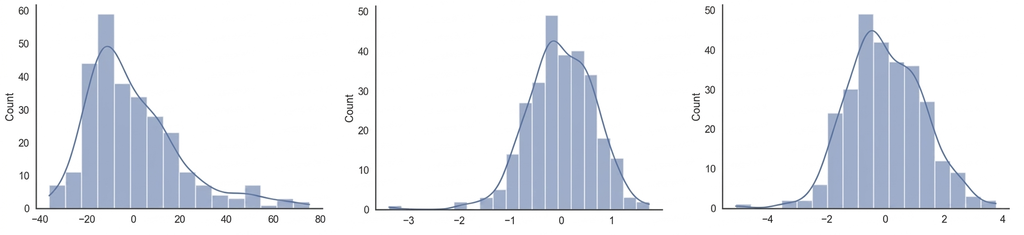
The initial parametric models, Multiple Linear Regression (MLR), MLR with Logarithmic Transformation (Log-MLR), and MLR with Box-Cox transformations (MLR-BC), presented serious limitations. Testing revealed violation of the assumption of normality of residuals for the MLR and Log-MLR models (p-value < 0.05 in Shapiro-Wilk tests), and low explanatory power (R² between 0.21 and 0.23). Residual analysis, illustrated in Figure 13, shows that these models tended to err more intensely on higher values, with little improvement in predictions even after transformations.
Figure 13. Correlation between the new factors created
Source: Original research results
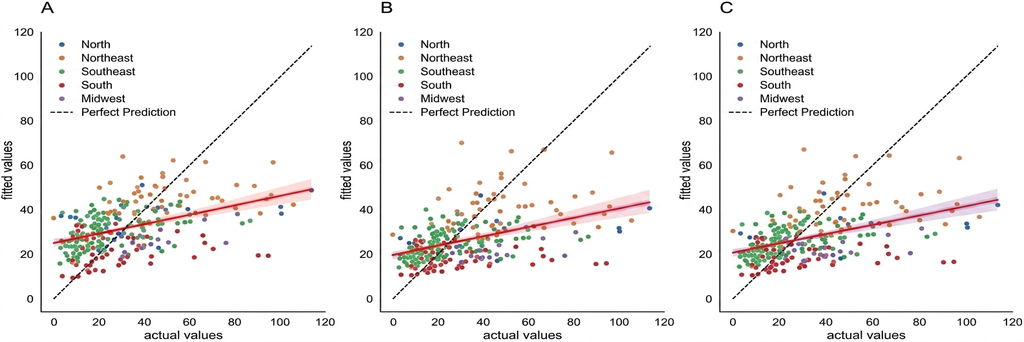
The comparison between the actual and predicted values by the RLM, Log-RLM, and RLM-BC models, presented in Figure 14, reinforces the difficulty of these models in capturing the variance of lethal violence, especially at the extreme values. The 45° perfect prediction line shows that the predictions deviate considerably from the actual values, indicating an unsatisfactory fit. This limitation of linear parametric models highlights the complexity of the phenomenon of violence, which may involve non-linear relationships and interactions that are not adequately captured by these simpler approaches.
Figure 14. RLM residuals (A), Log-RLM (B) and RLM-BC (C)
Source: Original research results
The analysis of figures 14 and 15 shows that the models also tended to more intensely err the higher values, with little improvement in predictions after transformations.
Figure 15. Comparison of RLM (A), Log-RLM (B) and RLM-BC (C) Models
Source: Original research results
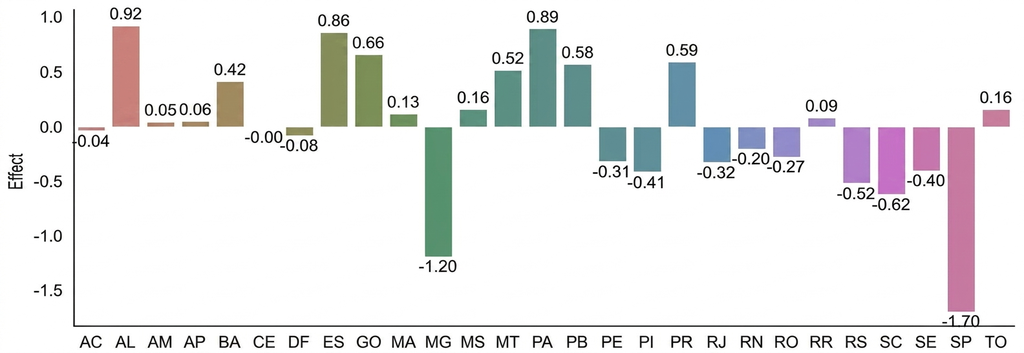
With this information, it can be observed, in Figure 16, the different intercept values of the States, which, as expected, shows the different average values of lethal violence when all coefficients are zeroed.
Figure 16. Random intercept effects in the RLMM-BC model
Source: Original research results Non-parametric modeling results
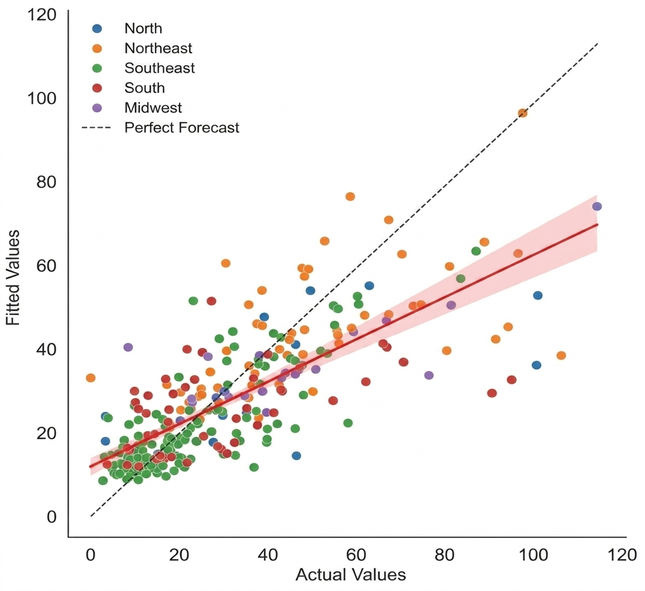
Figure 17 illustrates the different intercept values of the States, which, as expected, show the average variations in lethal violence when all coefficients are zeroed. In predictive terms, the RLMM-BC model represented a significant advance compared to previous models, achieving a Pseudo-R² of 0.617.
Figure 17. Comparison of actual and fitted values by the RLMM-BC Model
Source: Original research results
During the training of the non-parametric Random Forest Regressor (RFR) model, it was observed that performance improved with larger amounts of training samples. After exhaustive experimentation with random parameter values, using a range of 88% to 95% of the database for training, the best model was obtained with 94% of the database. The hyperparameters found, such as `max_depth=38`, `n_estimators=370`, and `min_samples_leaf=2`, optimized the model’s performance, as detailed in Figure 18.
Figure 18. Hyperparameters of the best model found

Source: Original research results
The validity of the RFR results was deepened by comparing the predicted values for 2010 with the actual values from subsequent years, from 2011 to 2021. An important finding, already pointed out by Ribeiro and Cano (2016), is the relationship between the reference year of the socioeconomic variables and their long-term effects. A drop in the model’s R² was observed over the years, with its peak in 2011 and degradation from 2019 onwards. This decrease in performance can be attributed both to changes in the distribution of violence and to the importance of the studied variables over time.
The observed coefficients, however, suggest that the 2010 indicators maintained much of their validity until the drop in 2019 and the loss of validity in 2020, the year of the COVID-19 pandemic. This partial resilience of the 2010 factors indicates that, despite social and economic dynamics having changed, some explanatory foundations of lethal violence remained relevant for a considerable period, reinforcing the importance of updated data for the formulation of public policies.
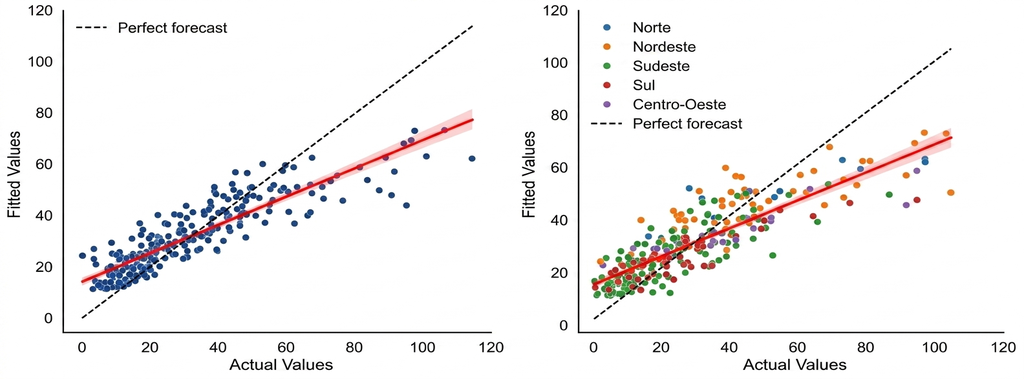
As a result, the RFR model achieved a coefficient of determination (R²) of 0.706 for the year 2010 and 0.683 for 2011. This means that the model, built from the partial components of the selected variables, was able to explain approximately 70.6% of the variation in violence rates in Brazilian municipalities in 2010 and 68.3% in 2011. The model’s performance, illustrated in Figure 19, shows a significantly better fit to the data compared to parametric models, with predictions aligning more closely to the perfect prediction line.
Figure 19. RFR model performance in 2010 and 2011
Source: Original research results Understanding the socioeconomic factors of urban lethal violence
The comparison of the metrics of the tested models revealed little difference between the first three parametric models (RLM, Log-RLM, RLM-BC), which presented R² between 0.212 and 0.229. In contrast, the Random Forest Regressor (RFR) model was the most performant, with R² of 0.706 for 2010 and 0.683 for 2011, followed by the Multilevel Regression with Box-Cox Transformations (RLMM-BC) model, which achieved an R² of 0.617. In terms of error, the RFR also stood out, with the lowest RMSE of 12.27, while the RLMM-BC registered 14.39, and the simple linear models ranged between 20.02 and 20.81.
When analyzing the normalized coefficients of the parametric models, the RLMM-BC indicated that Population (0.732) and Employment (-0.645) were the most impactful factors, followed by Education (-0.148) and Infrastructure (0.185). Population and unemployment (implicit in the Employment factor with a negative coefficient) showed a positive relationship with the increase in violence, while education exerted a reducing effect. The Infrastructure factor, interestingly, presented a marginally positive relationship with lethal violence, which may reflect its concentration in large urban centers that also have a larger population and, at times, a higher incidence of violence.
In contrast, in the RFR model, the relative importance of the factors was more balanced and without a specific direction, indicating that violence is explained by a combined set of predictors. Poverty and Inequality (22.92%) and Infrastructure (21.98%) were the factors with the greatest contribution to the improvement of predictive power and the decrease in the model’s mean error. Education (19.56%), Employment (19.52%), and Population (16.02%) also showed significant importance, but with less disparity among them.
The contrast between parametric models and RFR can be explained by the nature of the relationships. Linear models and RLMM-BC failed to find a clear monotonic effect for the relationship between poverty, inequality, and violence, suggesting that this relationship is extremely complex and non-linear. RFR, being a non-parametric model, is capable of capturing these complex and non-linear interactions, offering a more comprehensive understanding of the factors influencing lethal violence. This ability to capture complex and lasting interactions underscores the need for integrated public policies that address employment, urbanization, and inequality in a multifaceted way.
The results of this study validate the central hypothesis that urban lethal violence can be modeled as a function of socioeconomic indicators, with the RLMM-BC and RFR models demonstrating an explanatory capacity of over 60% of the variation in violence from 2010 to 2016. This predictive capacity reinforces the relevance of these indicators for academic study and for the formulation of evidence-based public policies. Population density and unemployment are directly associated with an increase in lethal violence, while education has a reducing effect, and infrastructure, although marginally, is also related to an increase, possibly due to concentration in large urban centers.
4. Conclusion
This study analyzed the contribution of socioeconomic indicators in explaining the rates of intentional violent deaths in 282 Brazilian municipalities, employing an approach that combined Principal Component Analysis, multilevel regression, and machine learning. It was found that urban lethal violence can be modeled as a function of socioeconomic factors, with the Multilevel Regression (RLMM-BC) and Random Forest Regressor (RFR) models demonstrating an explanatory capacity of over 60% of the violence variation in 2010 and up to 2016. The RLMM-BC model indicated that population density and unemployment were positively associated with an increase in lethal violence, while education exerted a reducing effect. Infrastructure, although marginally, was also related to an increase, possibly due to its concentration in large urban centers. In turn, the RFR, by capturing complex nonlinear interactions, revealed a more balanced importance among the factors, highlighting Poverty and Inequality and Infrastructure as those with the greatest contribution to predictive power.
The main contribution of this work lies in the empirical validation of the relevance of socioeconomic indicators for understanding lethal violence, providing subsidies for the formulation of integrated public policies that address employment, urbanization, and inequality in a multifaceted way. However, the conclusions are restricted to municipalities with a population greater than 100,000 inhabitants, and are not generalizable to smaller localities. It was also observed that the predictive performance of the models, trained with 2010 data, showed degradation in more recent years, especially from 2019 onwards, which suggests changes in the dynamics of violence and socioeconomic conditions over time. It is recommended that the future availability of the 2022 Census data be used for new research, re-evaluating the weights of socioeconomic factors for the 2020s and improving the understanding of the phenomenon.
Bibliographic References
Alves, L. G. A.; Ribeiro, H. V.; Rodrigues, F. A. 2018. Crime prediction through urban metrics and statistical learning. Physica A: Statistical Mechanics and its Applications 505: 435-443.
Cano, I.; Santos, N. 2001. Violência letal, renda e desigualdade no Brasil. 1ed. 7Letras, Rio de Janeiro, RJ, Brasil.
Cerqueira, D.; Bueno, S. (coord.). Atlas da violência 2024. Brasília: Ipea; FBSP. Disponível em: https://repositorio.ipea.gov.br/handle/11058/14031. Acesso em: 22 mar. 2025.
Coelho, D. S. C. 2024. Inteligência artificial em justiça e segurança pública: exemplos e recomendações para políticas públicas. Diest: Nota Técnica, 65. Disponível em: https://www.ipea.gov.br/atlasviolencia/arquivos/artigos/8191-pub-expressant-da-diest
65inteligencia-artificial-em-justica.pdf. Acesso em: 22 mar. 2025.
Fórum Brasileiro de Segurança Pública. 2024. 18º Anuário Brasileiro de Segurança Pública. São Paulo, SP, Brasil. Disponível em: https://publicacoes.forumseguranca.org.br/handle/123456789/253. Acesso em: 24 mar. 2025
Géron, A. 2023. Hands-On Machine Learning with Scikit-Learn, Keras, and Tensorflow: Concepts, Tools, and Techniques to Build Intelligent Systems. 3ed. O’Reilly. Sebastopol, CA, USA.
James, G.; Witten, D.; Hastie, T.; Tibishirani, R.; Taylor, J. 2023. An Introduction to Statistical Learning: with Applications in Python. 1ed. Springer, New York, NY, USA. Disponível em: https://www.statlearning.com/. Acesso em: 22 mar. 2025.
Januzzi, P. 2001. Indicadores Sociais no Brasil: conceitos, fontes de dados e aplicações para formulação e avaliação de políticas públicas e elaboração de estudos socioeconômicos. 3ed. Alínea, Campinas, SP, Brasil.
Kellstedt, P. M.; Whitten, G. D. 2018. The fundamentals of political science research. Cambridge University Press.
Lombroso, C., L ‘uomo delinquente. 1876. s/e, Roma, Itália.
Ludwig, J.; Mullainathan, S. 2021. In Fragile Algorithms and Fallible Decision-Makers: Lessons from the Justice System. Journal of Law & Economics 64(S1): 175-200.
Mandalapu, V.; Lavanya, E.; Vyas, P.; Roy, N. 2023. Crime Prediction Using Machine Learning and Deep Learning: A Systematic Review and Future Directions. IEEE Access 11: 10151873.
O’Neil, C. 2016. Weapons of Math Destruction: How Big Data Increases Inequality and Threatens Democracy. 1ed. Crown, New York, NY, USA.
Rodrigues, R. N. 2011 [1894]. As raças humanas e a responsabilidade penal no Brasil. CEPS, Rio de Janeiro, RJ, Brasil.
Silva, T. 2022. Racismo Algorítmico: inteligência artificial e discriminação nas redes digitais. SESC, São Paulo, SP, Brasil.
Shaw, C. R.; McKay, H. D. 1969. Juvenile Delinquency and Urban Areas: a study of rates of delinquency in relation to differential characteristics of local communities in american cities. 2ed. University of Chicago Press, Chicago, IL, USA.
GITHUB available at: https://github.com/lucastelso/fatores-violencia-letal
Article originating from the Course Conclusion Work of the Specialization in Data Science and Analytics of the MBA USP/Esalq
To learn more about the course, click here and access the MBX Academy platform