
September 15, 2026
Accuracy of Demand Forecasting Models in the Brazilian Soybean Market
Jonwfer Lauro Votdk; Rodolfo Ribeiro
DOI: 10.22167/2675-6528-202602240
Article derived from a Final Course Work (TCC), with content based on the student’s original work and adapted to the editorial format of the E&S Magazine with the support of the ResumeAI tool, an artificial intelligence solution developed by the Pecege Institute for textual synthesis and organization.
Abstract
Demand forecasting is a critical component for planning and risk management decisions in commodity chains, such as soybeans, where seasonality and volume concentration can amplify operational and economic impacts. The accuracy of forecasting models applied to the monthly export volume of Brazilian soybeans was evaluated, with the objective of identifying the forecasting model with the best performance for this context and estimating the economic exposure associated with forecasting error. Monthly data from January 2016 to December 2025 were used, obtained from Comex Stat for HS code 12019000. The data were segregated into an estimation sample (2016–2024) and a test sample (2025) for out-of-sample validation. Five methods were implemented: Naive, Seasonal Naive, 3-month moving average, 12-month moving average, and Seasonal Exponential Smoothing (ETS). Performance was measured by MAE, RMSE, MAPE, WMAPE, and BIAS, with WMAPE adopted as the primary criterion for weighting the error by the realized volume; additionally, the cost of error was estimated in US$ based on the monthly FOB value. The results indicated that ETS showed the best overall performance in the test sample, with lower error and bias, followed by Seasonal Naive, while Naive and moving averages showed greater underestimation, especially in peak months. The explicit incorporation of seasonality and the use of complementary metrics reduced uncertainty and economic exposure associated with forecasting error in the analyzed scenario.
Keywords: Error cost; Demand planning; Seasonality; Exponential smoothing; WMAPE.
1. Introduction
Brazilian agribusiness has soy as a fundamental pillar, positioning it centrally in international trade of agricultural commodities. The oilseed accounts for approximately half of the volume of grains produced in the country (Agência GOV, 2025). Brazil stands out as the world’s largest producer, with an estimated production of 169.49 million tons in the 2024/2025 harvest, cultivated in about 58% of the national agricultural area, which corresponds to approximately 47.61 million hectares (Brasil, 2025). This projection underscores the economic, logistical, and strategic relevance of the sector for the trade balance and for the supply of essential production chains, such as animal feed, vegetable oil, and biofuels (EMBRAPA, 2025). Furthermore, soy has a significant participation in both the external market and domestic consumption, with expressive volumes of export and processing (Vieira Filho, 2024).
The importance of soybeans in Brazil transcends primary production, extending through a complex value chain that includes planting decisions, storage, crushing, transportation, commercialization, and export. All these stages are highly sensitive to fluctuations in demand, prices, exchange rates, climatic conditions, and infrastructure (SCOT Consultoria, 2025). In 2024, the volume of soybeans in grains exported reached 98.815 million tons, while 55.811 million tons were destined for domestic consumption. This scenario highlights the magnitude of the chain and the need for effective coordination between supply and demand. Consequently, demand forecasting becomes a crucial element for companies and agents involved in sales and operations planning, supply, origination, and inventory management (EMBRAPA, 2025).
Despite its relevance, soybean market demand forecasting presents inherent challenges, given that the time series is influenced by structural and cyclical factors. Previous studies on soybeans in Brazil indicate that statistical models, such as exponential smoothing, regression, and ARIMA, can generate useful results, but their performance varies according to the series’ characteristics, seasonality, forecasting horizon, and the occurrence of external shocks (Schmidt et al., 2019). In the field of demand forecasting, there is a consensus that no universally superior method exists for all contexts, which makes comparing different models an indispensable step to identify the most suitable approach for the segment studied (Makridakis and Hibon, 2000). The literature also warns that accuracy evaluation is complex, as different metrics can lead to distinct rankings among models and, in certain situations, may present practical problems or misleading interpretations (Hyndman and Koehler, 2006). Therefore, comparison with reference models, or benchmarks, is fundamental, as sophisticated forecasts do not always outperform simpler methods (Goodwin, Petropoulos and Hyndman, 2017).
More accurate forecasts are essential in the business environment, especially in sales and operations planning (S&OP) operations, as they contribute to the reduction of stockouts, excess inventory, misalignments between supply and demand, and the waste of working capital. Accuracy should not be seen merely as the proximity between the forecasted and actual values, but also as the absence of bias, stability over time, and adequacy to the observed horizon. Thus, the comparative analysis between forecasting models in the Brazilian soybean market is relevant from both an academic and managerial perspective, offering subsidies for planning, supply, and commercialization decisions (Hyndman and Athanasopoulos, 2021). Given this context, the objective of this study is to identify the forecasting model with the best performance for this context and to estimate the economic exposure associated with forecasting error.
2. Material and Methods
This study was characterized as an applied research, with a quantitative approach and a descriptive-comparative objective, evaluating the performance of different models for forecasting external demand for Brazilian soybeans from the comparison of accuracy metrics. The analysis was based on monthly time series of soybean grain exports.
The data were extracted from Comex Stat, the official system of the Ministry of Development, Industry, Trade and Services (MDIC) for foreign trade statistics, using NCM code 12019000 (Soybeans, whether or not crushed, other than for sowing). The analyzed period comprised January 2016 to December 2025, totaling 120 monthly observations. The sample was divided into two subsets: January 2016 to December 2024 for model estimation, and January to December 2025 for validation. The query in Comex Stat can be accessed at: https://comexstat.mdic.gov.br/pt/geral/149927.
The variables used were treated and are detailed in Table 1.
Table 1. Variables Used
| Variables | Description |
|---|---|
| Type | Diferentiation between Test Sample and Estimation Sample |
| Year | Year referring to the presented data |
| Month | Reference month for the presented data |
| Date | Complete data referring to the presented data |
| NCM Code | Mercosur Common Nomenclature |
| NCM Description | Description of the Southern Common Market Nomenclature |
| Net Kilogram | Volume extracted from Comex Stat in kg |
| Volume in tons | Volume converted to tons |
| FOB Value USD$ | FOB (“Free On Board”) value in dollars |
Source: Original survey data
The validation strategy adopted was out-of-sample validation, ensuring that the realized values for 2025 were not used in the model construction phase. The predictions generated by each model, as well as the calculation of error metrics, were implemented using Excel formulas in an auxiliary spreadsheet, guaranteeing traceability between original data, predictions, and evaluation results. The models were estimated with data from the estimation sample and used to generate predictions for the 12 months of 2025, compared with the realized values in that period to evaluate the predictive capacity of each method.
Five forecasting models were implemented:
- The Naive Model assumes that the best forecast for a period corresponds to the value observed in the immediately preceding period. The value of December 2024 was considered for January 2025, and subsequent forecasts kept this value fixed. This model was used as a “benchmark”.
- The Seasonal Naive Model considered annual seasonality, assigning as a forecast for a month the value observed in the same month of the previous year (e.g., January 2025 was the actual value from January 2024). This model is suitable for monthly series with recurring seasonal patterns.
- The 3-month moving average was implemented from the arithmetic mean of the three immediately preceding months. For out-of-sample validation, an auxiliary series was created to use the model’s own predictions generated in the test sample months.
- The 12-month moving average was estimated analogously, considering 12 periods to capture long-term patterns of the series. An auxiliary series was also created to consider the forecast data of this model for the months of 2025.
- The Exponential Smoothing (ETS) Model with error, trend, and seasonality was implemented through the Excel formula FORECAST.ETS(), which automatically estimates the series components based on historical data. The period from January 2016 to December 2024 and a 12-month seasonality were considered.
The performance of the models was evaluated by error and bias metrics, calculated in Excel from the comparison between predicted and actual values of the test sample. The metrics used were:
- Mean Absolute Error (MAE): Calculated by equation (1): MAE = (1/n) × Σ|Yт – Ўт| where: n is the number of calculated months, equal to 12; Yт is the realized volume per month in 2025; and Ўт is the volume observed by the model in the comparison month.
- Root Mean Square Error (RMSE): Calculated by equation (2): RMSE = √(1/n) × Σ(Yт – Ўт)² where: n is the number of months calculated, equal to 12; Yт is the volume achieved per month in 2025; and Ўт is the volume observed by the model in the comparison month.
- Mean Absolute Percentage Error (MAPE): Calculated by equation (3): MAPE = (100/n) × Σ|(Yт – Ўт) / Yт| where: n is the number of months calculated, equal to 12; Yт is the realized volume per month in 2025; and Ўт is the volume observed by the model in the comparison month.
- Weighted Mean Absolute Percentage Error (WMAPE): Calculated by equation (4): WMAPE = (Σ|Yт – Ўт| / ΣYт) × 100 where: Yт is the realized volume per month in 2025; and Ўт is the volume observed by the model in the comparison month.
- BIAS (bias): Calculated by equation (5): BIAS = (1/n) × Σ(Ўт – Yт) where: n is the number of calculated months, equal to 12; Yт is the volume realized per month in 2025; and Ўт is the volume observed by the model in the comparison month.
Beyond statistical metrics, the economic impact of demand forecast error was estimated using the FOB value US$ extracted from Comex Stat for NCM 12019000 and the test sample. The objective was to understand the financial impact of the error, representing the value associated with the incorrectly forecasted volume. The unit price per ton for each month of 2025 was calculated by equation (6):
PUT = FOB Value US$т / Yт
where: PUT is the monthly unit price per ton; FOB value US$t is the observed value in month t; and Yt is the volume observed in the comparison month.
Next, the monthly error volume for each prediction model was obtained by equation (7):
et = Yt – Yt
where: eт is the error in the month; Ўт is the volume observed by the model in the comparison month; and Yт is the volume realized per month.
When et was less than 0, the forecast was considered underestimated; when et was greater than 0, the forecast was considered overestimated. The cost of the error was estimated as the economic exposure linked to the unit price of the analysis month, according to equation (8):
Ct = |et| × PUT
where: Cт is the cost of error; eт is the error in the month; and PUT is the monthly unit price per ton.
In summary, the forecasting models were calculated on the test sample for the 12 months of 2025, ensuring comparability. Predictive performance was measured by complementary error and bias metrics (MAE, RMSE, MAPE, WMAPE, and BIAS), calculated from the comparison between predicted and actual values, and by the cost of error. For the selection of the best-performing model, WMAPE was adopted as the main criterion, as it represents the percentage error weighted by the actual volume, reducing distortions in periods of low magnitude and facilitating managerial interpretation. MAE and RMSE were used to identify the magnitude of the error in tons, and BIAS to identify the tendency of overestimation or underestimation. The cost of error in US$ provided an economic dimension of demand underestimation and overestimation.
3. Results and Discussion
This study evaluated the accuracy of different demand forecasting models applied to the monthly export volume of soybeans in Brazil, comparing the forecasts generated from the estimation sample with the actual values in the test sample. The models’ performance was measured by complementary error and bias metrics, such as Mean Absolute Error (MAE), Root Mean Squared Error (RMSE), Mean Absolute Percentage Error (MAPE), Weighted Mean Absolute Percentage Error (WMAPE), and BIAS, in addition to exposure to the cost of error. WMAPE was adopted as the main selection criterion, as it reflects the percentage error weighted by the actual volume, aligning with the managerial impact of the error. The other metrics provided interpretive support, with MAE and RMSE evaluating the magnitude of the error, MAPE as an additional percentage measure, and BIAS identifying the systematic tendency of overestimation or underestimation (Hyndman and Koehler, 2006).
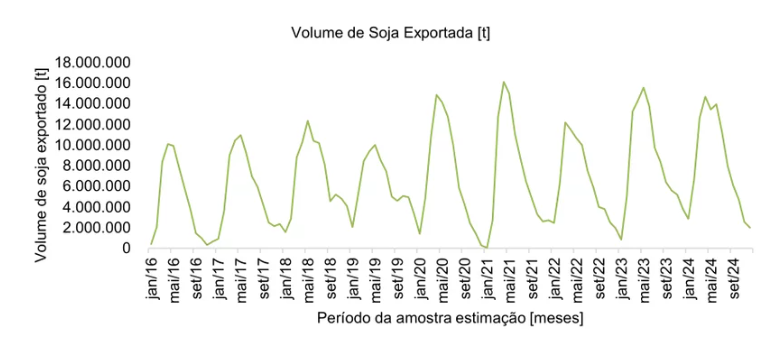
In the estimation sample, from January 2016 to December 2024, a seasonal behavior was observed in the volume of soybeans exported, impacted by the cultivation cycle. Figure 1 illustrates this pattern, with low volumes at the beginning of the year, peaks between March and May, and a gradual reduction in the second half of the year. This seasonality reinforces the need for models that consider these variations (Hyndman and Athanasopoulos, 2021).
Figure 1. Volume of Soy exported in tons between January/2016 and December/2024
Source: Original research results and data extracted from the Comex Stat system (MDIC)(Brazil, [n.d.])
The demand forecasts for the months of 2025, generated by the Naive, Seasonal Naive, 3-month Moving Average (MA3), 12-month Moving Average (MA12), and Seasonal Exponential Smoothing (ETS) models, were calculated from the estimation sample data. Table 2 presents these predicted values in comparison with the realized volume.
Table 2. Demand forecast by the chosen models for the months of 2025
| Date | Performed | Ingenuous | Seasonal naive | MM3 | MM12 | ETS |
|---|---|---|---|---|---|---|
| Jan/25 | 1.069.087 | 2.006.054 | 2.854.860 | 3.089.530 | 8.233.987 | 3.114.695 |
| Feb/25 | 6.428.317 | 2.006.054 | 6.608.134 | 2.549.461 | 8.682.248 | 6.473.643 |
| Mar/25 | 14.657.781 | 2.006.054 | 12.600.297 | 2.548.348 | 8.855.090 | 13.037.785 |
| Apr/25 | 15.271.914 | 2.006.054 | 14.687.842 | 2.729.113 | 8.542.990 | 14.641.939 |
| may/25 | 14.099.745 | 2.006.054 | 13.436.721 | 2.608.974 | 8.030.919 | 14.481.086 |
| Jun/25 | 13.420.319 | 2.006.054 | 13.959.612 | 2.628.812 | 7.580.435 | 13.257.230 |
| July/25 | 12.257.306 | 2.006.054 | 11.249.768 | 2.655.633 | 7.048.837 | 10.679.878 |
| Aug/25 | 9.325.162 | 2.006.054 | 8.037.754 | 2.631.140 | 6.698.760 | 8.399.443 |
| Sep/25 | 7.339.951 | 2.006.054 | 6.104.265 | 2.638.528 | 6.587.177 | 6.477.453 |
| Oct/25 | 6.727.671 | 2.006.054 | 4.709.739 | 2.641.767 | 6.627.419 | 5.584.987 |
| Nov/25 | 4.197.159 | 2.006.054 | 2.552.798 | 2.637.145 | 6.787.226 | 4.543.391 |
| 12/25 | 3.383.155 | 2.006.054 | 2.006.054 | 2.639.147 | 7.140.095 | 3.861.693 |
Source: Original research results and data extracted from the Comex Stat system (MDIC)(Brazil, [n.d.])
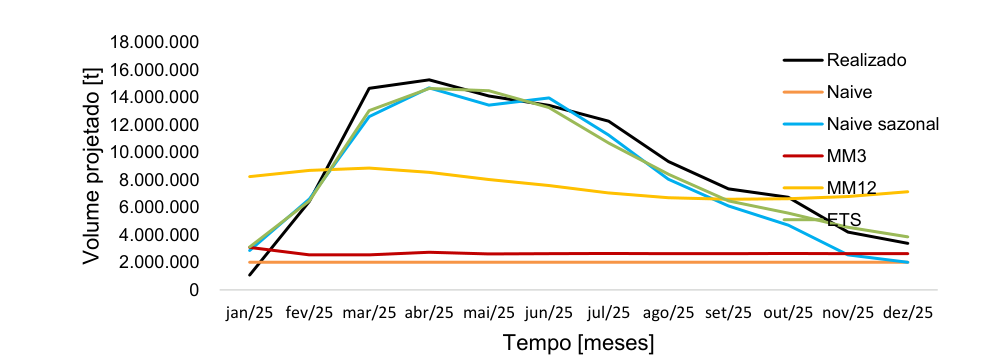
The comparison between the realized volume and the forecasts of each model for 2025, presented in Figure 2, revealed that the Naive seasonal and ETS models were the closest to the actual volume. Both models consider seasonality as a forecasting factor. The ETS, by considering the 12-month seasonality and using 9 years of data, managed to identify recurrence and trend. The Naive seasonal replicated the 2024 pattern, showing peaks and troughs consistent with soybean export demand. This performance is consistent with studies indicating that simple methods can be competitive when they capture seasonality (Makridakis and Hibon, 2000).
Figure 2. Comparison between the volume achieved and the forecasts of each model for soybeans exported in 2025
Source: Original research results and data extracted from the Comex Stat system (MDIC)(Brazil, [n.d.])
In contrast, the Naive, MM3, and MM12 models did not approach the volume realized in 2025. The Naive model, based solely on the previous month, significantly underestimated the volume, as it considered the low volume of December 2024 for all 2025 forecasts. The MM3 presented a similar result, influenced by the low volumes from October to December 2024 and using its own forecasts for subsequent months. The MM12 captured seasonality but with reduced amplitude and horizontal displacement, which is due to the inclusion of average values calculated by the model itself in the peak months, resulting in lower forecasts than realized (Hyndman and Athanasopoulos, 2021; Makridakis and Hibon, 2000).
The analysis of error metrics for the test sample period, classified by WMAPE, confirmed the models’ performance. Table 3 details these results.
Table 3. Demand forecasting model metrics
| Model | MAE [t] | RMSE [t] | MAPE [%] | WMAPE [%] | BIAS [t] |
|---|---|---|---|---|---|
| ETS | 851.536 | 1.045.768 | 23,8% | 9,4% | -302.029 |
| Seasonal naive | 1.198.291 | 1.335.352 | 28,8% | 13,3% | -780.810 |
| MM12 | 4.047.505 | 4.670.175 | 94,2% | 45,2% | -1.446.865 |
| MM3 | 6.685.071 | 7.907.642 | 75,8% | 74,2% | -6.348.331 |
| Ingenuous | 7.164.904 | 8.411.923 | 74,9% | 79,5% | -7.008.743 |
Source: Original research results
The ETS model presented the lowest MAE (851.536 t) and RMSE (1,045,768 t), indicating the greatest average proximity between forecast and actual values and the ability to avoid large divergences. The seasonal Naive model was the second best in both criteria (MAE of 1,198,291 t and RMSE of 1,335,352 t), which is expected for a model that captures annual seasonality. The Naive and MM3 models registered significantly higher MAE and RMSE, suggesting that their forecasts were far from the actual values, especially in peak months (Hyndman and Athanasopoulos, 2021).
Regarding MAPE, ETS obtained the lowest value (23.8%), followed by Seasonal Naive (28.8%). The MM12 MAPE was high (94.2%), influenced by months with low actual volume, such as January, where the percentage error was 670.2%. This sensitivity of MAPE to low volumes highlights the importance of evaluating it in conjunction with other metrics (Hyndman and Koehler, 2006).
The WMAPE, the main criterion, confirmed ETS as the best model (9.4%), followed by Seasonal Naive (13.3%). The MM12 (45.2%), MM3 (74.2%), and Naive (79.5%) models showed considerably higher WMAPEs. Models without the capacity to capture seasonality, such as Naive and MM3, underestimated the peaks of the first half of the year, concentrating absolute errors in higher realized volumes and, consequently, increasing the WMAPE.
The BIAS, which indicates the direction of the error, showed a predominant tendency of underestimation in all models. The ETS registered the bias closest to zero (-302.029 t), while the seasonal Naive (-780.810 t) also underestimated, but to a lesser extent than the others. The Naive (-7.008.743 t) and MM3 (-6.348.331 t) models exhibited the largest negative biases, indicating a continuous underestimation that can lead to conservative decisions and demand underestimation (Hyndman and Athanasopoulos, 2021).
To complement the statistical metrics, the cost of the error was calculated in dollars, considering the monthly FOB Value US$ and the exported volume in each month of 2025. Table 4 presents the monthly unit cost per ton.
Table 4. Monthly unit cost in dollars per ton
| Date | Volume in tons | US$ FOB Value | Unit cost |
|---|---|---|---|
| Jan/25 | 1.069.087 | $ 433.412.725 | $ 405,40 |
| Feb/25 | 6.428.317 | $2.543.652.430 | $ 395,69 |
| Mar/25 | 14.657.781 | $5.673.615.141 | $ 387,07 |
| Apr/25 | 15.271.914 | $5.864.208.310 | $ 383,99 |
| may/25 | 14.099.745 | $5.501.158.133 | $ 390,16 |
| Jun/25 | 13.420.319 | $5.337.449.698 | $ 397,71 |
| July/25 | 12.257.306 | $ 5.001.850.667 | $ 408,07 |
| Aug/25 | 9.325.162 | $3.868.955.860 | $ 414,89 |
| Sep/25 | 7.339.951 | $3.103.031.251 | $ 422,76 |
| Oct/25 | 6.727.671 | $2.878.022.046 | $ 427,79 |
| Nov/25 | 4.197.159 | $1.827.759.344 | $ 435,48 |
| 12/25 | 3.383.155 | $ 1.498.479.236 | $ 442,92 |
Source: Original research results and data extracted from the Comex Stat system (MDIC)(Brazil, [n.d.])
The variation in unit price throughout 2025, with lower prices in higher volume months and higher prices in lower volume months, indicates that the economic impact of the forecast error is influenced by both unit price and volume. The annual cost of the error for each model was calculated and is detailed in Table 5.
Table 5. Cost of error for each demand forecasting model
| Prediction model | Cost underestimation | Cost overestimation | Total cost |
|---|---|---|---|
| Ingenuous | $34.057.820.976 | $379.850.481 | $34.437.671.457 |
| Seasonal naive | $4.936.315.383 | $1.009.597.624 | $5.945.913.007 |
| MM3 | $31.253.339.787 | $819.096.726 | $32.072.436.513 |
| MM12 | $13.096.524.451 | $6.588.500.089 | $19.685.024.540 |
| ETS | $2.815.053.787 | $1.358.749.449 | $4.173.803.236 |
Source: Original research results and data extracted from the Comex Stat system (MDIC)(Brazil, [n.d.])
The largest portion of the error cost for all evaluated models is linked to underestimation, which is consistent with the observed negative biases. This underestimation represents a significant operational risk, potentially generating logistical constraints and lower readiness to meet demand during export peaks (Hyndman and Athanasopoulos, 2021; Fildes, Ma and Kolassa, 2019).
In this context, ETS presented the lowest exposure to the total cost of error, with $4,173,803,236, which corresponds to approximately 9.5% of the value exported in 2025. This value was significantly lower than the error costs of the other models. Seasonal Naive registered $5,945,913,007, while models that did not capture seasonality, such as MM12 ($19,685,024,540), MM3 ($32,072,436,513), and Naive ($34,437,671,457), presented much higher error costs. This difference demonstrates that the ETS and Seasonal Naive models not only outperformed the others in accuracy but were also more effective in reducing the economic exposure associated with forecasting error.
In summary, the statistical and cost metrics converged to the same practical conclusion: the ETS model was consistently superior. It led in the WMAPE criterion and presented the lowest MAE and RMSE, the lowest MAPE, the BIAS closest to zero, and the lowest error cost. The seasonal Naive, although not the best, demonstrated good performance and can serve as a useful benchmark for monitoring the added value of more sophisticated models (Goodwin, Petropoulos, and Hyndman, 2017). On the other hand, the moving average models and the Naive did not prove adequate for the dynamics of 2025, failing to capture seasonality and resulting in significantly higher errors (Makridakis and Hibon, 2000).
4. Conclusion
This study evaluated the accuracy of different forecasting models applied to Brazil’s monthly soybean grain export volume, seeking to identify the best-performing model and estimate the economic exposure associated with forecasting error. It was found that the Seasonal Exponential Smoothing (ETS) model consistently showed the best performance in the test sample, with lower weighted mean absolute percentage error (WMAPE), lower absolute error (MAE and RMSE), and lower bias (BIAS). The seasonal Naive model also demonstrated good performance, positioning itself as a robust comparative benchmark. In contrast, the Naive, 3-month Moving Average, and 12-month Moving Average models failed to capture the intrinsic seasonality of the time series, resulting in significant underestimation of export volumes, especially during peak months, and consequently, substantially higher errors and greater economic exposure.
The study’s main contribution lies in identifying a forecasting approach that minimizes uncertainty and economic exposure in the planning of the Brazilian soybean export chain. The adoption of the ETS model, which explicitly incorporates seasonality, offers managerial subsidies for more accurate decisions in sales and operations planning, supply, and risk management. The analysis of the cost of error in dollars revealed that demand underestimation represents the largest share of economic exposure, indicating significant operational risks, such as logistical constraints and lower preparedness to meet demand. The joint evaluation of error and bias metrics, complemented by the quantification of economic impact, proved essential for a comprehensive understanding of model performance, reinforcing that the analysis of a single metric can lead to misleading interpretations.
Bibliographic References
Agência GOV. Conab: safra de grãos 2024/25 será recorde com destaque para milho e soja. Agência Gov, 14 ago. 2025. Disponível em: . Acesso em: 10 abril 2026.
Brasil. Ministério do Desenvolvimento, Indústria, Comércio e Serviços (MDIC). Comex Stat: consulta geral (ID 149927). Brasília, DF: MDIC, [s.d.]. Disponível em: https://comexstat.mdic.gov.br/pt/geral/149927. Acesso em: 10 abril 2026.
Brasil. Secretaria de Comunicação Social da Presidência da República. Produção de grãos deve bater recorde com 332,9 milhões de toneladas na safra 2024/25. Gov.br, 15 maio 2025. Disponível em: . Acesso em: 10 abril 2026.
EMBRAPA. Dados econômicos. Londrina: Embrapa Soja, 2025. Disponível em: . Acesso em: 10 abril 2026.
Fildes, R.; Ma, S.; Kolassa, S. Retail forecasting: Research and practice. International Journal of Forecasting, v. 35, n. 1, p. 1–22, 2019. DOI: 10.1016/j.ijforecast.2018.06.004.
Goodwin, P.; Petropoulos, F.; Hyndman, R. A note on upper bounds for forecast-value-added relative to naïve forecasts. Journal of the Operational Research Society, v. 68, n. 9, p. 1082-1084, 2017.
Hyndman, R.; Athanasopoulos, G. Forecasting: Principles and Practice. 3. ed. OTexts, 2021. Disponível em: https://otexts.com/fpp3/.
Hyndman, R.; Koehler, A. Another look at measures of forecast accuracy. International Journal of Forecasting, v. 22, n. 4, p. 679–688, 2006.
Makridakis, S.; Hibon, M. The M3-Competition: results, conclusions and implications. International Journal of Forecasting, v. 16, n. 4, p. 451–476, 2000.
Schmidt, C.; Tayano, P; Santos, J.; Marujo, L.; Proença, G. Previsões estatísticas com base em séries temporais da cultura da soja no Brasil. Revista Técnico-Científica do CREA-PR, 2020.
SCOT Consultoria. Carta Grãos e Agricultura – Conab confirma produção histórica de soja no Brasil. Scot Consultoria, 27 maio 2025. Disponível em: . Acesso em: 10 abril 2026.
Vieira Filho, J. A produção de soja e sua importância na economia brasileira. Revista de Política Agrícola, v. 33, 2024, e01962. Disponível em: . Acesso em: 10 abril 2026.
Article originating from the Course Conclusion Work of the Specialization in Business Management of the MBA USP/Esalq
To learn more about the course, click here and access the MBX Academy platform