
September 09, 2026
Market Segmentation: Application of Clustering Techniques to Guide Marketing Initiatives
Artur de Menezes Venâncio Martins; Fernando Celso de Campos
DOI: 10.22167/2675-6528-202602128
Article derived from a Final Course Work (TCC), with content based on the student’s original work and adapted to the editorial format of the Revista E&S with the support of the ResumeAI tool, an artificial intelligence solution developed by the Pecege Institute for textual synthesis and organization.
Summary
Market segmentation is a fundamental practice for directing effective marketing strategies. The work aimed to develop a data analysis protocol to guide marketing strategies, using consumer segmentation through unsupervised machine learning, based on demographic and behavioral variables. For this, the K-Means algorithm was implemented, after a preprocessing of the dataset that included variable treatment, missing data exclusion, scaling, standardization, and dimensionality reduction by Principal Component Analysis (PCA). The determination of the optimal number of clusters was performed by the elbow and silhouette methods. The analysis resulted in the creation of three consumer clusters, validated by 2D visualization via PCA and t-SNE, which demonstrated robustness and consistency. Three profiles were identified: Economic Customers (younger, lower income and consumption, more children), Moderate Customers (older, balanced income and consumption), and Elite Customers (high income, high consumption of sophisticated products, fewer children). It was concluded that clustering techniques are effective for identifying consumer profiles based on sociodemographic characteristics, consumption behavior, and family structure, and can optimize the performance and reach of marketing initiatives.
Keywords: Cluster analysis; Machine learning; Consumer behavior; Sociodemographic factors; K-Means.
1. Introduction
Market segmentation, a fundamental concept in marketing, consists of viewing a heterogeneous market as a set of smaller, homogeneous markets (Smith, 1956). This practice is essential for product development, offer definition, and advertising planning (Kotler, 1999; Shirole et al., 2021). Segmentation is the starting point for evaluating marketing strategies, recognizing the diversity of customer interests, desires, and needs (Toledo, 1972).
Traditionally, segmentation can be approached through demographic, geographic, psychographic, and behavioral variables (Kotler and Keller, 2012). However, in a scenario of massive marketing investments, such as the trillions of dollars estimated for online and offline advertising in 2024 (DataReportal, 2025), a generic product cannot satisfy all customers’ needs (Lopes, 2005). The absence of precise segmentation can lead to inefficient marketing efforts and budgetary waste (Cortez et al., 2021; Dolnikar et al., 2013).
In this context, data science offers advanced approaches for market segmentation, using unsupervised machine learning techniques such as cluster analysis (Favero and Belfiore, 2023). These techniques aim to group observations into internally homogeneous and mutually heterogeneous sets, allowing the identification of consumer profiles with similar characteristics and behaviors.
Among clustering methods, the K-Means algorithm stands out for its popularity and effectiveness. It is an exploratory and non-hierarchical technique, where the number of clusters (K) is previously defined by the researcher. Its computational efficiency, ability to handle large volumes of data, and ease of application make it widely used in corporate environments for market segmentation (Sarkar et al., 2024; Maryani et al., 2018; Prabhas et al., 2023). The implementation of K-Means requires pre-processing of the dataset, which involves variable treatment, handling of missing data, scaling, standardization, and dimensionality reduction, often using Principal Component Analysis (PCA). The determination of the optimal number of clusters is verified by methods such as the elbow and silhouette.
The identification of consumption patterns and customer profiles is a fundamental resource for marketing, as it allows for the development of more effective programs (Boyd et al., 1998) and the personalization of campaigns, avoiding the ineffectiveness of generic approaches. The adoption of a machine learning-based data analysis protocol for market segmentation not only optimizes product targeting but also reveals latent consumer characteristics that would be difficult to observe in large datasets without in-depth technical analysis (Yoseph et al., 2020; Osei et al., 2021). This approach contributes to more robust, reproducible, and targeted decision-making, resulting in more efficient and assertive campaigns, with operational gains in reduced analysis time and scalability for large data volumes.
Given the need to optimize marketing strategies through an in-depth understanding of consumer behavior, this work aimed to develop a data analysis protocol based on the evaluation of demographic and behavioral variables to direct marketing strategies, using consumer segmentation through unsupervised machine learning.
2. Material and Methods
The methodological approach employed in this work consisted of four main stages: data base acquisition and description, data analysis and preparation, algorithm development, and cluster analysis. The study used public data extracted from the Kaggle website, accessible at https://www.kaggle.com/datasets/vishakhdapat/customer-segmentation-clustering. The dataset comprised 2,240 customer records and 29 variables, whose descriptions are detailed in Table 1.
Table 1. Description of the database variables
| Variable Name | Description |
|---|---|
| ID | Unique identifier for each individual in the database |
| Year_Birth | Year of birth of each individual |
| Instruction | Highest level of education attained by the individual |
| Marital Status | Individual’s marital status |
| Earnings | Individual annual income |
| Kidhome | Number of children in the household |
| Teenhome | Number of adolescents in the household |
| Dt_Customer | Date on which the client was registered in the company database |
| Recentness | Number of days since last purchase or interaction |
| MntWines | Amount spent on wine |
| MntFruits | Expenditure on fruits |
| MntMeatProducts | Expenditure on meat |
| MntFishProducts | Expenditure on fish |
| MntSweetProducts | Amount spent on sweets |
| MntGoldProds | Expenditure on special products |
| Number of Deals Purchases | Number of purchases made with discount |
| Number of Web Purchases | Number of purchases made through the company’s website |
| NumCatalogPurchases | Number of purchases made through catalogs |
| NumStorePurchases | Number of purchases made in physical stores |
| NumWebVisitsMonth | Number of visits to the company’s website in one month |
| AcceptedCmp1 | Binary indicator (1 = yes, 0 = no) if the individual accepted the first marketing campaign |
| AcceptedCmp2 | Binary indicator (1 = yes, 0 = no) if the individual accepted the second marketing campaign |
| AcceptedCmp3 | Binary indicator (1 = yes, 0 = no) if the individual accepted the third marketing campaign |
| AcceptedCmp4 | Binary indicator (1 = yes, 0 = no) if the individual accepted the fourth marketing campaign |
| AcceptedCmp5 | Binary indicator (1 = yes, 0 = no) if the individual accepted the fifth marketing campaign |
| Protest | Binary indicator (1 = yes, 0 = no) if the individual registered a complaint |
| Z_CostContact | Constant cost associated with customer contact |
| Z_Revenue | A constant rate associated with a successful campaign response |
| Response | Binary indicator (1 = yes, 0 = no) if the individual responded to the marketing campaign |
| Z_Revenue | A constant rate associated with a successful campaign response |
| Response | Binary indicator (1 = yes, 0 = no) if the individual responded to the marketing campaign |
Source: Original survey data
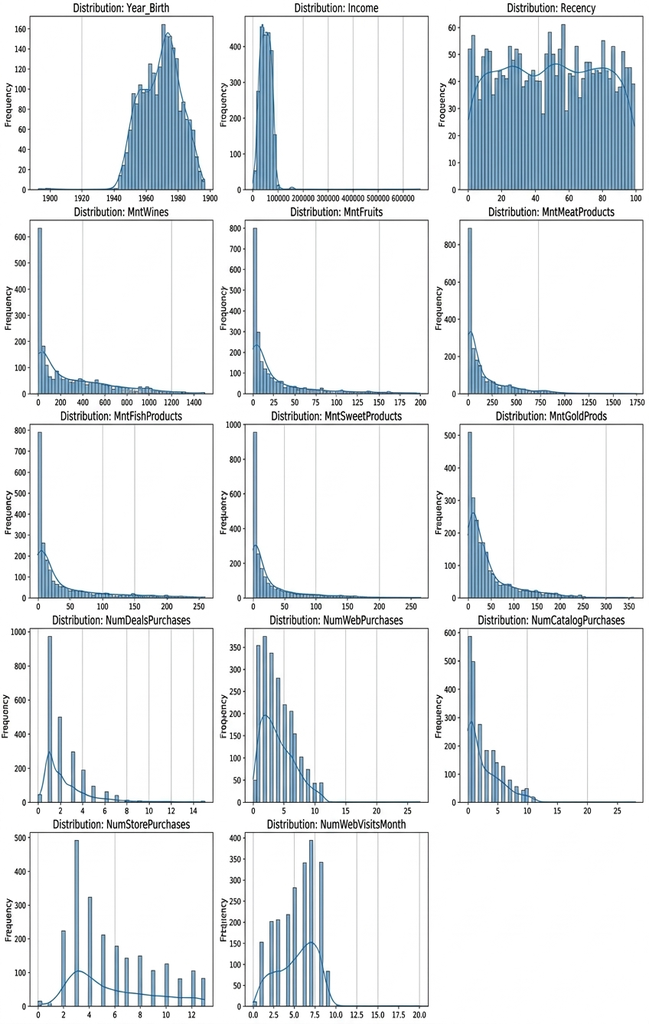
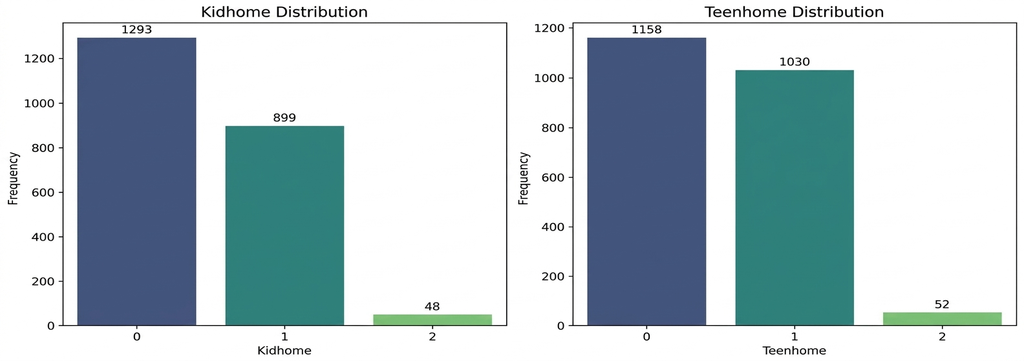
In the data analysis and preparation stage, an exploratory analysis was performed to identify the structure and distribution of the variables, as well as the presence of outliers, missing values, or inconsistencies. Continuous numerical variables, such as “Income”, “Recency”, and “MntWines”, were analyzed for distribution and the need for normalization, with visualization of histograms and density estimation (Figure 1). Discrete numerical variables, such as “Kidhome” and “Teenhome”, were analyzed by frequency distribution, presented in a bar graph (Figure 2).
Figure 1: Histogram with the distribution of continuous numerical variables
Source: Original survey data
Figure 2: Frequency of children and adolescents at home
Source: Original survey data
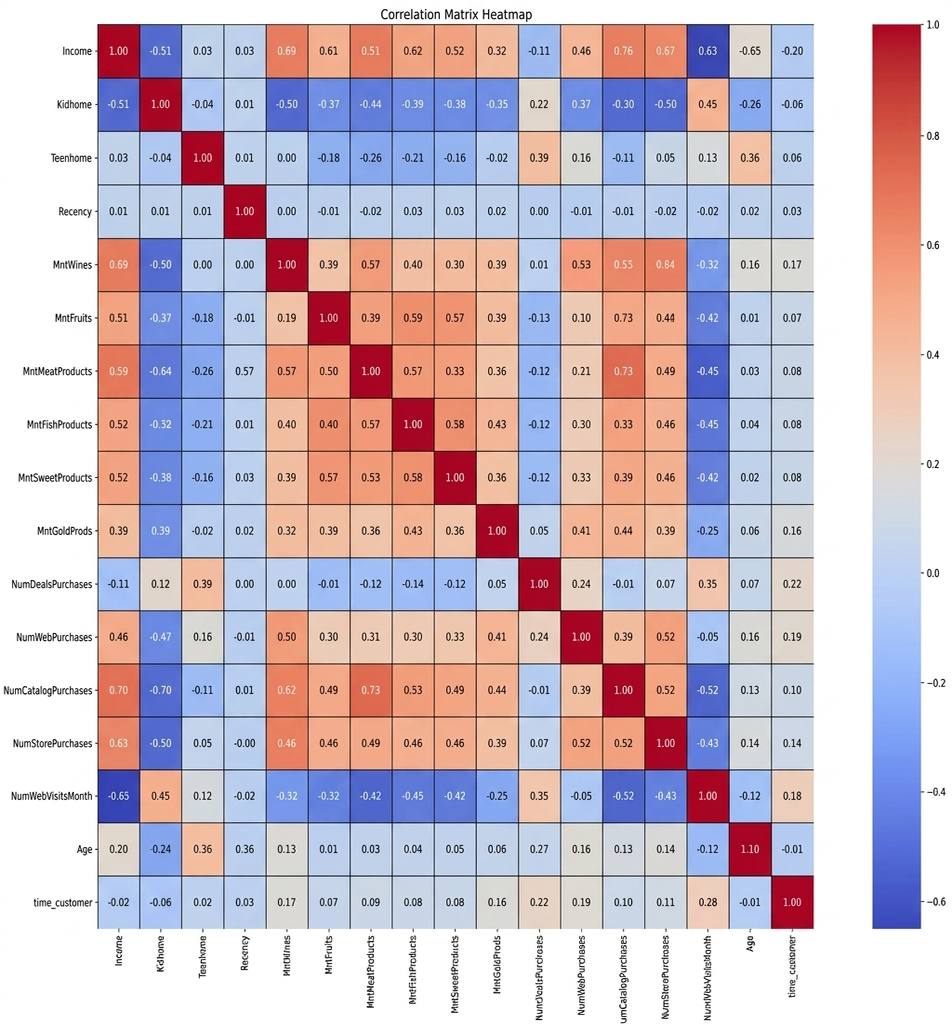
Data preprocessing was performed using the Python programming language and the Pandas, Numpy, Matplotlib, and Seaborn libraries. 24 observations with missing values for the “Income” variable were excluded. The variables “AcceptedCmp1” to “AcceptedCmp5”, “Z_CostContact”, “Z_Revenue”, “Response”, and “Complain” were removed as they did not add relevant information for segmentation. Outliers were identified and removed from the “Income” (1 individual) and “Year_Birth” (3 individuals) variables. The “Year_Birth” variable was transformed into “Age” (by subtracting the birth year from 2014, the reference year of the last customer record) and the “Dt_Customer” variable was converted into “time_customer” (consecutive days since the most recent date), with the original variables being excluded. Categorical variables were also excluded to ensure compatibility with standardization and cluster formation. The remaining 17 numerical variables, which included behavioral and demographic information, were scaled using the Z-score method (“Standard Scaler”). Correlation analysis between these variables was performed to identify redundancies (Figure 3). The suitability of the data for dimensionality reduction was confirmed by the Kaiser-Meyer-Olkin (KMO = 0.882; p < 0.05) and Bartlett’s Test of Sphericity (p = 0.0000) tests.
Figure 3. Heatmap of the correlation matrix between dataset variables
Source: Original survey data
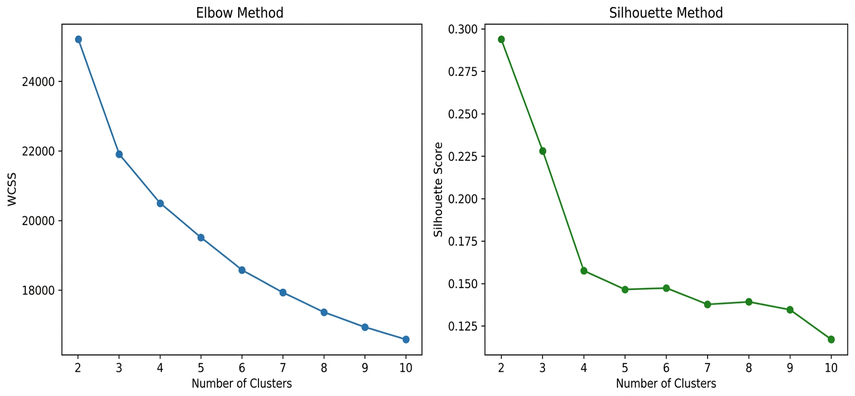
In the algorithm’s development, Principal Component Analysis (PCA) was applied, which reduced the 17 variables to 14 components, maintaining 96.28% of the explained variance from the original data structure. To pre-determine the optimal number of clusters, the elbow method (“Elbow”) was used to measure intra-cluster inertia, and the silhouette method (“Silhouette Score”) was used to evaluate the quality of group separation. Tests indicated 3 and 2 clusters, respectively (Figure 4), and 3 clusters were chosen to allow for a more detailed identification of behavioral profiles without generating artificial separation.
Figure 4. Optimal number of clusters check – “Elbow” (blue) and “Silhouette” (green)
Source: Original survey data
For the analysis of the formed clusters, the influence of each variable on the grouping formation was evaluated through Analysis of Variance (ANOVA) applied to the non-standardized data. The F-value was used as an indicator of the discrimination of variables between clusters, and the effect size (η²) to quantify the magnitude of this difference.
3. Results and Discussion
The analysis of the dataset revealed the feasibility of segmenting customers and identifying specific behaviors that can assist in directing marketing campaigns. This study demonstrated the application of unsupervised machine learning techniques, focusing on the K-Means algorithm, to group consumers based on demographic and behavioral characteristics. The preprocessing, dimensionality reduction, and validation steps were crucial for building distinct and consistent consumption profiles, providing a solid foundation for the interpretation of the findings.
The initial stage of data analysis and preparation involved exploring the raw data to identify its structure, variable distribution, and the presence of outliers or inconsistencies. Continuous numerical variables such as “Income”, “Recency”, and “MntWines” were examined for their distribution and the need for normalization. Visualizing these distributions, as illustrated in the histograms of Figure 5, allowed for an understanding of the differentiated magnitude of each category and the presence of long tails, indicating the need for standardization before applying clustering algorithms.
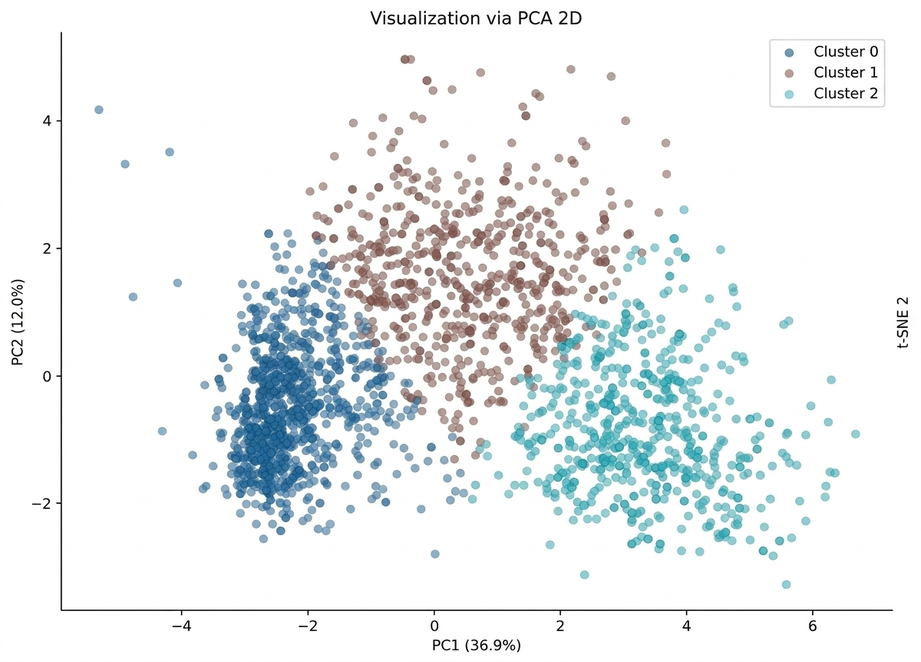
Figure 5. 2D visualization of clustering using Principal Component Analysis (PCA)
Source: Original survey data
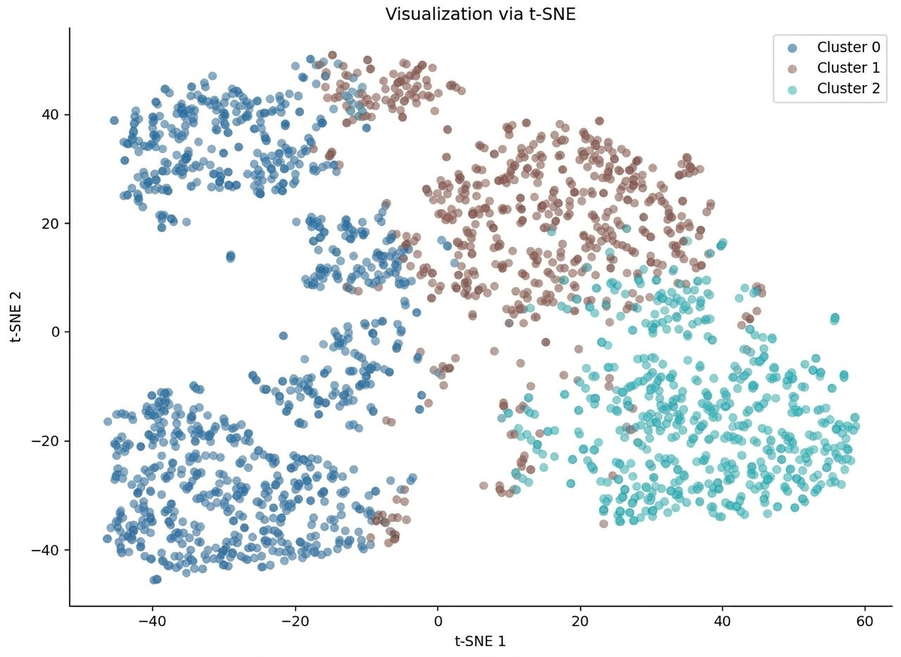
Complementary to PCA, a second 2D representation of the data was created with “t Distributed Stochastic Neighbor Embedding” (t-SNE) with the objective of observing the preservation of the relationship between local points and verifying the consistency of the segmentation
proposed by “K-Means” and more defined “clusters”, having information about the diversity within the larger groups (Figure 6).
Figure 6. Visualization of the clustering using the “t-Distributed Stochastic Neighbor Embedding” (t-SNE) technique
Source: Original survey data
Cluster profile analysis and segmentation strategy
In this work, the original dataset was treated to identify consumer profiles based on consumption patterns and family structure. After treatment, scaling, dimensional reduction, choice of the number of groups, application of K-Means, and statistical analysis, three main groupings were identified: cluster 0, named Economic Customers; cluster 1, Moderate Customers; and cluster 2, Elite Customers.
The analysis reinforced the relevance of segmentation for marketing, especially in retail, e-commerce, and bookstore contexts, where K-Means is widely used to support campaign targeting (Farhan et al., 2024; Tabianan et al., 2022). The preprocessing steps contributed to a more coherent separation of groups, an aspect also observed in studies on clustering optimization and the use of hybrid approaches associated with K-Means (Juhari et al., 2022; Mulyono et al., 2023; Wang, 2025).
Although the clustering used only K-Means, the separation of clusters based on purchasing behavior, income, and family structure proved consistent with the literature. Studies indicate that income, food spending, consumption of higher-value items, and interaction through purchasing channels are relevant variables for characterizing consumer profiles and identifying segments of higher economic value, such as premium customers (Reutterer and Dan, 2019; Tavor et al., 2023; Song, 2025; Thach and Olsen, 2015).
Besides K-Means, the study associated PCA and t-SNE to support the visualization of clusters and refine the identification of possible subgroups. These strategies contribute to mapping less evident consumption trends, favoring a more detailed reading of behavioral patterns, as also observed in research focused on e-commerce and digital marketing (Khan et al., 2023).
Literature shows that machine learning-based segmentation can support more targeted campaigns, reduce budget waste, and improve the suitability of products and services for distinct audiences (Clarke et al., 2024; Dolnikar et al., 2013; Cortez et al., 2021). Studies in sectors such as banking, fashion, and retail also indicate an association between segmentation, customer satisfaction, profitability, and increased sales (Francis Osei et al., 2021; Nurpazi et al., 2024; Fahed Yoseph et al., 2020).
In this context, the proposed protocol favors analytical and strategic improvements by allowing automated processing of large data volumes, identification of consumption patterns, and definition of more precise groups. The comparison presented in Table 2 summarizes the expected gains in four dimensions: segmentation accuracy, campaign personalization, reduction of analysis time, and process scalability.
Table 2. Comparison of the main parameters for the application of the proposed model
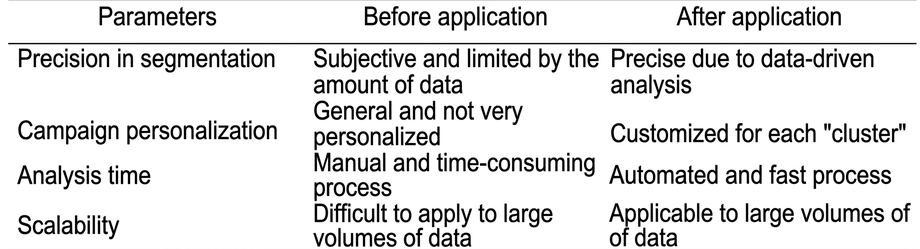
Therefore, the implementation of the clustering protocol contributes to making campaign development more efficient and targeted. By segmenting customers by socioeconomic, behavioral, gender, and age profiles, the model supports data-driven marketing decisions and enables greater personalization of strategies for each cluster.
4. Conclusion
The present study sought to develop a data analysis protocol to guide marketing strategies, using consumer segmentation through unsupervised machine learning, based on demographic and behavioral variables. To this end, the K-Means algorithm was implemented, after rigorous preprocessing of the dataset which included variable treatment, missing data exclusion, scaling, standardization, and dimensionality reduction by Principal Component Analysis. The formation of three consumer clusters was verified, whose robustness and consistency were validated by two-dimensional visualization techniques. The profile of Economic Customers was identified, characterized by being younger, with lower income and consumption, and a higher number of children. Moderate Customers presented a higher age, balanced income and consumption. In turn, Elite Customers stood out for their high income, high consumption of sophisticated products, and fewer children. Income was the attribute with the greatest discriminatory power among the clusters, followed by meat spending and the number of catalog purchases. The main contribution of this work lies in demonstrating that the application of a data analysis protocol based on machine learning significantly optimizes the performance and reach of marketing initiatives, by allowing for more precise and personalized market segmentation.
The implemented analysis protocol demonstrated significant improvements compared to traditional approaches, by enhancing segmentation accuracy, enabling campaign personalization, reducing analysis time, and providing scalability for large data volumes. This data-driven approach allows marketing strategies to be more assertive and efficient, avoiding budgetary waste. However, the use of a single database is recognized as a limitation of this study. For future research, it is suggested to apply this analysis protocol to real-world case datasets, including the measurement of campaign response and revenue generated for the client, in order to further validate its effectiveness and applicability in different market contexts.
Bibliographic References
Cortez, R.; Clarke, A.; Freytag, P.. 2021. B2B market segmentation: a systematic review and research Journal of Business
https://doi.org/10.1016/j.jbusres.2020.12.070.
DataReportal. 2025. Digital 2025: Global Overview Report. Disponível em: https://datareportal.com/reports/digital-2025-global-overview-report. Acesso em: 09 mar. 2025.
Kotler, P.. 1999. Marketing para o século XXI: como criar, conquistar e dominar mercados. São Paulo: Futura, 1999.
Kotler, P.; Keller, K. L.. 2012. Administração de Marketing. 14ed. Pearson Education do Brasil. São Paulo, SP, Brasil.
Lopes, I.J. 2005. A Segmentação de Mercado como Estratégia de Marketing. Geo Cities. Disponível em: http://www.geocities.com/Eureka/2471/segmerca.html. Acesso em: 23 mar. 2025.
Shirole R, Salokhe L., Jadhav S. 2021. Customer Segmentation using RFM Model and “K-Means” Clustering. International Journal of Scientific Research in Science and Technology 8 (3), 591-597.
Smith, W.R. 1956. Product Differentiation and Market Segmentation as Alternative Marketing Strategies. Journal of Marketing, 21(1), 3-8.
Toledo, G. L. 1972. Segmentação de mercado e estratégia de marketing. Tese de Doutorado em Administração de Empresas. Faculdade de Economia, Administração e Contabilidade, Universidade de São Paulo, SP, Brasil.
Article originating from the Course Conclusion Work of the Specialization in Data Science and Analytics of the MBA USP/Esalq
To learn more about the course, click here and access the MBX Academy platform