
September 15, 2026
Nowcasting and Return and Risk Forecast of the Tesouro Direto Ipca+ by Market Regime
Gledson Duarte da Silva; William Barbosa
DOI: 10.22167/2675-6528-202602223
Article derived from a Final Course Work (TCC), with content based on the student’s original work and adapted to the editorial format of the Revista E&S with the support of the ResumeAI tool, an artificial intelligence solution developed by the Pecege Institute for textual synthesis and organization.
Summary
The growing participation of investors in Tesouro Direto and the sensitivity of inflation-indexed bonds to interest rates, expectations, and regime changes make short-term forecasting of their price and risk movements relevant. The study aimed to estimate and evaluate nowcasting models for the return and risk of Tesouro Direto bonds, focusing on Tesouro IPCA+, considering different market arrangements and seeking evidence on how inflationary shocks, expectations, and regimes affect prices and profitability. To this end, a database was built with prices and rates from Tesouro Transparente, Selic, and IPCA from the Central Bank, using ANBIMA curves as an auxiliary source due to limited historical coverage. Daily logarithmic return, realized volatility over 21 trading days, five-fold temporal validation, comparison between LightGBM and a persistence model, and descriptive use of HMM with two states were employed. The results showed that the return at t+1 oscillated around zero and admitted moderate predictive gain with LightGBM, which outperformed the benchmark model. The risk at t+1 exhibited strong persistence, being better predicted by repeating the most recent value. The findings indicated that return and risk require distinct treatments and that the temporal heterogeneity of the sample is relevant for the economic interpretation of Tesouro IPCA+. The limited coverage of ANBIMA curves restricted the broader incorporation of the interest rate term structure into the main predictive block.
Keywords: Gradient boosting; Hidden Markov Models; Implied inflation; Selic rate; Realized volatility.
1. Introduction
Tesouro Direto was established in January 2002 through a partnership between the National Treasury and the Brazilian Clearing and Depository Company (CBLC), currently B3, marking a significant transformation in retail investor access to the public debt market. Before this initiative, the trading of public securities was restricted to large financial institutions and investment funds. The creation of this platform allowed individuals to invest directly in government bonds, eliminating part of the intermediation and reducing transaction costs (Ferreira, 2015). For the government, the program has consolidated itself as an important mechanism for domestic resource mobilization and an instrument of monetary policy (Perlin, 2016).
For the individual investor, Tesouro Direto opened the possibility of accessing fixed-income assets with different remuneration structures, from fixed rates to post-fixed modalities, linked to the basic interest rate (Selic) and indicators such as the Broad Consumer Price Index (IPCA) (Ferreira, 2015). This diversity expands the range of investment strategies, catering to conservative profiles and those seeking inflation protection. In particular, Tesouro IPCA+, which combines a fixed part with inflation adjustment, guarantees the maintenance of purchasing power over time. However, this type of bond is subject to mark-to-market fluctuations, with its value potentially oscillating substantially depending on inflation expectations and current market interest rates (Portal do Investidor [GOV], 2022).
The dynamics between interest rates, inflation behavior, and negotiations in Tesouro Direto reveal important aspects of this market’s microstructure. During periods of Selic rate hikes, as observed in the monetary tightening cycles of 2021-2022 (Banco Central do Brasil [BACEN], 2022), the increase in public debt yields attracts greater demand for post-fixed securities linked to the Selic rate. Comparatively, the appreciation of inflation-indexed bonds, such as Tesouro IPCA+, becomes less significant in the short term due to the increased opportunity cost, although they maintain their appeal as a real store of value during periods of inflationary pressure (Júnior and Tavares, 2024). Inflation in Brazil is historically unstable and subject to domestic and external frictions (Minella et al., 2003), and studies indicate that Brazilian inflationary persistence is high, prolonging disturbances and accentuating risks for investors in inflation-corrected bonds (Silva and Leme, 2008).
The recognition of these distinct market configurations is essential for understanding the fluctuations in the return and risk of Tesouro Direto bonds, directly impacting investor behavior and the pricing of public securities. Tesouro Direto has shown consistent growth in participation, volume, and stock, reinforcing the practical relevance of analyses like this. In December 2024, the number of active investors reached 3,013,921 people, and the program’s bond accumulation closed at R$156.9 billion (Tesouro Nacional [GOV], 2025). In July 2025, the reserve exceeded R$185.7 billion, with inflation-indexed bonds representing approximately 51.2% of this amount (Ministério da Fazenda [GOV], 2025).
In this scenario, short-term forecasting of price and risk movements for inflation-indexed bonds becomes relevant. The concept of nowcasting refers to the immediate update of the estimate for the bond’s next movement (Bańbura, Giannone, and Reichlin, 2010; Corsi, 2009). In mark-to-market assets, new information about interest rates, inflation, and real premiums can rapidly alter price and risk. To address this complexity, modeling can incorporate the idea of market regimes, which represent distinct contexts of return and risk, and can be explored through models such as Hidden Markov Models (Hamilton, 1989; Rabiner, 1989). Furthermore, machine learning techniques, such as LightGBM, are suitable for combining past information non-linearly and generating forecasts (Ke et al., 2017).
The increased participation of investors in Tesouro Direto and the sensitivity of inflation-indexed bonds to interest rates, expectations, and regime changes make short-term forecasting of their price and risk movements relevant. There is a gap in the in-depth understanding of how inflationary shocks, market expectations, and regime changes affect the prices and profitability of these bonds, which justifies the need for tools that enable more informed decisions in volatile economic environments for investors and managers. Thus, this work aims to estimate and evaluate nowcasting models applied to the forecasting of return and risk of Tesouro Direto bonds, focusing on Tesouro IPCA+, considering different market arrangements and seeking evidence on how inflationary shocks, expectations, and regimes affect prices and profitability.
2. Material and Methods
The study is characterized as applied research, quantitative in nature, formulated as a one-step-ahead forecasting problem, using the information available at each date t to estimate what would happen on the next business day (t + 1).
The database was built from official public sources, with daily price and rate history obtained from Tesouro Transparente (2026), reflecting the secondary market for federal public bonds. The study focused on the Tesouro IPCA+ without semi-annual coupons, selecting the bond with the highest coverage and maturity on May 15, 2035, to avoid automatic price changes.
Macroeconomic series, such as daily Selic (series 11) and monthly IPCA (series 433), were obtained from the Central Bank of Brazil [BACEN] Time Series Management System [SGS]. The raw data period was from March 8, 2010, to January 30, 2026. The monthly IPCA was aligned to the daily calendar, and the 12-month accumulated inflation was constructed. Data from the Brazilian Financial and Capital Markets Association [ANBIMA] on the term structure of interest rates were used as an auxiliary source, but their limited coverage (January 28, 2026, to February 4, 2026) prevented their use in the main predictive comparison.
The construction of the targets followed the literature on “nowcasting” and volatility modeling (Bańbura, Giannone and Reichlin, 2010; Corsi, 2009). General equations for return, risk, and targets at t+1 (1):
RET₁ = In (PU) – In (PUt-1)
where: PUţ: is the observed unit price at t; RETț: is the daily logarithmic return.
RISK₁ = $\frac{{1}{n-1} \sum_{i=0}^{n-1} (RET_{t-i} – \overline{RET_n})^2$
where: RISK₁: is the realized volatility in a rolling window of n trading days; RET: is the average of returns in the window of size n; i: indexes the observations of the rolling window.
RETF1.t = RETt+1
where: RETF1,t: projection of the return at t + 1.
RISK1,t = RISKt+1
where: RISCOF1,ť: projection of risk at t + 1.
Eq. (1.0) defines the daily stock return on a logarithmic scale. Eq. (1.1) defines risk as a measure of recent oscillation calculated from the last 21 trading days, which serves as a monthly approximation of price instability. Eq. (1.2) and eq. (1.3) simply shift these series by one day to create the forecast targets.
The supervised block was estimated using LightGBM, a machine learning method for tabular data that combines past information in a non-linear way (Ke et al., 2017). Conceptual approach of the supervised block (2):
Xt = [Z1,t-l1, Z2,t-l2,………,Zk,t-lk]
where: x₁: represents the vector of attributes available at time t, formed by financial and macroeconomic lags.
ŷt = F(xt) = $\sum_{m=1}^{M} v f_m(x_t)$
where: ŷť: represents the target prediction at time t; F (xī): represents the estimated predictive function; M: represents the total number of trees; v: represents the learning rate; fm(xt): represents the m-th interaction tree.
The regime block was modeled separately by a Gaussian Hidden Markov Model [HMM] with two states, used for descriptive characterization of the sample and not as a central input for predictive comparison (Hamilton, 1989; Rabiner, 1989). The conceptualization of the regime block is summarized in equations (3.0) through (3.3). Conceptual approach of the two-state Gaussian HMM (3):
St ∈ {1, 2}
where: St: represents the hidden state at instant t.
P(St = j St-1 = i) = Pij, i,j∈ {1, 2}
where:pij: represents the transition probability from state i to state j.
Yt = [RETD,t, RISCOD,t]
where: yt: represents the observed vector of return and risk.
yt|St = s ~ Ν(μς,Σς)
where: μs represents the mean; ∑5: represents the covariance matrix of state s.
Table 1 summarizes the central variables of the consolidated “dataset”.
Table 1. Definition of variables
| Variable | Operational definition | Source | Variable Type |
|---|---|---|---|
| PU | Daily unit price of the selected Treasury IPCA+ | Transparent Treasury | numerical explanatory |
| IPCA RATE | Daily selling rate of the selected security | Transparent Treasury | numerical explanatory |
| RET_D | Daily logarithmic return of the unit price | Derivative of PU | numerical explanatory |
| RISK_D | Realized volatility in 21 trading days of RET_D | Derivative of RET_D | numerical explanatory |
| SELIC | Daily Selic rate, SGS series 11 | SGS/BACEN | numerical explanatory |
| D_SELIC_1 | Daily variation of the Selic | SELIC Derivative | numerical explanatory |
| D_SELIC_5 | 5-day accumulated variation of the Selic | SELIC Derivative | numerical explanatory |
| IPCA | Monthly IPCA, SGS 433 series, aligned with the daily calendar | SGS/BACEN | numerical explanatory |
| IPCA_12M | 12-month accumulated inflation | IPCA Derivative | numerical explanatory |
| RET_F1 | Target for return at t+1 | Time shift derivative | numerical dependent |
| RISK_F1 | T+1 risk target | Time shift derivative | numerical dependent |
Source: Original survey data
The daily return was calculated on a logarithmic scale. Risk was measured by realized volatility in a 21-trading-day rolling window. The RET_F1 and RISCO_F1 targets were obtained by shifting one position forward (‘shift(-1)’), aiming to predict the next business day based on current information (Corsi, 2009; Bańbura et al., 2010).
The predictors for the supervised block included past values (lags 1, 2, and 5) of RET_D, RISCO_D, SELIC, D_SELIC_1, D_SELIC_5, and TAXA_IPCA, in addition to contemporaneous IPCA and IPCA_12M. The monthly IPCA was aligned to the daily calendar using ‘merge_asof’ with direction ‘backward’ (Júnior and Tavares, 2024).
The HMM was adjusted using standardized RET_D and RISCO_D, with two states, up to 250 iterations, tolerance of 10-4, and seven restarts, selecting the model with the highest log-likelihood (Hamilton, 1989; Rabiner, 1989).
The main predictive block, based on LightGBM, used ‘n_estimators = 400’, moderate regularization, and ‘force_col_wise = True’. ‘Early stopping’ was applied during training. For RISCO_F1, the adjustment was performed on the log1p scale, and the final prediction returned to the original scale by expm1 (Ke et al., 2017; Hyndman and Athanasopoulos, 2021).
External validation was performed with ‘TimeSeriesSplit’ in five folds, with ‘gap = 1’ and dynamic test size (maximum between 120 observations and one sixth of the useful sample). The evaluation period was from April 14, 2010, to January 29, 2026 (Hyndman and Athanasopoulos, 2021). Table 2 summarizes this chronological distribution.
Table 2. Chronological distribution of temporal validation folds
| Fold | Training until | Test start | End of test |
|---|---|---|---|
| 1 | 2012-11-29 | 2012-12-03 | 2015-07-16 |
| 2 | 2015-07-15 | 2015-07-17 | 2018-03-07 |
| 3 | 2018-03-06 | 2018-03-08 | 2020-10-22 |
| 4 | 2020-10-21 | 2020-10-23 | 2023-06-15 |
| 5 | 2023-06-14 | 2023-06-16 | 2026-01-29 |
Source: Original survey data
The evaluation metrics employed were the Mean Absolute Error (MAE) and the Root Mean Squared Error (RMSE), which allow for the assessment of predictive performance (Hodson, 2022). Equations for the MAE and RMSE metrics (4):
MAE = $\frac{{1}{n} \sum_{i=1}^{n} |y_i – \hat{y}_i|$
RMSE = $\sqrt{\frac{{1}{n} \sum_{i=1}^{n} (y_i – \hat{y}_i)^2}$
where: y₁: represents the observed value in observation i; ŷ¡: represents the value in observation i; n: represents the total number of evaluated observations.
3. Results and Discussion
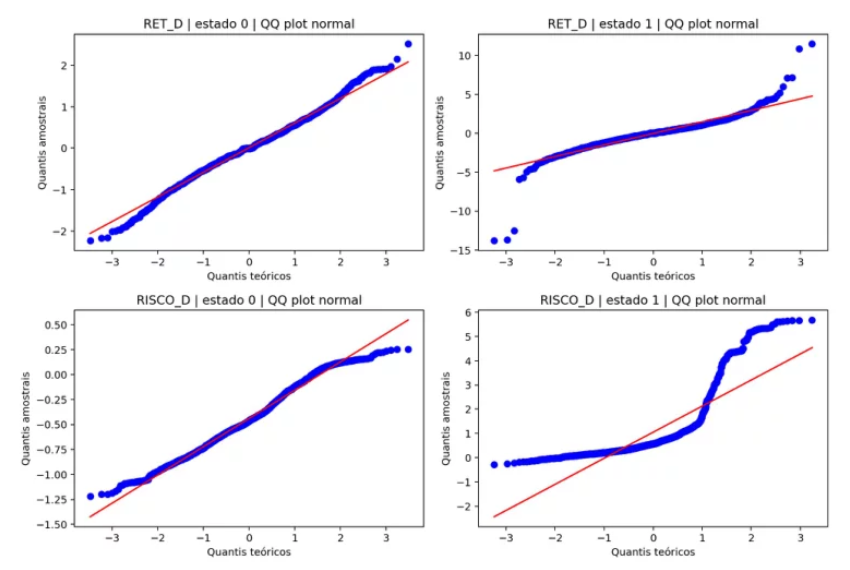
The descriptive analysis of the return (RET_D) and risk (RISCO_D) distributions in each inferred state, presented in Figure 1, revealed approximate compatibility with the normality hypothesis for some configurations. However, the normal probability plots (Figure 2) indicated systematic deviations, suggesting skewness or heavier tails, especially for risk. These findings are descriptive and complementary, without replacing formal normality tests (National Institute of Standards and Technology, 2026).
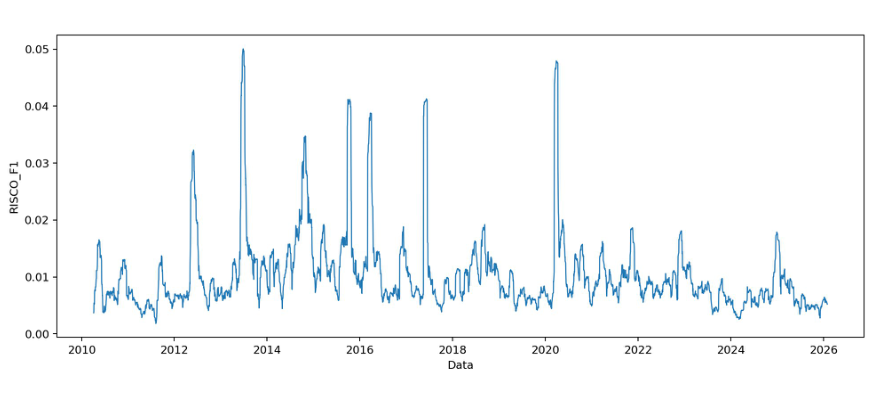
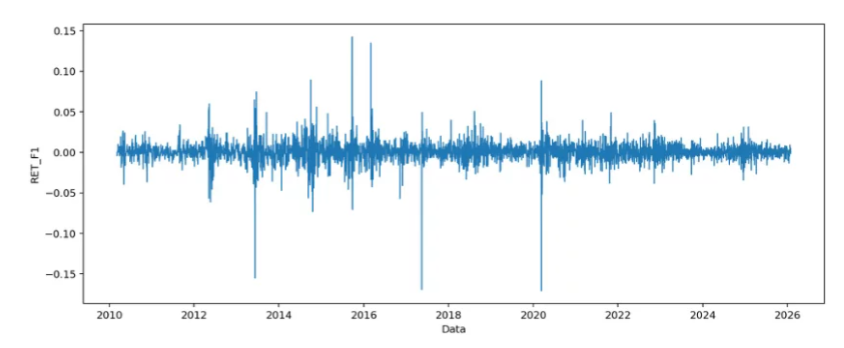
The t+1 return trajectory (RET_F1) showed oscillations around zero throughout the sample, without a clear repetitive pattern, indicating daily instability and strong influence of repricing (Figure 3). In contrast, the t+1 risk dynamics (RISCO_F1) exhibited blocks of higher and lower instability, suggesting stronger short-term continuity (Figure 4). The maximum value of RET_F1 was 0.142691 on 2015-09-24, and the minimum -0.170763 on 2020-03-11. For RISCO_F1, the maximum was 0.050059 on 2013-06-26, and the minimum 0.001813 on 2011-08-09.
Figure 1: Histograms by state with adjusted normal curve
Source: Original survey data
Figure 2: QQ plots by state for RET_D and RISCO_D
Source: Original survey data
Figure 3: Daily return at t+1 out-of-sample
Source: Original survey data
Figure 4: Daily risk at t+1 over the sample
Source: Original survey data
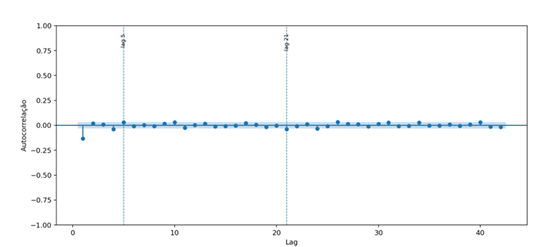
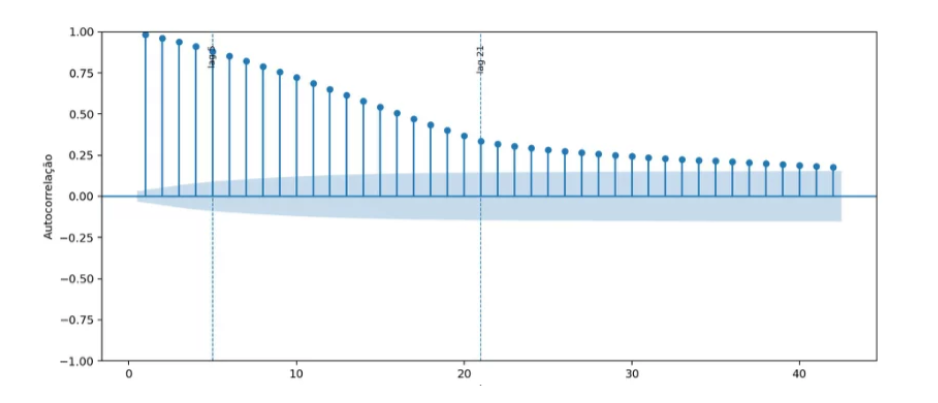
The analysis of the autocorrelation function (ACF) confirmed these differences. For RET_F1, the autocorrelation coefficients were small and without slow decay (Figure 5), although the Ljung Box test still rejected the null hypothesis of white noise (p-value of 1.81 * 10-12), indicating some residual temporal dependence. For RISCO_F1, the ACF showed very high values in the first lags (p1 = 0.983, ρ5 = 0.883, p10 = 0.723, and p21 = 0.337), decreasing gradually (Figure 6). This is consistent with volatility clustering and suggests that periods of instability tend to persist (Hyndman and Athanasopoulos, 2021; Ljung and Box, 1978).
Figure 5: Autocorrelation of return at t+1
Source: Original survey data
Figure 6: Autocorrelation of risk at t+1
Source: Original survey data
The sample heterogeneity was synthesized by descriptive statistics, as in Table 3. The unit price (PU) ranged between 402.270000 and 2389.690000, and the bond rate (TAXA_IPCA) oscillated between 3.010000 and 7.990000. Macroeconomic variables such as monthly IPCA (-0.680000 to 1.620000) and accumulated IPCA over 12 months (1.877488 to 12.131481) also showed significant amplitudes, reflecting distinct monetary and inflationary periods.
Table 3. Definition of the variables
| Variable | Minimum | Maximum | Average | Standard Deviation | Observations |
|---|---|---|---|---|---|
| PU | 402,270000 | 2389,690000 | 1338,066352 | 637,209710 | 3967 |
| IPCA RATE | 3,010000 | 7,990000 | 5,673426 | 1,048831 | 3967 |
| RET_F1 | -0,170763 | 0,142691 | 0,000443 | 0,012394 | 3966 |
| RISK_F1 | 0,001813 | 0,050059 | 0,010338 | 0,006998 | 3946 |
| SELIC | 0,007469 | 0,055131 | 0,037129 | 0,013054 | 3967 |
| D_SELIC_1 | -0,003653 | 0,005569 | 0,000006 | 0,000342 | 3966 |
| D_SELIC_5 | -0,003653 | 0,005569 | 0,000028 | 0,000765 | 3962 |
| IPCA | -0,680000 | 1,620000 | 0,460401 | 0,358207 | 3967 |
| IPCA_12M | 1,877488 | 12,131481 | 5,824383 | 2,264401 | 3967 |
Source: Original survey data
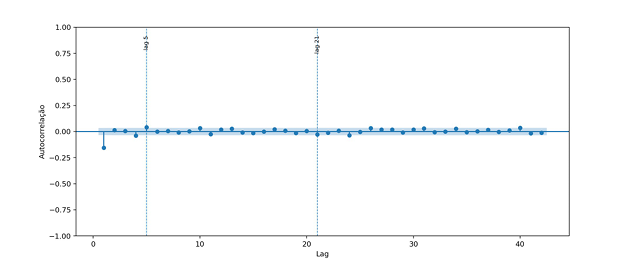
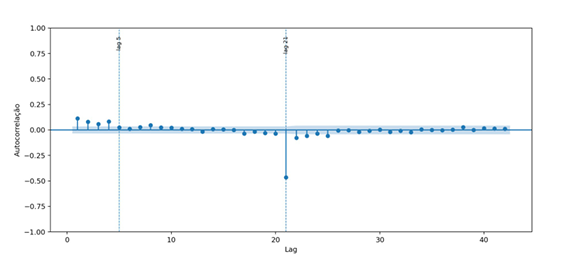
The ACF analysis of the out-of-sample errors indicated that, for RET_F1, most autocorrelations approached zero, but lag 1 was negative and the Ljung Box test remained significant (p-value of 2.04 * 10-13), suggesting very short-term residual dependence (Figure 7). For RISCO_F1, the residuals also rejected white noise (p-value of 7.31 * 10-165), with a negative peak at lag 21, which is more compatible with the construction of the risk measure than with economic seasonality (Figure 8).
Figure 7: Out-of-sample autocorrelation of RET_F1 residuals
Source: Original survey data
Figure 8: Out-of-sample autocorrelation of RISC_F1
Source: Original survey data
The comparison of training and testing metrics (Table 4) and the paired check on the test folds (Table 5) revealed distinct predictive performances for the targets. For RET_F1, LightGBM outperformed the reference model (persistence baseline) in training and testing, with MAE of 0.008081 and RMSE of 0.012398 on average across the folds. For RISCO_F1, the reference model was superior, with MAE of 0.000436 and RMSE of 0.001227. This indicates that the daily return may benefit from the combination of past information, while the very short-term risk is better described by the continuity of the series.
Table 4. Train and test metrics by model
| Goal | Model | MAE training | RMSE train | MAE test | RMSE test |
|---|---|---|---|---|---|
| RET_F1 | LightGBM | 0.007830 | 0.012665 | 0.008081 | 0.012398 |
| RET_F1 | Persistence baseline | 0.011477 | 0.018970 | 0.012130 | 0.018903 |
| RISK_F1 | Persistence baseline | 0.000450 | 0.001251 | 0.000436 | 0.001227 |
| RISK_F1 | LightGBM | 0.001144 | 0.002363 | 0.001732 | 0.003432 |
Source: Original survey data
Table 5. Paired comparison for RET_F1 and RISK_F1 in the test folds
| Goal | Model | MAE | RMSE | Observation |
|---|---|---|---|---|
| RET_F1 | LightGBM | 0,008081 | 0,012888 | 3280 |
| RET_F1 | Persistence baseline | 0,012130 | 0,019588 | 3280 |
| RISK_F1 | Persistence baseline | 0,000436 | 0,001379 | 3280 |
| RISK_F1 | LightGBM | 0,001732 | 0,004265 | 3280 |
Source: Original survey data
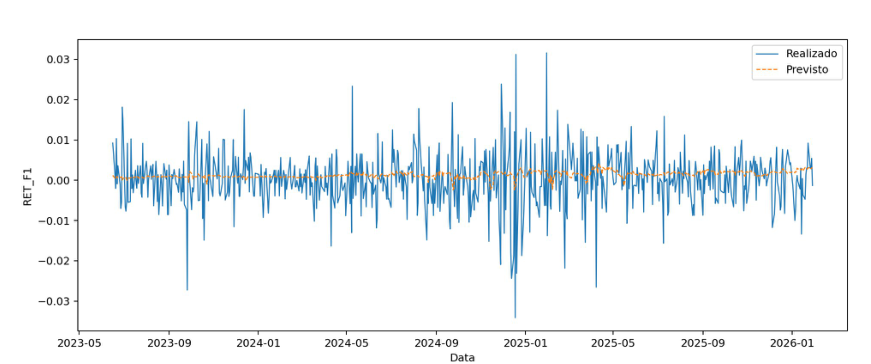
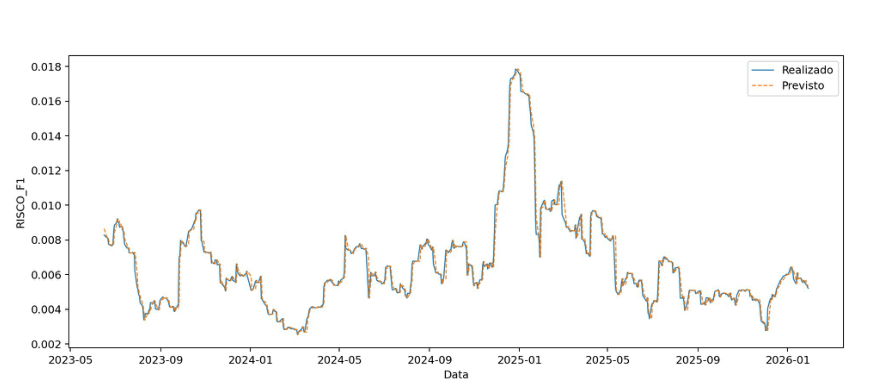
The comparison between observed and predicted values in the last test period (Figure 9) showed that LightGBM followed the local direction of RET_F1 oscillations better than the naive benchmark, despite deviations in abrupt changes. For RISCO_F1, persistence reproduced the current level of the series more closely, consistent with the observed continuity (Figure 10).
Figure 9: Observed and predicted values of RET_F1 in the last test
Source: Original survey data
Figure 10: Observed and predicted values of RISK_F1 in the last test
Source: Original survey data
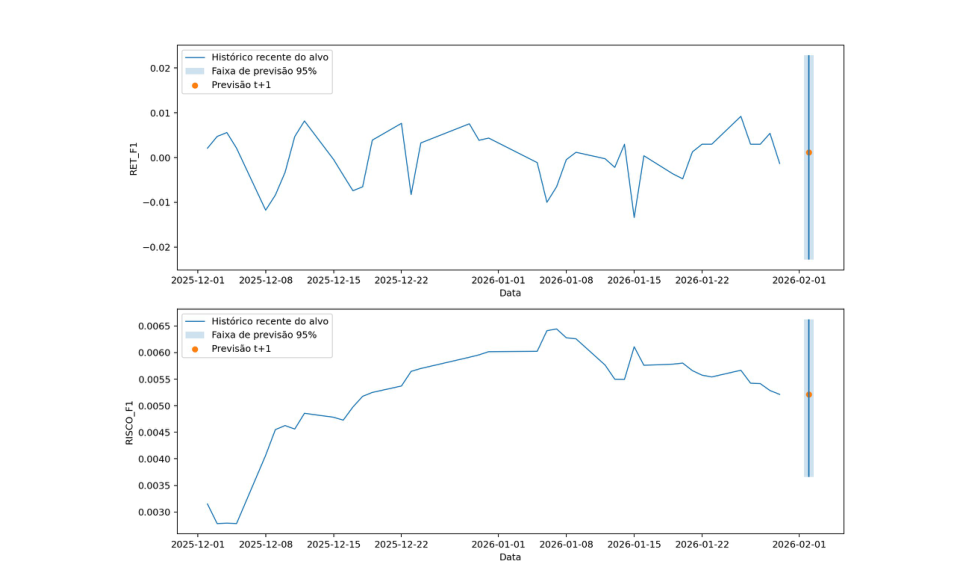
The final nowcast at t+1, based on the best validated model, was generated with information available on Jan. 30, 2026 for Feb. 02, 2026 (Table 7). For RET_F1, LightGBM predicted 0.001175, with a 95% empirical range between -0.022796 and 0.022847. For RISCO_F1, the persistence model predicted 0.005213, with a range between 0.003661 and 0.006626. The narrower band for risk reinforces its greater temporal continuity (Figure 11; Hyndman and Athanasopoulos, 2021).
Figure 11: t+1 return and risk Nowcast with 95% interval
Source: Original survey data
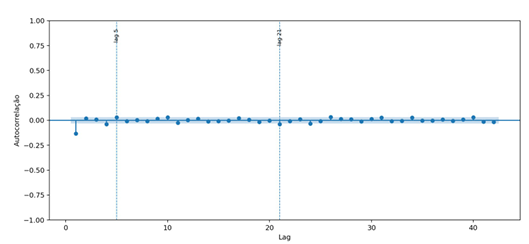
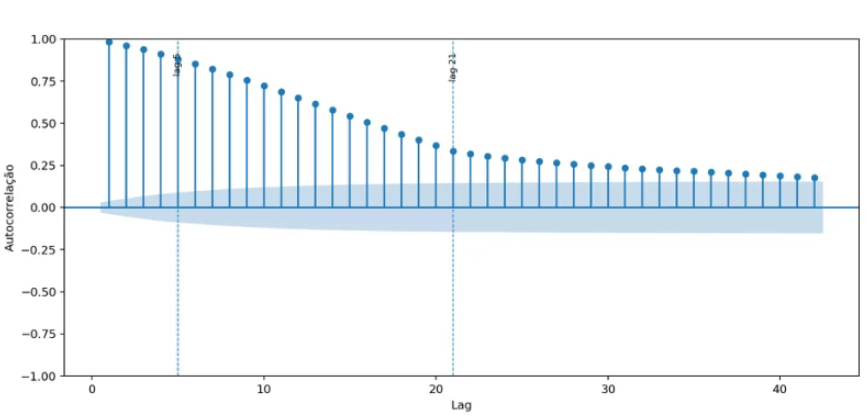
The re-presentation of the autocorrelation of the targets (Figure 12 for RET_F1 and Figure 13 for RISCO_F1) reinforced the structural difference between return and risk, with today’s risk carrying more information about tomorrow’s risk than today’s return about tomorrow’s return (Hyndman and Athanasopoulos, 2021; Ljung and Box, 1978).
Figure 12: Autocorrelation of return at t+1
Source: Original survey data
Figure 13: Autocorrelation of risk at t+1
Source: Original survey data
The fitted Hidden Markov Model (HMM) identified two persistent states in the sample, with high probabilities of remaining in the same state daily (p00 = 0.988733 and p11 = 0.973141), as per Table 6. This suggests the existence of distinct market contexts over time (Hamilton, 1989; Rabiner, 1989). However, the HMM was primarily used as a descriptive tool, given the limited coverage of ANBIMA’s term structure of interest rates (TSIR) data, which prevented its central incorporation into the predictive block.
Table 6. HMM in full sample
| Measure | Result |
|---|---|
| State Counting | {“0”: 2782, “1”: 1164} |
| Final log-likelihood | -7327,915014 |
| p00 | 0,988733 |
| p01 | 0,011267 |
| p10 | 0,026859 |
| p11 | 0,973141 |
Source: Original survey data
Table 7. Final nowcast at t+1 with 95% empirical interval
| Goal | database t | Forecast date t+1 | Model | Point Forecast | Lower bound 95% | Upper limit 95% |
|---|---|---|---|---|---|---|
| RET_F1 | 2026-01-30 | 2026-02-02 | LightGBM | 0,001175 | -0,022796 | 0,022847 |
| RISK_F1 | 2026-01-30 | 2026-02-02 | Persistence baseline | 0,005213 | 0,003661 | 0,006626 |
Source: Original survey data
The results demonstrate a clear distinction between the daily return of the Tesouro IPCA+ and its risk. The return, which reacts to price revisions and unexpected shocks, allows for a moderate predictive gain with more flexible models like LightGBM. In contrast, the risk, built on a rolling window, exhibits strong temporal continuity, being better predicted by a simple persistence rule. The temporal heterogeneity of the sample, evidenced by the two regimes identified by the HMM, is relevant for economic interpretation, indicating that the market does not behave homogeneously over time. Although inflationary dynamics and risk persistence are important, the historical limitation of ANBIMA curves restricted the broader incorporation of the term structure of interest rates into the main predictive model.
In summary, the study indicated that the daily return of Tesouro IPCA+ exhibits low persistence and can be moderately predicted by machine learning models, while the very short-term risk demonstrates high persistence and is better estimated by repeating the most recent value. This distinction highlights the need for differentiated predictive approaches for each target, providing an objective basis for decisions in volatile market environments.
4. Conclusion
The study sought to estimate and evaluate nowcasting models for the return and risk of IPCA+ Treasury bonds, considering market arrangements and the influence of inflationary shocks, expectations, and regimes on prices and profitability. It was found that the daily return of the IPCA+ Treasury oscillated around zero, admitting a moderate predictive gain with the LightGBM model, which surpassed the persistence benchmark. In contrast, the risk at t+1 exhibited strong persistence, being better predicted by the simple repetition of the most recent value. This distinction highlighted the need for differentiated predictive approaches for each target. It was also observed that the temporal heterogeneity of the sample, evidenced by two regimes identified by a Hidden Markov Model, is relevant for economic interpretation, indicating that market behavior is not homogeneous over time.
The main contribution of this work lies in offering an objective basis for decisions in volatile market environments, by combining point forecast, out-of-sample validation, and empirical interval for the one-day horizon. The findings indicate that return and risk require distinct predictive treatments, providing valuable insights for investors and managers. However, the limited historical coverage of ANBIMA curves restricted the broader incorporation of the term structure of real interest rates, nominal rates, and implied inflation into the main predictive block. For future studies, it is suggested that consistent expansion of these curves may indicate whether regime segmentation adds economic content and additional predictive value, deepening the understanding of how inflationary shocks and market expectations affect the pricing of these securities.
Bibliographic References
Banco Central do Brasil [BACEN]. 2022. Relatório de Inflação. Disponível em: https://www.bcb.gov.br/content/ri/relatorioinflacao/202212/ri202212p.pdf. Acesso em: 02 abr. 2026.
Bańbura, M.; Giannone, D.; Reichlin, L. 2010. Nowcasting. ECB Working Paper Series – European Central Bank (175): 1-40.
Corsi, F. 2009. A Simple Approximate Long Memory Model of Realized Volatility. Journal of Financial Econometrics 7(2): 174-196.
Ferreira, R. G. 2015. Tesouro Direto e Outros Investimentos Financeiros: LTN, LFT, NTN, CDB, RDB, LCI e LI: Planos Financeiros e Atuariais de Aposentadoria. Atlas. São Paulo.
Hamilton, J. D. 1989. A New Approach to the Economic Analysis of Nonstationary Time Series and the Business Cycle. Econometrica 57(2): 357-384.
Hodson, T. O. 2022. Root Mean Square Error or Mean Absolute Error. When to Use Them or Not. Geoscientific Model Development 15(14): 5481-5487.
Hyndman, R. J.; Athanasopoulos, G. 2021. Forecasting: Principles and Practice. 3 ed. OTexts. Melbourne. Disponível em: https://otexts.com/fpp3/. Acesso em: 02 abr. 2026.
Júnior, J. B. A.; Tavares, L. A. P. 2024. Rentabilidade dos títulos do tesouro. Uma análise de séries temporais e janelas móveis. Revista Processus de Estudos de Gestão, Jurídicos e Financeiros 15(48): 1-19.
Ke, G.; Meng, Q.; Finley, T.; Wang, T.; Chen, W.; Ma, W.; Ye, Q.; Liu, T.-Y. 2017. LightGBM. A Highly Efficient Gradient Boosting Decision Tree. Advances in Neural Information Processing Systems 30: 3146-3154.
Ljung, G. M.; Box, G. E. P. 1978. On a Measure of Lack of Fit in Time Series Models. Biometrika 65(2): 297-303.
Minella, A.; Freitas, P. S.; Goldfajn, I.; Kfoury, M. M. 2003. Inflation Targeting in Brazil: Constructing Credibility under Exchange Rate Volatility. Journal of International Money and Finance 22(7): 1015-1040.
Ministério da Fazenda [GOV]. 2025. Investimentos no Tesouro Direto somam R$ 7,26 bilhões em julho, aponta Tesouro Nacional. Disponível em: https://www.gov.br/fazenda/pt-br/assuntos/noticias/2025/agosto/investimentos-no-tesouro-direto-somam-r-7-26-bilhoes-em-julho-aponta-tesouro-nacional. Acesso em: 02 abr. 2026.
National Institute of Standards and Technology [NIST]. 2026. Normal Probability Plot. Disponível em: https://www.itl.nist.gov/div898/handbook/eda/section3/normprpl.htm. Acesso em: 02 abr. 2026.
Perlin, M. 2016. A Microestrutura do Tesouro Direto: Sazonalidade do Fluxo de Ordens e o Processo de Formação de Spreads. Economia Aplicada 20(3): 253-272.
Portal do Investidor [GOV]. 2022. Tesouro IPCA+. Disponível em: https://www.gov.br/investidor/pt-br/investir/tipos-de-investimentos/titulos-publicos/tesouro-ipca. Acesso em: 02 abr. 2026.
Rabiner, L. R. 1989. A Tutorial on Hidden Markov Models and Selected Applications in Speech Recognition. Proceedings of the IEEE 77(2): 257-286.
Silva, C. G.; Leme, M. C. S. 2008. Inflation and Interest Rate. Which One Is More Persistent in Brazil? Anais do XXXVI Encontro Nacional de Economia.
Tesouro Nacional [GOV]. 2025. Tesouro Direto bate recordes de vendas, número de operações, resgates e vendas líquidas em dezembro. Disponível em: https://www.gov.br/tesouronacional/pt-br/noticias/investimentos-no-tesouro-direto-somam-r-8-55-bilhoes-em-dezembro-maior-valor-da-serie-historica. Acesso em: 02 abr. 2026.
Tesouro Transparente. 2026. Taxas dos Títulos Ofertados pelo Tesouro Direto. Disponível em: https://www.tesourotransparente.gov.br/ckan/dataset/taxas-dos-titulos-ofertados-pelo-tesouro-direto. Acesso em: 02 abr. 2026.
Article originating from the Course Conclusion Work of the Specialization in Data Science and Analytics of the MBA USP/Esalq
To learn more about the course, click here and access the MBX Academy platform