
September 16, 2026
Multivariate Models Applied to the Prediction of Delays in Regular Interstate Road Transport in Brazil
Paola Fernanda Silveira Monteiro; William Barbosa
DOI: 10.22167/2675-6528-202602304
Article derived from a Final Course Work (TCC), with content based on the student’s original work and adapted to the editorial format of the Revista E&S with the support of the ResumeAI tool, an artificial intelligence solution developed by the Pecege Institute for textual synthesis and organization.
Summary
The integration of the Brazilian territory has historically been based on the road transport modal, essential for national mobility, but its efficiency is constantly challenged by time management, impacting social well-being and the financial health of transport companies. The objective was to predict delays exceeding 30 minutes in regular interstate road transport in Brazil, using Machine Learning models. For this purpose, 906,476 travel records from ANTT from 2024 were used. Algorithms such as Logistic Regression, Random Forest, and XGBoost were applied, with data balancing techniques like UnderSampling, SMOTE, and ADASYN. The Balanced Random Forest achieved the best predictive performance, addressing data asymmetry and presenting low computational cost, which enabled its application in real production environments. The analysis showed that regions outside the Southeast/South axis exhibited a higher delay rate. It was concluded that the model can be employed as a Delay Propensity “Score”, offering a competitive intelligence tool to identify critical routes, optimize preventive resources, and mitigate operational risks.
Keywords: Balanced Random Forest; Operational Efficiency; Machine Learning; Delay Propensity Score.
1. Introduction
Road transport is the main vector of mobility in Brazil, historically being the backbone of territorial integration and responsible for 95% of passenger transport in the national territory (CNT, 2023). In 2023, regular interstate service moved more than 43 million passengers, showing an increase of 2.3% compared to the previous year and reinforcing the relevance of this mode in a scenario of economic expansion and urbanization (TRIIP, 2023). The efficiency of the transport system is intrinsically linked to the economic and social development of a country, providing regional integration and access to goods and services (Neto et al., 2017).
Despite its strategic predominance, the Brazilian road system faces structural and efficiency challenges, especially regarding time management. Punctuality and integrity are fundamental attributes for the effectiveness of public transport, directly impacting social well-being and the user’s perception of quality (Lopes et al., 2021). Besides passenger satisfaction, mitigating delays is crucial for the financial health of operators, who operate with narrow profit margins, between 5.02% and 12%. Any inaccuracy can lead to the unnecessary mobilization of technical reserves, resulting in additional costs due to fleet idleness, extraordinary fuel consumption, and unplanned overtime (ANTT, 2020).
In this context, the occurrence of delays exceeding 30 minutes represents a significant strategic bottleneck for system efficiency, although it is a relatively rare event, corresponding to only 4.54% of the total trips analyzed. This rarity characteristic of the response variable configures a severe data imbalance, imposing specific challenges to predictive modeling, as classification algorithms tend to favor the majority class, which can compromise the system’s sensitivity in detecting delay events (He and Garcia, 2009). The rarity of delays is an intrinsic characteristic of the road transport system, not a data collection anomaly, demanding methodological approaches capable of dealing with this structural asymmetry.
Given the complexity and impact of delays, the present study is justified by the need to develop advanced analytical tools to improve the operational management of road transport. The application of Machine Learning models, such as Logistic Regression, Random Forest, and Extreme Gradient Boosting, emerges as a promising approach to identify patterns and determinant variables of punctuality. The innovation lies in the proposal of a “Delay Propensity Score”, which transforms prediction into a competitive intelligence tool, allowing carriers to rank critical routes and optimize the allocation of preventive resources, mitigating financial risks and enhancing user-perceived quality.
The present study aims to estimate and compare models to estimate the occurrence of delays in the regular interstate road transport of passengers in Brazil, using operational data from January to December 2024. For this purpose, classification algorithms such as Logistic Regression, Random Forest, and Extreme Gradient Boosting [XGBoost] are employed, aiming to identify patterns and determinant variables of operational performance. Based on these estimates, the construction of a Delay Propensity Score is proposed, allowing the ranking of routes according to their criticality level. This approach seeks to contribute to the improvement of operational management, the prioritization of interventions, and the optimization of resource allocation in the sector.
2. Material and Methods
This research has an exploratory, descriptive, and applied nature, with a quantitative approach. The study employs “Machine Learning” algorithms to classify the occurrence of delay or no delay, focusing on the analysis of the influence of contextual and operational factors on the punctuality of the transportation system through categorical variables. To deal with the natural imbalance between the classes of the response variable, data balancing techniques were applied, including “UnderSampling”, “Synthetic Minority Over-sampling Technique” [SMOTE], “Adaptive Synthetic Sampling” [ADASYN], and “Balanced Random Forest”.
For the analysis, public data from the National Agency of Land Transportation (ANTT) regarding regular interstate road trips in Brazil, collected from January to December 2024, were used. The database, in “comma-separated values” [csv] format, contains operational information from 906,476 records of trips made throughout the national territory. Table 1 details the original information from this database.
Table 1. Dictionary of the regular interstate road travel report database
| Columns | Type | Format |
|---|---|---|
| Plate | Alphanumeric | |
| new_line | Alphanumeric | |
| scheduled_trip_date | Date | MM/DD/YYYY |
| scheduled_trip_time | Time | HH:MM:SS |
| start_date_of_trip | Date/Time | MM/DD/YYYY HH:MM:SS |
| end_of_trip_date | Date/Time | MM/DD/YYYY HH:MM:SS |
| Geographic Latitude | Numeric | |
| Longitude | Numeric | |
| Pdop | Numeric |
Source: Original survey data
The fields “placa” and “nu_linha” identify the vehicle and the line number, respectively. The variables “data_viagem_programada” and “hora_viagem_programada” indicate the scheduled date and time, while “data_inicio_viagem” and “data_fim_viagem” record the actual departure and arrival times. “Latitude” and “Longitude” provide the geographic coordinates of the endpoint, and “position dilution of precision” [pdop] expresses the positioning accuracy. Additional information about the manufacturing year and vehicle type was incorporated by cross-referencing with a second database, using the license plates as a relationship key. The structure of the new columns can be consulted in Table 2.
Table 2. Dictionary of the regular interstate road travel vehicle database
| Columns | Type | Format |
|---|---|---|
| Plate | Alphanumeric | |
| Vehicle type | Alphanumeric | |
| Year of manufacture | Date |
Source: Original survey data.
Data preparation involved cleaning, handling inconsistencies, and removing irrelevant data, such as international routes and variables not focused on the study. Conversion and standardization for temporal ordering of records were performed. Analyses were conducted in the Spyder development environment, using packages such as pandas 2.3.3, numpy 1.26.4, scipy 1.16.3, matplotlib 3.8.0, seaborn 0.13.2, statsmodels 0.14.1, scikit-learn 1.2.2, xgboost 3.0.4, shap 0.46.0, imbalancedlearn 0.11.0, geopandas 1.0.1, and holidays 0.75 in Python 3.11. Records were grouped monthly (January to December 2024), and destinations were classified into regions. The analysis has limitations, such as the impossibility of calculating distances due to the absence of origin and end-of-line points, and the lack of daily information on road conditions.
The criterion for classifying delays in trips was established based on the parameter proposed by Monsuur et al. (2021), considering delays exceeding 30 minutes. The delay calculation was performed by the difference, in minutes, between the actual and scheduled departure date and time, with negative values adjusted to zero. Fleet age was calculated by subtracting the vehicle’s manufacturing year from the travel year (2024).
Quantitative variables were transformed into qualitative (binary) ones. For the response variable, delays greater than 30 minutes were assigned a value of 1, and the rest, a value of 0. Similarly, the explanatory variable “veiculo_velho” was defined as 1 for vehicles aged 10 years or older and 0 for those younger than 10 years. The variable “atraso” corresponds to the difference, in minutes, between the scheduled time and the actual travel time, with negative values adjusted to zero.
To investigate and classify the delays, multivariate predictive models capable of capturing linear and non-linear relationships were adopted. Three algorithms were selected: Logistic Regression, Random Forest, and Extreme Gradient Boosting (XGBoost). The choice of these models was due to the nature of the response variable and their robustness in classification tasks, as well as their flexibility in handling different types of variables, including contexts with multicollinearity and complex interactions.
Logistic Regression models the relationship between a binary response variable and predictors, using a logistic (sigmoid) function to transform the linear combination of predictors into probability, with an output between 0 and 1. The function is defined as:
p(X) = eβ0+β1X / (1+eβ0+β1X) (1)
Where p(X) is the probability of the positive class being present, and β0 and β1 are the model coefficients. The logistic transformation is presented as:
g(X) = ln[p(X)/(1-p(X))] = β0 + β1X (2)
Where g(X) is the logarithm of the odds ratio [odds], p(X) the probability of occurrence of the event of interest, 1-p(X) the complementary probability, and β0 and β1 the intercept and the angular coefficient, respectively.
The “Random Forest” (Santos, 2020) is an ensemble learning method that builds multiple decision trees. Each tree is trained independently using a random sample of the data (“bootstrap”), and a random subset of variables is selected for each split, promoting diversity and avoiding overfitting. Predictions are generated by combining the individual results of the trees (majority voting for classification).
XGBoost (Barreto, 2023) is a machine learning algorithm that uses the “boosting” method, sequentially combining multiple decision trees for accurate predictive models. It optimizes the performance of “gradient boosting” and applies regularization techniques to prevent “overfitting”. The objective function is given by:
Obj(θ) = Σi=1nl(yi, ŷi) + Σk=1K Ω(fk) (3)
Where Obj(θ) is the objective function to be optimized, θ are the model parameters, n is the number of training samples, l(yi, ŷi) is the Loss Function, and Ω(fk) is the penalty or regularization function applied to the tree fk.
To evaluate the performance of the predictive models, the data were partitioned into training and testing sets. Appropriate metrics for classification problems with strong class imbalance were used, such as F1-score, area under the ROC Curve [AUC], and the Kolmogorov-Smirnov [KS] statistic. Accuracy was not adopted as the primary metric. The F1-score is defined as:
F1-score = 2 * (Precision * Recall) / (Precision + Recall) (4)
Where “Precision” and “Recall” are defined by:
Precision = VP / (VP + FP) (5)
Recall = VP / (VP + FN) (6)
Where TP is True Positives, FP is False Positives and FN is False Negatives. The AUC is defined as:
AUC = ∫01 TVP(TFP-1(x))dx (7)
Where TVP is the True Positive Rate and TFP is the False Positive Rate. The KS statistic is defined as:
KS = max|F_positive(x) – F_negative(x)| (8)
Where F_positive(x) and F_negative(x) represent the cumulative behavior of the predicted probabilities for the delay and non-delay classes. Additionally, the execution time of the models was recorded to evaluate computational efficiency.
Data balancing was addressed to neutralize the asymmetry between the ‘no delays’ and ‘delays’ classes. The implemented and compared sampling approaches included “UnderSampling” (reduction of the majority class), “Synthetic Minority Over-sampling Technique“ [SMOTE] and “Adaptive Synthetic Sampling” [ADASYN] (creation of synthetic data by interpolation). The “Balanced Random Forest” mitigates the imbalance internally by performing balanced sampling for each tree of the “ensemble” without permanently discarding data.
To interpret the models’ “outputs”, Shapley Additive Explanations [SHAP] was used, a post-hoc Explainable Artificial Intelligence [XAI] tool (Lundberg and Lee, 2017). SHAP calculates the marginal impact of each variable, allowing the identification of which variables influence the probability of delay or punctuality, acting as a control mechanism for audit and human interpretation.
3. Results and Discussion
The analysis of interstate road transport data in Brazil, from January to December 2024, revealed a significant concentration of routes in the Southeast region, reflecting its high population density and road infrastructure. This centrality is illustrated by the distribution of routes across the national territory, as shown in Figure 1.
Figure 1. Destinations of regular interstate road transport in Brazil according to ANTT data (2024)
Source: Original research results
The distribution of highways by region, according to the National Confederation of Transport (CNT, 2024), shows that the South region has the highest density of paved highways (20.5 km/thousand km²), while the North region presents the lowest (2.7 km/thousand km²). This difference in infrastructure and the geographical characteristics of the North historically favors other modes of transport, such as river transport, and imposes logistical challenges for highway maintenance, resulting in a smaller number of routes in this region.
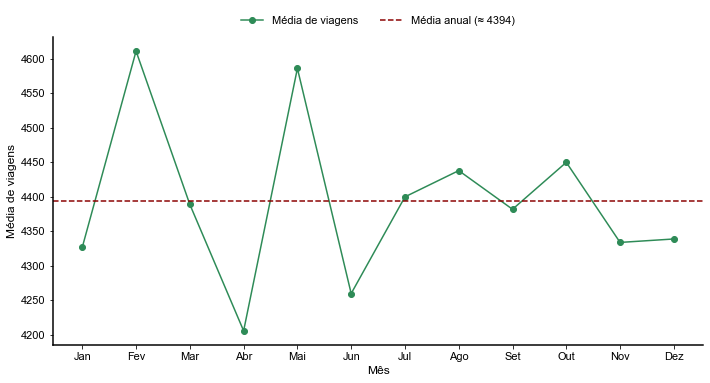
The daily average of trips per month in 2024, presented in Figure 2, indicated a relatively stable variation in the volume of interstate road trips, oscillating between 4,200 and 4,600 daily trips. February registered the highest average, driven by the Carnival holiday, which in 2024 occurred from February 10th to 14th, generating an increase in demand. April, in turn, presented the lowest average, possibly due to the extended Easter holiday, which concentrated trips on a few days and reduced effective operating days. Factors such as weather conditions and school periods may also have influenced travel frequency.
Figure 2. Average monthly trips in 2024
Source: Original research results
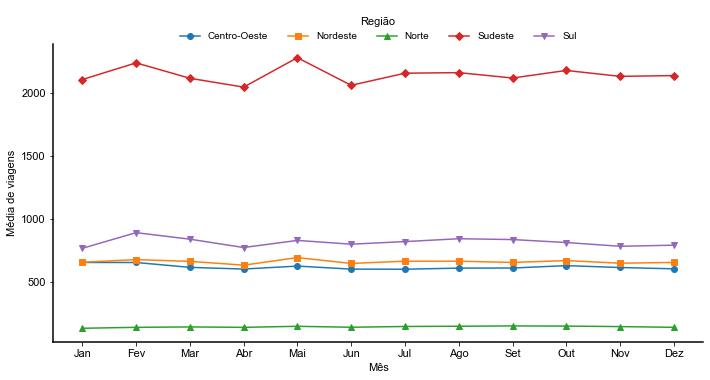
Figure 3 shows distinct mobility patterns among the five regions of Brazil. The Southeast region consistently presented the highest daily average of trips throughout the year, with peaks in February and May, indicating greater intensity of activities and population demand. In contrast, the North region maintained the lowest daily average of trips, at a lower level than the others, attributed to lower population density, vast geographical extensions, and differentiated transport infrastructure. The Center-West, Northeast, and South regions presented intermediate patterns, with the South standing out with a daily average higher than the Center-West and Northeast, but still below the Southeast. Monthly fluctuations in all regions may reflect seasonalities related to vacation periods, holidays, or specific events.
Figure 3. Average trips by region in 2024
Source: Original research results
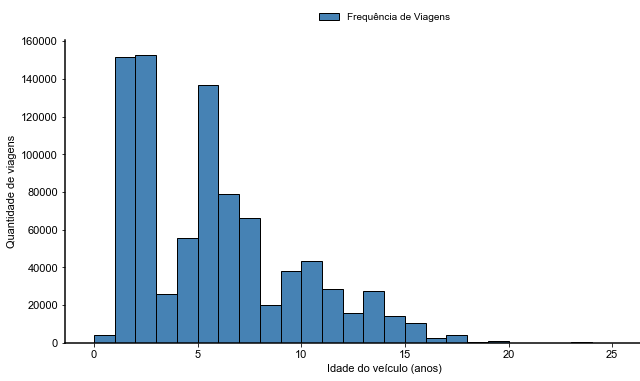
The frequency of the number of trips in relation to the age of the vehicles, in years, is presented in Figure 4. A significant concentration of trips made by newer vehicles was observed, with a prominent peak in the 1 to 2 year age range, suggesting the intense use of recently acquired vehicles or those with little mileage. This finding is in accordance with Resolution No. 6.033/2023 of the ANTT (Brazil, 2023), which establishes a limit of 15 years for the age of vehicles in regular interstate road transport of passengers.
Figure 4. Histogram of the distribution of trips by fleet age
Source: Original research results
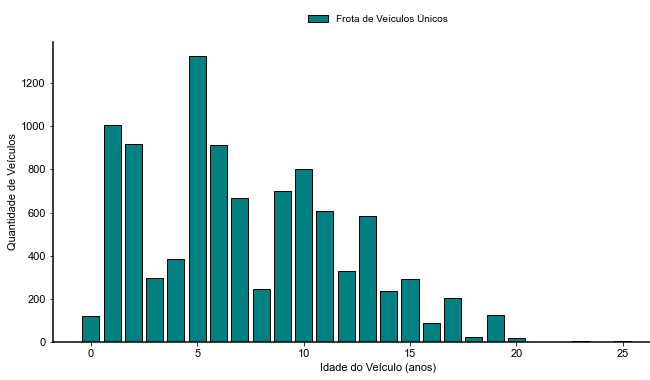
Figure 5, which shows the distribution of vehicles by age, reveals that the quantity of vehicles tends to decrease gradually with increasing age. There is a sharp drop after 6 years, and the contribution of vehicles older than 10 years is considerably smaller, becoming marginal after 20 years and practically null from 25 years onwards. This trend is influenced by regulatory requirements that limit vehicle age and encourage fleet renewal (Brazil, 2023).
Figure 5. Histogram of vehicle distribution by age
Source: Original research results
The categorization of regions into two blocks (Southeast/South and other regions) allowed for a comparison of structural differences in the propensity for delay. The Southeast/South block concentrated 611,300 trips, while the other regions registered 295,176. In absolute terms, the number of delays was higher in the Southeast/South (24,932 occurrences). However, the proportional delay rate inverted this pattern: Southeast/South presented 4.08%, while the other regions registered 5.49%. This indicates that, despite the higher operational volume in the more dynamic regions, the relative probability of delay is higher in the other regions, suggesting that operational intensity and structural propensity for delay do not necessarily coincide. Table 3 summarizes these results.
Table 3. Lag rate by regional blocks
| Regional Block | Total Trips | Total Delays | Delay Rate (%) |
|---|---|---|---|
| Southeast + South | 611300 | 24932 | 4,08 |
| Other regions | 295176 | 16212 | 5,49 |
Source: Original research results
The analysis of the response variable revealed a significant structural imbalance: out of a total of 906,476 observations, 95.46% corresponded to on-time trips, and only 4.54% to delays exceeding 30 minutes. This rarity of delay events (approximately 21 on-time trips for each delay) poses challenges to predictive modeling, as classification algorithms tend to favor the majority class (He and Garcia, 2009). The rarity of delays is an intrinsic characteristic of the passenger road transport system, not a data collection failure. Thus, predictive modeling must incorporate the imbalance as part of the operational reality, requiring specific methodological strategies. The models evaluated were identified according to Table 4.
Table 4. Acronyms for model identification
| Model | Identification |
|---|---|
| UnderSampler + XGBoost | UXGB |
| SMOTE + XGBoost | SXGB |
| ADASYN + XGBoost | AXGB |
| Balanced Random Forest | BRF |
| Logistic Regression | RL |
Source: Original research results
Logistic Regression (LR) was used to diagnose the influence of independent variables on the delay. The coefficients obtained after model fitting, detailed in Table 5, indicate the factors with the greatest statistical weight. The variable `Duration (> 6h)` showed the largest coefficient (β = 1.7242), suggesting a significant impact on increasing the probability of delays. The variables `Holiday`, `Weekend`, and `Vehicle age` also showed positive coefficients, while the variable `Region (South/Southeast)` presented a negative coefficient (β = -0.3374), indicating a reduction in the probability of delays in these locations.
Table 5. Estimated coefficients of the logistic regression
| Variable | Coefficient (β) | OR | Standard error | 95% CI | p-value |
|---|---|---|---|---|---|
| Intercept | -3,7792 | 0,0228 | 0,0115 | [0,0223;0,0234] | <0,001 |
| Region (South/Southeast) | -0,3374 | 0,7136 | 0,0106 | [0,6990;0,7286] | <0,001 |
| Holiday | 0,3958 | 1,4855 | 0,0355 | [1,3857;1,5925] | <0,001 |
| Duration (> 6h) | 1,7242 | 5,6081 | 0,0116 | [5,4817;5,7374] | <0,001 |
| Vehicle age | 0,3030 | 1,3539 | 0,0143 | [1,3165;1,3923] | <0,001 |
| Weekend | 0,3891 | 1,4757 | 0,0128 | [1,4390;1,5133] | <0,001 |
Source: Original research results
To evaluate the predictive quality of the models, performance metrics specific to imbalanced data were used. Tables 6 and 7 present the results of Precision, Recall, F1-Score, AUC, KS, and execution time for the models on the training and testing bases.
Table 6. Results obtained for the parameters Precision, Recall and F1-Score for the models on the training and test bases
| Model | Precision Training | Precision Test | Training Recall | Recall Test | F1- Score Train | F1- Score Test |
|---|---|---|---|---|---|---|
| UXGB | 0,137758 | 0,140548 | 0,364575 | 0,371977 | 0,199960 | 0,204012 |
| SXGB | 0,137758 | 0,140548 | 0,364575 | 0,371977 | 0,199960 | 0,204012 |
| AXGB | 0,139528 | 0,142788 | 0,349841 | 0,358124 | 0,199492 | 0,204171 |
| BRF | 0,137758 | 0,140582 | 0,364575 | 0,371978 | 0,199960 | 0,204012 |
| RL | 0,108390 | 0,108719 | 0,771350 | 0,770811 | 0,190072 | 0,190561 |
Source: Original research results
Table 7. Results obtained for the parameters Threshold, AUC, KS and Time for each model
| Model | Limit | Training AUC | AUC Test | KS Training | KS Test | Time (s) Execution |
|---|---|---|---|---|---|---|
| UXGB | 0.686461 | 0.754085 | 0.756171 | 0.469696 | 0.471007 | 4.356287 |
| SXGB | 0.702776 | 0.754266 | 0.756478 | 0.469729 | 0.470366 | 41.09609 |
| AXGB | 0.709190 | 0.753357 | 0.755952 | 0.469678 | 0.470551 | 151.81968 |
| BRF | 0.702845 | 0.754275 | 0.756448 | 0.469683 | 0.471103 | 23.02472 |
| RL | 0.421579 | 0.742444 | 0.740606 | 0.469665 | 0.470355 | 4.883683 |
Source: Original research results
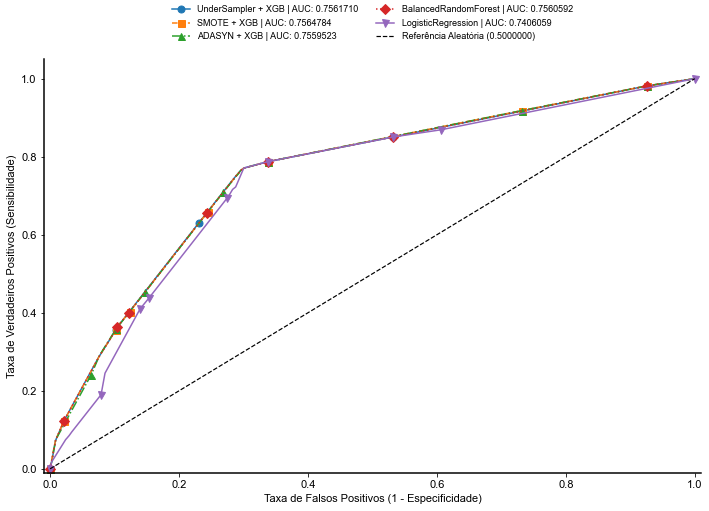
The models based on XGBoost and Balanced Random Forest (BRF) presented similar predictive performance in terms of F1-Score, AUC, and KS statistic. The BRF achieved the highest KS value (0.4711) on the test set, indicating a superior capacity in separating the distributions of delayed trips and on-time trips. The UXGB followed closely with a KS of 0.4710, demonstrating the statistical reliability of both for identifying irregularity patterns. The AXGB model, despite similar predictive performance, required a processing time up to 35 times longer than UXGB and 7 times longer than BRF, making it less operationally viable.
Logistic Regression was discarded from the final comparison stage due to its inferior performance and limitations in capturing complex relationships, as observed in Tables 6 and 7 and Figure 6. LR presented lower F1-Score and AUC values compared to tree-based models. Furthermore, its high Recall (0.7708) and low Precision (0.1087) indicated that, although it identified many delays, it also generated a high number of false positives, reducing the reliability of predictions. Tree-based models, such as BRF, are more flexible for modeling non-linear relationships and complex interactions in transportation operational data (HOSMER et al., 2013).
Figure 6. ROC curve with all models
Source: Original research results
The Balanced Random Forest was selected as the benchmark model, despite UXGB presenting a shorter execution time. The choice is justified because BRF handles imbalance internally during tree construction, performing balanced sampling at each training step without permanently discarding data from the original set, preserving data variability and method robustness. In contrast, UXGB’s undersampling implies the removal of observations from the majority class, which can result in the loss of relevant information.
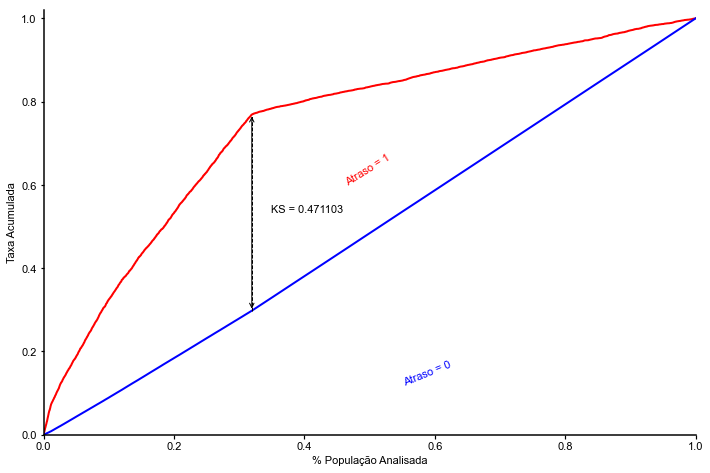
Operational reliability, especially punctuality, is crucial for the economic viability of the service, given that profit margins in the Brazilian sector are narrow (5.02% to 12%, according to ANTP). A high rate of False Positives would induce unnecessary mobilization of technical reserves, generating costs with fleet idleness and fuel. The accuracy of the BRF model, therefore, acts as a safeguard against profitability erosion and contributes to cost optimization and reduction of passenger uncertainty (Scháno et al., 2024; Eriksson et al., 2023; Van den Bergh et al., 2013; Diab, Wasfi e El-Geneidy, 2014). Figure 7, which presents the KS curve of the BRF model, demonstrates the maximum separation between the cumulative distributions of punctual and delayed trips, validating its robustness for managerial decisions.
Figure 7. KS curve obtained for the Balanced Random Forest model
Source: Original research results
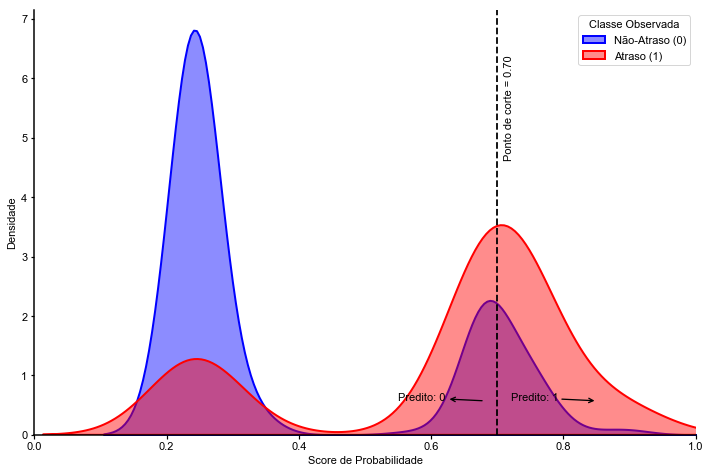
The precision of 0.14, although indicating a significant portion of false alarms (86%), is inherent to the unbalanced nature of transportation data. The BRF, with its superior class separation capability (KS = 0.4711), acts as a risk filter, reducing the universe of trips to be monitored and allowing management to focus on groups with a higher probability of delay. Figure 8 illustrates the distribution of probabilities predicted by the model for the delay and no-delay classes, showing that trips without delay are concentrated at lower probabilities, while those with delay shift to higher values. The cutoff point of 0.70 defines the decision rule, classifying observations with a higher probability as delay, and the model demonstrates satisfactory discrimination capacity.
Figure 8. Score Distribution and Cutoff Point for the Balanced Random Forest model
Source: Original research results
The data consolidated in Table 8 show the BRF algorithm’s capacity to stratify the risk of delays by destination. The North region holds the highest indicators, with an average score of 0.432 and the highest actual occurrence rate (6.85%). This convergence validates the hypothesis that destinations with more complex logistics infrastructure and long-distance routes impose a greater propensity for non-compliance with the operational schedule. The average score is interpreted as a Vulnerability Index: the closer to 0.500, the higher the probability of the trip exhibiting characteristics of a critical delay, serving as a preventive alert.
Table 8. Average Score and Delay Occurrence Rate by Region
Source: Original research results
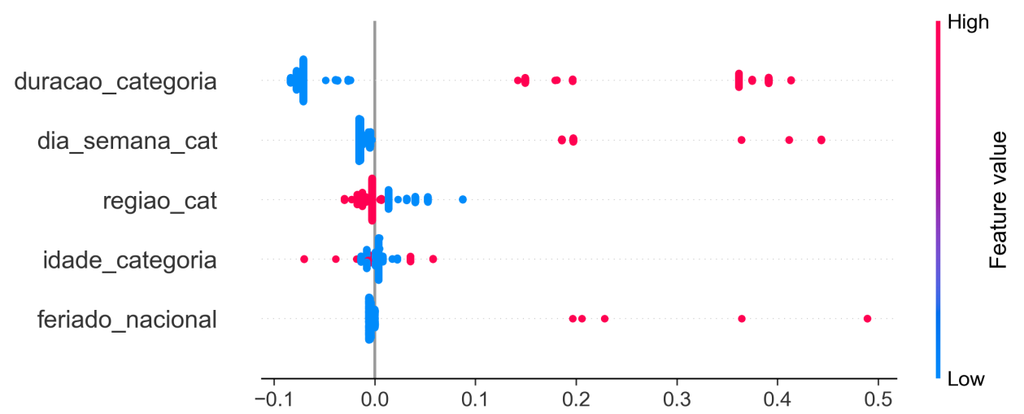
Shapley Additive Explanations (SHAP) analysis was used to understand the contribution of the explanatory variables in the algorithm’s predictions. Figure 9 presents the summary plot of SHAP values for the selected model.
Figure 9. SHAP for the Balanced Random Forest model
Source: Original research results
SHAP values indicate that operational variables, especially `duracao_categoria`, exert greater influence on delay prediction, with long routes significantly increasing this probability. The TRIIP Statistical Yearbook (ANTT, 2024) points out that 57% of trips in 2024 lasted between 4 and 16 hours, evidencing that a large part of the operation occurs in time windows with high exposure to logistical bottlenecks. The `dia_semana_cat` variable also contributes, suggesting that the transition to the weekly rest period (Saturdays and Sundays) accentuates the propensity for delays. Interstate transport flow in 2024 concentrated on Fridays, marking the beginning of the weekend movement cycle. Although the peak of departures occurs on this day, the model identified that the risk of lateness critically consolidates on Saturdays and Sundays, suggesting a residual and cumulative traffic effect. The `regiao_cat` variable shows a moderate impact, while `idade_categoria` and `feriado_nacional` contribute relatively less.
In summary, the study demonstrated that, although the system operates with high punctuality (>95%), the concentration of delays in regions with less infrastructure and during periods of higher seasonality creates operational bottlenecks. Only 4.54% of trips presented delays exceeding 30 minutes, a rare event that justifies the adoption of specific metrics for model evaluation. The Balanced Random Forest (BRF) model showed superior performance in handling imbalance, achieving a KS of 0.4711, which reinforces its ability to discriminate rare delay events. SHAP analysis indicated that trip duration and day of the week are the main predictor variables. The application of a Delay Propensity “Score”, instead of a binary classification, allows ranking itineraries by criticality level, optimizing resource allocation and operational risk anticipation, transforming operational data into interpretable predictive indicators.
4. Conclusion
This study aimed to estimate and compare Machine Learning models to predict the occurrence of delays exceeding 30 minutes in regular interstate road passenger transport in Brazil, using a vast operational database from ANTT for the year 2024. It was found that, although punctuality is predominant, with only 4.54% of trips registering delays, regions outside the Southeast/South axis presented a proportionally higher delay rate. Among the evaluated algorithms, the Balanced Random Forest (BRF) demonstrated superior predictive performance, especially when dealing with the intrinsic data imbalance, achieving a KS of 0.4711 and presenting low computational cost. Shapley Additive Explanations (SHAP) analysis revealed that trip duration and day of the week are the most influential variables in the propensity for delays, with long routes and weekends accentuating this probability. The main contribution of this work lies in the proposal of a Delay Propensity “Score”, which transforms prediction into a competitive intelligence tool, allowing carriers to rank critical itineraries and optimize the allocation of preventive resources, mitigating operational and financial risks.
Despite the relevant findings, the study acknowledges limitations, such as the 30-minute criterion for delay, which is operational in nature and lacks a formally consolidated standard in the literature, suggesting the need for future work to refine this definition. The computational complexity involved in data processing and modeling also points to the importance of more robust processing resources in future explorations. For future studies, it is recommended to expand the scope by integrating exogenous data, such as road infrastructure conditions, real-time traffic alerts, climatic factors, enforcement records, and fleet telemetry data. This more comprehensive approach would allow the evolution of the “Score” into a “Digital Twin” of the logistics operation, capable of dynamically adapting to changes in the road environment and further enhancing strategic management and decision-making in the passenger transport sector.
Bibliographic References
Antt. 2023. Anuário Estatístico do TRIIP 2023: Dados do Transporte Rodoviário Interestadual e Internacional. Brasília, DF, Brasil. Disponível em: < https://www.gov.br/antt/pt-br/assuntos/passageiros/anuario-estatistico-do-TRIIP >. Acesso em: 11 mar. 2025.
Antt. 2024. Anuário Estatístico do TRIIP 2024: Dados do Transporte Rodoviário Interestadual e Internacional. Brasília, DF, Brasil. Disponível em: < https://www.gov.br/antt/pt-br/assuntos/passageiros/anuario-estatistico-do-TRIIP >. Acesso em: 15 abr. 2025.
Barreto, J.S. 2025. Predição de síndrome respiratória aguda grave por meio de multiclassificação com algoritmos de machine learning. Monografia em Estatística. Universidade Estadual da Paraíba, Campina Grande, PB, Brasil. Disponível em: < https://dspace.bc.uepb.edu.br/jspui/bitstream/123456789/30153/9/TCC%20-%20Joseferson%20da%20Silva%20Barreto>. Acesso em: 27 mai. 2025.
Brasil. 2023. Resolução n° 6.033, de 21 de dezembro de 2023. Dispõe sobre o Marco Regulatório do Transporte Rodoviário Coletivo Interestadual e Internacional de Passageiros. Diário Oficial da União, Brasília, DF, Brasil, 22 dez. 2023. Seção 1, p. 182. Disponível em: https://nttlegis.antt.gov.br/action/ActionDatalegis.php?acao=detalharAto&numeroAto=00006033&valorAno=2023. Acesso em: 14 abr. 2026.
Confederação Nacional do Transporte [CNT]. 2023. Pesquisa CNT de Rodovias 2023. CNT SEST SENAT, ITL, Brasília, DF, Brasil. Disponível em: < https://static.poder360.com.br/2023/11/pesquisa-cnt-rodovia-2023.pdf >. Acesso em: 24 mar. 2025.
Confederação Nacional do Transporte [CNT]. 2024. Pesquisa CNT de Rodovias 2024. CNT, SEST SENAT, ITL, Brasília, DF, Brasil. Disponível em: < https://cnt.org.br >. Acesso em: 29 jul. 2025.
Diab, E.; Wasfi, R.; El-Geneidy, A. 2014. Extraboard team sizing: an
Eriksson, E.L.; Lidestam, H.; Winslött Hiselius, L. 2023. Effects on operating costs of adjusting bus departure times during peak-hour traffic in Sweden. Research in Transportation Economics 100(1): 101327. Disponível em: . Acesso em: 28 ago. 2025.
He, H.; Garcia, E.A. 2009. Learning from imbalanced data. IEEE Transactions on Knowledge and Data Engineering 21(9): 1263-1284. Disponível em: < https://ieeexplore.ieee.org/document/5128907 >. Acesso em: 28 fev. 2026.
Hosmer, D.W.; Lemeshow, S.; Sturdivant, R.X. 2013. Applied Logistic Regression. 3ed. Wiley, Hoboken, NJ, USA. Disponível em: < https://doi.org/10.1002/9781118548387 >. Acesso em: 08 mar. 2026.
Lopes, D.; Diniz, H.; Balbino, L.; Pretti, L.; Freitas, L.; Vieira, T.; Gonçalves, W. 2021. Proposta de indicador padronizado de pontualidade para o transporte de passageiros no modal rodoviário. Fundação Dom Cabral, Vitória, ES, Brasil. Disponível em: < https://repositorio.itl.org.br/jspui/bitstream/123456789/535/3/Proposta%20de%20indicador%20padronizado%20de%20pontualidade%20para%20o%20transporte%20de%20passageiros%20no%20modal%20rodovi%C3%A1rio.pdf >. Acesso em: 12 mar. 2025.
Lundberg, S.M.; Lee, S.I. 2017. A Unified Approach to Interpreting Model Predictions. In: International Conference on Neural Information Processing Systems, 2017, Long Beach, CA, USA. Anais… p. 4765-4774. Disponível em: < https://arxiv.org/abs/1705.07874 >. Acesso em: 07 abr. 2026.
Monsuur, F.; Enoch, M.; Quddus, M.; Meek, S. 2021. Modelling the impact of rail delays on passenger satisfaction. Transportation Research Part A: Policy and Practice 152(C): 19-35. Disponível em: < https://doi.org/10.1016/j.tra.2021.08.002 >. Acesso em: 21 jul. 2025.
Neto, T.O.; Nogueira, R.J.B. 2017. Transporte rodoviário de passageiros no Brasil. Revista Transporte y Territorio 16(1): 229-250. Disponível em: < https://dialnet.unirioja.es/descarga/articulo/6175452.pdf >. Acesso em: 11 mar. 2025.
Santos, G.C. 2020. Algoritmos de Machine Learning para previsão da B3. Dissertação de Mestrado em Engenharia Elétrica. Universidade Federal de Uberlândia, Uberlândia, MG, Brasil. Disponível em: < https://doi.org/10.14393/ufu.di.2020.640 >. Acesso em: 23 mai. 2025.
Scháno, M.; Dvořáčková, A.; Smíšek, O. 2024. Assessing time and financial costs of bus delays in the Ústí nad Labem Region, Czech Republic. Acta Polytechnica CTU Proceedings 51(1): 94-108. Acesso em: 23 mai. 2025.
Van den Bergh, J.; Beliën, J.; De Bruecker, P.; Demeulemeester, E.; De Boeck, L. 2013. Personnel scheduling: A literature review. European Journal of Operational Research 226(3): 367-385. Disponível em: < https://doi.org/10.1016/j.ejor.2012.11.029 >. Acesso em: 13 abr. 2026.
Article originating from the Course Conclusion Work of the Specialization in Data Science and Analytics of the MBA USP/Esalq
To learn more about the course, click here and access the MBX Academy platform