
September 16, 2026
Analytical Models for Business Intelligence in Services Consulting
Mariana Briamonte da Silveira; Anna Carolina Martins
DOI: 10.22167/2675-6528-202602273
Article derived from a Final Course Work (TCC), with content based on the student’s original work and adapted to the editorial format of the Revista E&S with the support of the ResumeAI tool, an artificial intelligence solution developed by the Pecege Institute for textual synthesis and organization.
Summary
A predictive classification model, based on logistic regression, was developed and validated to estimate the probability of conversion of new business in a Brazilian service consultancy. The objective was to identify the determining factors for contract closing, such as demand source, company sector, and project value, aiming to complement empirical decision-making with a data-driven approach. To this end, historical Customer Relationship Management (CRM) data between 2022 and 2025 were analyzed. The model was evaluated by performance metrics such as Accuracy, AUC, and Precision, to ensure its applicability as a support tool for leadership in prioritizing commercial efforts. The results indicated that strategies based on the client portfolio, such as up-selling and next-selling, showed a relevant positive association with conversion. Higher value opportunities and certain sectors demonstrated a lower probability of closing. Although the model presented moderate predictive capacity, it showed potential by translating historical data into practical action drivers. However, limitations related to data quality and granularity and the complexity of the analyzed phenomenon were highlighted, reinforcing the need for its use as a complement to managerial judgment and opening space for future developments.
Keywords: Data-driven; Business intelligence; Logistic regression.
1. Introduction
Regardless of the sector of activity, data science has proven to be a necessary sphere of knowledge for companies that want to maintain or increase their relevance and competitiveness in the market. The use of analytical approaches allows guiding the launch of new products, optimizing prices, bringing efficiency to operations, generating sales predictability, among other advantages (Pinheiro, 2024).
These analytical approaches became increasingly robust as the internet and data generation evolved in the 2000s. In this context, companies began to cross internal and external information in large volumes and at high speeds, seeking to identify patterns and anticipate consumer behavior. This movement is formalized when Laney (2001) describes the concept of big data based on three dimensions, known as the “3 Vs”: volume, velocity, and variety. Thus, more than a massive volume of data, big data represents a paradigm shift: the need for new technologies to support data-driven decision-making and increase organizational efficiency. In this way, the use of Machine Learning (ML) was an accelerator, as it made computational systems capable of learning from data, adjusting their own parameters and improving performance in specific tasks (Mitchell, 1997).
Aligned with the paradigm shift towards data-driven decision-making, this study applies such concepts to the context of a medium-sized consultancy located in Brazil. Historically, high demand variability, associated with low process standardization, led the organization’s leadership to hypothesize about the limitation of their internal data, attributing to them low explanatory power over commercial performance, for example, the probability of business conversion.
As a consequence of the underutilization of this data, there is an inefficient allocation of commercial resources, with prioritization of efforts, sectors, or offers that present a lower real probability of closing. Added to this scenario is the fact that the consultancy’s data is not historically structured, which hinders more robust analyses and the extraction of relevant insights.
It is important to state that, despite the data having little relevance in the consultancy’s decision-making process in the current scenario, the commercial efforts undertaken based on empirical market observation bring returns, even if with little predictability. Thus, this work does not intend to suggest a complete change in how the consultancy makes its commercial decisions, but it aims to test the hypothesis that there are data-driven models that can increase the prediction of closing deals and bring more comfort or urgency to the team, directing effort and choice of commercial strategies.
The topic is relevant, as there is a recurring challenge for the company’s leadership to explain its commercial context to the Board, defend team expansion and investments in new businesses, for example. In most forums where commercial issues, goals, and sales forecasts are debated, there is no clarity on why sales have increased or decreased, how they will behave in the next semester, and whether they could be even better or worse than the current situation.
For predictive modeling, logistic regression was chosen as the model. According to James et al. (2021), this is a statistical method that also integrates the field of supervised Machine Learning, as it learns patterns from labeled data and uses these relationships to predict the outcome of new cases. The model calculates the probability of an event occurring through a logistic function, which transforms a linear combination of variables into a value between zero and one.
Logistic Regression stands out for its ability to generate well-calibrated probabilities and for its high degree of interpretability (James et al., 2021). This characteristic is particularly relevant in business contexts with smaller databases, where understanding the factors that influence negotiation outcomes is as important as model accuracy. Unlike so-called “black-box” models, logistic regression allows for greater analytical transparency, enabling leadership to identify not only the probability of conversion but also the main drivers of commercial success.
Finally, this study seeks not only to apply a statistical forecasting technique but also to understand the strategic value of data analysis in the commercial management of service consulting. By translating historical CRM information into interpretable probabilities and patterns, the aim is to build an analytical foundation that supports more assertive decisions regarding prospecting, prioritization, and negotiation of opportunities. More than a technical exercise, this study represents a concrete step in consolidating a data-driven culture within the organization, contributing to reducing uncertainties, directing strategies, and expanding the company’s competitive potential. Thus, this work aims to develop and validate a predictive classification model, based on logistic regression, to estimate the probability of conversion of new business in a Brazilian service consulting firm.
2. Material and Methods
This work is characterized as an applied study, using actual values from the commercial process of a medium-sized service consulting company located in Brazil. The research adopts an initial exploratory and descriptive approach for data understanding, evolving to predictive and prescriptive analyses based on quantitative methods.
Data collection was performed using secondary records from the consultancy’s Customer Relationship Management (CRM), made available for the project. After initial processing, the database contained 12 variables, with records from January 2022 to November 2025, totaling approximately 569 rows. The variables available for analysis, along with their descriptions and intended use, are presented in Table 1.
Table 1 – Available variables for analysis
| Name | Type | Description | Considered in the analysis |
|---|---|---|---|
| Business ID | Numerical | Primary key related to opening a demand | Yes |
| Company Name | Nominal Categorical | Name of the company that is quoting a service with the consultancy | No |
| Offer | Nominal Categorical | Categorization of that demand into a specific consulting offering, which may be: (1) Resource Allocation; (2) Portfolio Analysis or Management; (3) Benchmark or Market Research; (4) Training, Lectures and Workshops; (5) CVB; (6) Strategic Design; (7) Innovation Diagnosis; (8) Innovation or Promotion Strategy; (9) Digital Strategy / AI; (10) Technological Strategy; (11) Project Execution; (12) Undefined; (13) Strategic Planning; (14) Management Platform; (15) Innovation Awards; (16) Innovation Programs | Yes |
| Creation Date | Continuous Numerical Temporal | Date the deal¹ was registered (opened) in the CRM | Yes |
| Gain Date | Continuous Numerical Temporal | Date the deal was marked as won in CRM | No |
| Value | Continuous Numerical | Negotiated value for the hiring of the project in question (in reais – R$) | Yes |
| Condition | Nominal Categorical | Identification of whether the business is (1) open, (2) won, or (3) lost | Yes |
| Step | Ordinal Categorical | Stage in which the business was in the funnel at a given time, which may be: (1) Understanding the Demand; (2) Proposal Elaboration; (3) Review / Negotiation; (4) Contracting / Delivery; (5) Delivered to Operation; (6) Stand By (when the opportunity was not considered lost, but postponed for the future) | No |
| Source of Demand | Nominal Categorical | Multiple choice, defines the origin of the deal demand in up to nine possibilities: (1) Marketing Actions; (2) Cross-selling; (3) Spontaneous; (4) Own Events; (5) Third-party Events; (6) Undefined; (7) Indication; (8) Next-selling; (9) Contact Redemption; (10) Up-selling | Yes |
| Reason for Loss | Nominal Categorical | Identification of the reason for the project not being won. Among the mapped reasons are: (1) Client does not return contact; (2) Demand not identified; (3) Inadequacy of the approach; (4) NA (in case of won deals); (5) Another opportunity in progress; (6) Others; (7) Price; (8) Project will no longer be executed; (9) They decided to do it internally | Yes |
| Responsible leader | Nominal Categorical | Leader of the company studied, responsible for negotiating the project in question. For confidentiality reasons, should it be necessary to cite them, they will be mentioned as: Alpha, Beta, Gamma, Delta, Epsilon, Zeta, Eta, Theta, Iota, and Undefined. | No |
| Company Sector | Nominal Categorical | Categories that represent the sector in which the contracting company is classified, which may be: (1) Agribusiness; (2) Water, Sanitation and Environmental Services; (3) Food, Beverages and Ingredients; (4) Automotive; (5) Banks or Financial Services; (6) Capital Goods; (7) Construction, Engineering and Furniture; (8) Cosmetics, Personal Hygiene, and Household Cleaning; (9) Education; (10) Electro-electronics; (11) Electric Energy; (13) Pharmaceutical and Life Sciences; (13) Government, Associations and ICTs; (14) Construction Materials; (15) Media and Advertising; (16) Mining, Metallurgy and Steelmaking; (17) Other Sectors; (18) Paper and Pulp; (19) Oil, Gas and Petrochemicals; (20) Chemicals; (21) Insurance and Health Plans; (22) Medical Services; (23) Services or Facilities; (24) Information Technology; (25) Telecommunications; (26) Third Sector; (27) Transport and Logistics | Yes |
Source: Own elaboration
Notes: As this involves existing internal data, there was no need to apply questionnaires or interviews, thus also dispensing with submission to the Research Ethics Committee; “Deal” is a free translation of “negócio” (business deal), and it is the most common way the company refers to a new commercial opportunity.
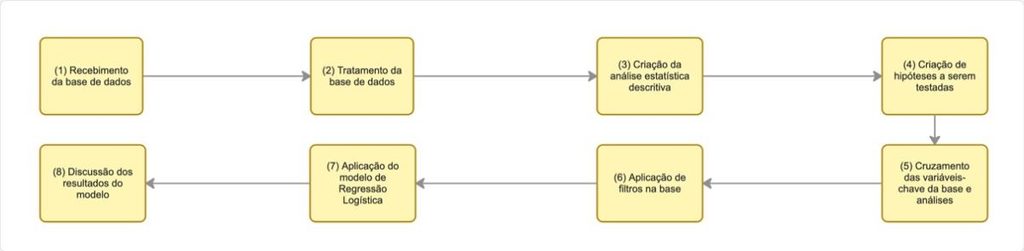
The work followed an ETL (Extract, Transform, Load) process to prepare the data for modeling, as illustrated in Figure 1.
Figure 1 – Step-by-step of the work
Source: Own elaboration
In detail, the ETL process included:
- Receipt of the CRM database with approximately 18 variables and 1000 rows.
- Database treatment, with removal of duplicates, treatment of missing values, and correction of typographical inconsistencies, resulting in 12 main variables and approximately 900 rows.
- Exclusion of businesses with zero project value, reducing the base to about 600 lines.
- Creation of descriptive statistical analysis and extraction of outliers, resulting in 581 lines.
- Identification of the key variables for the model, as indicated in Table 1.
- Exclusion of businesses with “Open” status, as the model only uses “Won” or “Lost” status to create the closing probability, resulting in 548 observations.
The initial analyses were descriptive and exploratory, using measures of central tendency (mean and median) and dispersion (minimum, maximum, variance, and standard deviation). Tables and graphs (histograms, scatter plots, bar charts, and line charts) were employed to visualize data distribution and relationships between numerical and categorical variables.
For predictive modeling, logistic regression was chosen, a supervised Machine Learning statistical method that estimates the probability of binary events occurring. The model calculates the probability of success (pi) using the logistic (or sigmoid) function, expressed by Equation 1:
pi = 1 / (1 + e-(βo + β1×1,i + β2×2,i + … + βkxk,i)) (1)
Where pi represents the predicted probability of success; βo is the intercept; β1, β2, …, βk are the estimated coefficients for each independent variable; x1,i, x2,i, …, xk,i are the independent variables; and e is the base of the natural logarithm.
Nominal categorical variables, such as “Source of Demand” or “Supply”, were transformed into binary (dummy) variables with a reference category. Continuous numerical variables, such as “Value”, were used in their original form, and may be transformed by the natural logarithm (ln) in case of asymmetry. Ordinal variables, such as “Stage”, maintained their natural order.
The influence of each variable was compared by calculating odds ratios (OR), which indicate how much a variable increases or reduces the chances of closing a deal, using Equation 2:
OR = eβi (2)
Where OR represents the change in the odds of closure when the variable increases by one unit or changes category; βi represents the impact of the specific variable; and is the base of the natural logarithm. If OR > 1, the variable increases the odds of success; if OR < 1, it reduces the odds; if OR = 1, there is no effect.
Logistic Regression was chosen for its robustness in small samples, direct interpretation of results, and provision of calibrated probabilities, characteristics suitable for the consultancy’s database and the context of a limited volume of records, mitigating the risk of overfitting.
To ensure model generalization and mitigate overfitting, the set of 548 observations was randomly divided into training (70%) and testing (30%) subsets. The training subset was used to estimate coefficients, and the testing subset to validate performance metrics. The variables selected to compose the model were: Supply, Demand Source, Value, Sector, and Creation Month. The dependent variable was Status (won or lost), excluding observations with “Open” status. The “Third Sector” category was grouped into “Other Sectors” due to a single observation. The model was estimated using the `glm` function with a binomial family and `logit` link function. The reference categories adopted were: November (creation month), own events (demand source), innovation programs (supply type), and electricity (customer sector).
The validation of the logistic regression was performed using metrics such as Accuracy, Area Under the ROC Curve (AUC), Precision, Standard Error, and p-value. Accuracy measures the total proportion of correct predictions (correctly classified won and lost deals) relative to the total number of observations. Precision indicates the proportion of deals predicted as “won” that actually turned out to be won. The Area Under the ROC Curve (AUC) assesses the model’s overall ability to distinguish between positive and negative cases, regardless of the cutoff point adopted for classification. The Standard Error measures the variability or uncertainty associated with the estimated coefficient. The p-value indicates the statistical significance of the coefficient, representing the probability of observing an effect equal to or more extreme than the true coefficient if it were zero.
3. Results and Discussion
Descriptive analysis
The descriptive analysis of the data revealed the main statistical measures of the database. Table 2 summarizes these results, including mean, median, standard deviation, minimum and maximum values, and quartiles.
Table 2 – Descriptive Statistics of the database
| Measure | Value |
|---|---|
| Average | R$ 195,502.35 |
| Median | R$ 124,500.00 |
| Standard deviation | R$ 499,578.59 |
| Minimum | R$ 4,000.00 |
| Maximum | R$ 11,450,000.00 |
| 1st Quartile | R$ 49,600.00 |
| 2nd Quartile | R$ 124,500.00 |
| 3rd Quartile | R$ 244,500.00 |
| 4th Quartile | R$ 11,450,000.00 |
| Interquartile Range | R$ 194,900.00 |
| Inf lim | R$ 4,000.00 |
Source: Original research results
It was observed that the mean of R$ 195,502.35 was higher than the median of R$ 124,500.00, indicating a right-skewed distribution, influenced by extreme values, such as the maximum of R$ 11,450,000.00. To identify possible outliers, the interquartile range (IQR) of R$ 194,900.00 was used, a robust measure to characterize the central variability of the data. Based on the lower limit (R$ 4,000.00) and upper limit (R$ 536,850.00), samples with values above the upper limit were removed, resulting in a base of 581 observations.
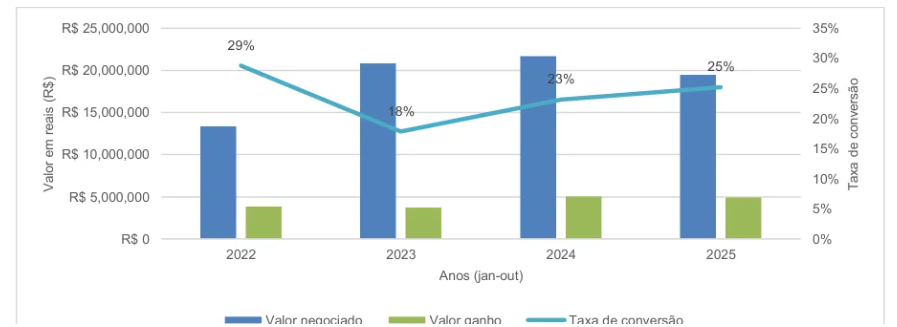
The consultancy negotiates annual values ranging between R$ 13 and R$ 21 million, with an average conversion rate of 24% and an average revenue of R$ 4.3 million annually. Figure 2 illustrates this dynamic, showing that 2024 was the best year in negotiation volume and value gained, although the conversion rate did not maintain the level of 2022. The annual analyses considered the period from January to October, due to data limitations for November and December 2025.
Figure 2 – Negotiated value (R$), sold or earned (R$) and conversion rate (%)
Source: Original research results
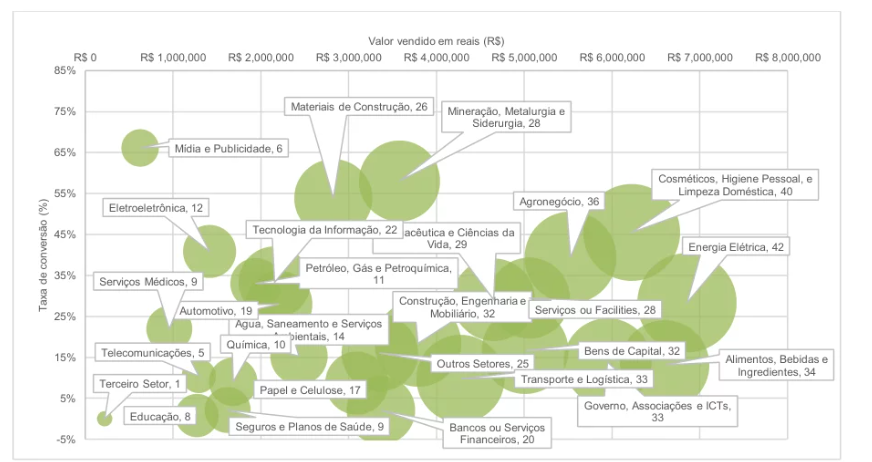
Regarding sector interactions, Figure 3 indicates that Electric Energy (42 opportunities), Cosmetics, Personal Hygiene, and Home Cleaning (40), and Agribusiness (36) were the sectors with the highest number of interactions. The Third Sector (1), Telecommunications (5), and Media and Advertising (6) showed lower interaction. Financially, Electric Energy led with R$ 6,854,092 traded, followed by Food, Beverages, and Ingredients (R$ 6,600,290) and Cosmetics, Personal Hygiene, and Home Cleaning (R$ 6,223,890).
Figure 3 – Interactions, value gained, and conversion rate by sector
Source: Original research results
Conversion rates did not follow the same pattern as financial volume. Media and Advertising had a high rate of 66%, followed by Mining, Metallurgy, and Steelmaking (58%) and Construction Materials (54%). With the exception of the Chemical sector, the service sectors (Third Sector, Education, Insurance and Health Plans, Banks or Financial Services) presented the lowest conversion rates, suggesting greater difficulty in engaging with service companies compared to industrial ones.
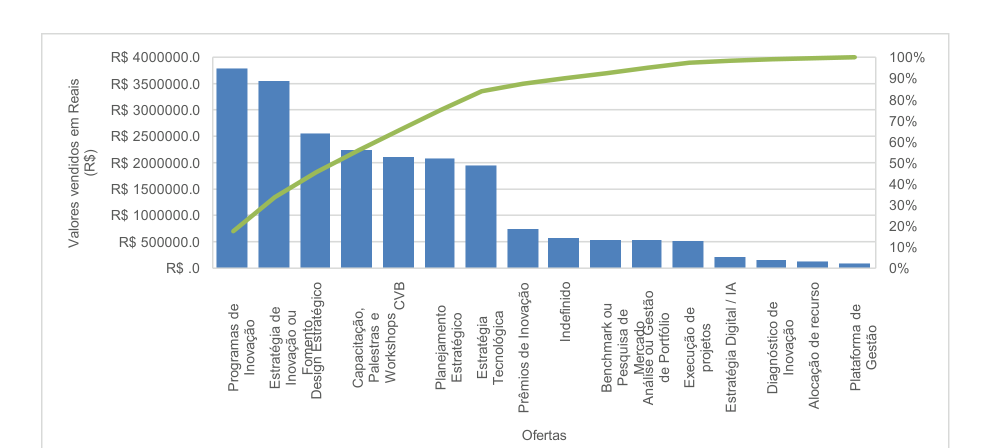
The Pareto Diagram in Figure 4 shows that six offerings were responsible for 80% of the consultancy’s total revenue: Innovation Program (17%), Innovation or Funding Strategy (16%), Strategic Design (12%), Training, Lectures and Workshops (10%), CVB (10%), and Strategic Planning (10%). The Innovation or Funding Strategy and Innovation Programs offerings represented the largest volume of negotiation in reais, with 22% and 21% of the total amount, respectively. The “innovation” projects were the consultancy’s “flagship”, with the “business” category in second place and “digital” with little representation.
Figure 4 – Values sold in Reais (R$) per Offer
Source: Original research results
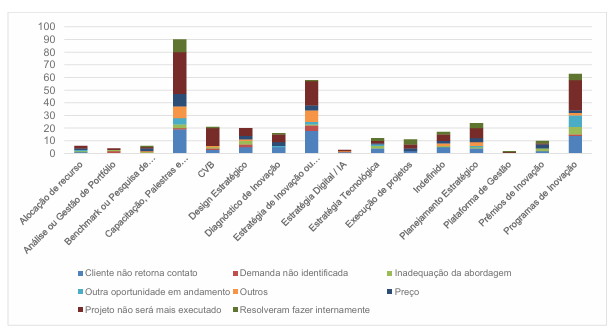
Although “Innovation Programs” and “Innovation or Promotion Strategy” had the largest share of revenue, Figure 5 indicates that they also registered many losses, mainly due to the buyer company’s withdrawal from project execution, which represents a risk to revenue. The offer of “Training, Lectures, and Workshops” also presented the highest number of lost negotiations, with clients withdrawing from contact or not returning.
Figure 5 – Number of lost projects considering Supply and Reason for Loss
Source: Original research results
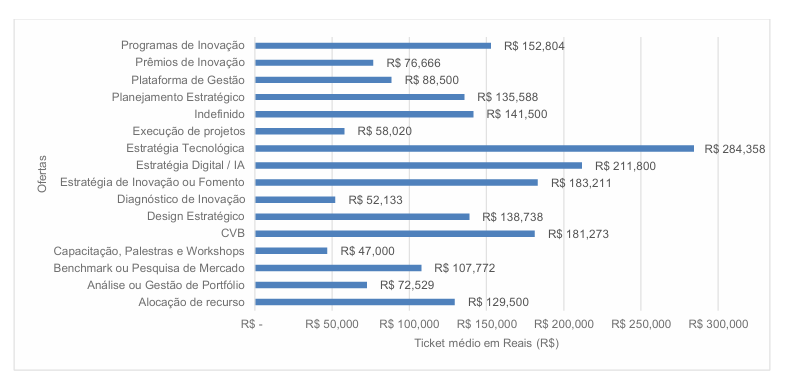
The main reason for contract loss was “Project will no longer be executed”. Losses due to price were distributed among the bids, with more cases in Training, Lectures, and Workshops (10), suggesting an opportunity for price review. The strategy of boosting the “Training, Lectures, and Workshops” offering may be interesting, as shown in Figure 6, as it represents an entry point with a low average ticket (around R$ 47,000.00), but with potential for projects of higher added value.
Figure 6 – Average ticket realized in Reais (R$) per Offer
Source: Original research results
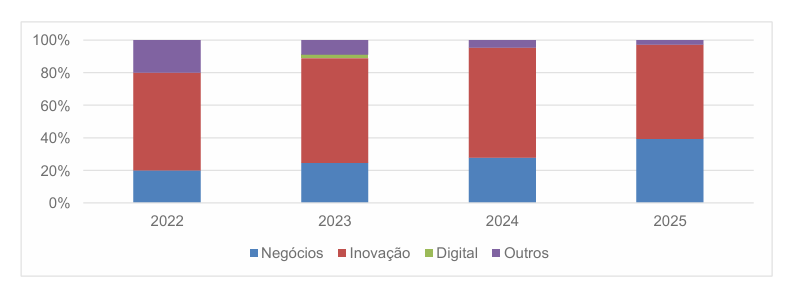
Figure 7 shows a variation in the composition of projects sold over the last four years. Offers classified as “Others” decreased from 20% in 2022 to 3% in 2025. “Digital” offers appeared in 2023 (about 2% of projects) but not in the following years. Innovation offers maintained their relevance, representing about 60% of projects sold, while offers categorized as “Business” jumped from 20% to 40%.
Figure 7 – Sales of projects by offering category
Source: Original research results
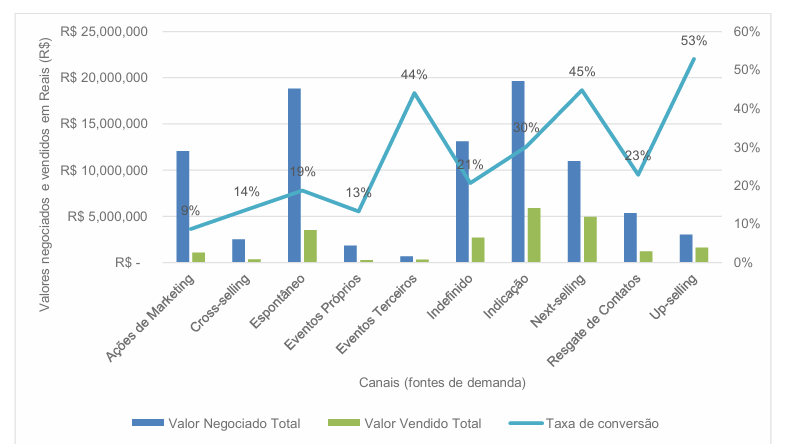
The average conversion rate for the period was 24%. Figure 8 highlights that “Marketing Actions”, “Own Events”, “Cross-selling”, and “Spontaneous” converted poorly into revenue. On the other hand, “Up-selling”, “Next-selling”, and “Third-party Events” were fundamental channels for business conversion. This suggests that up-selling and next-selling strategies are more effective in conversion than cold prospecting channels, confirming the hypothesis that strategies based on the client portfolio are more effective.
Figure 8 – Negotiated and sold value in Reais (R$) by Channel and Conversion Rate (%)
Source: Original research results
Model Application
To determine the isolated impact of each factor on the probability of winning, binary logistic regression was applied. The model used the variables Offer, Demand source, Value, Sector, and Creation Month, with Status (won or lost) as the dependent variable. Categorical variables were handled by dummy coding, and the reference categories were: November (creation month), own events (demand source), innovation programs (offer type), and electrical energy (client sector).
The model presented the following performance results, according to Table 3:
Table 3 – Results of the first application of Logistic Regression
| Metric | Value | Interpretation |
|---|---|---|
| Accuracy | 0,7117 | Total proportion of correct model predictions (gain and loss) |
| No Information Rate | 0,6626 | Reference point |
| P-Value | 0.1060 | Tests if the model is statistically better than the baseline |
| Sensitivity | 0,4727 | Ability to correctly identify earned opportunities |
| Specificity | 0,8333 | Ability to correctly identify missed opportunities |
| Positive Predictive Value (precision) | 0,5909 | Proportion of correct “gain” predictions |
| Negative Predictive Value | 0,7563 | Proportion of correct “lost” predictions |
| AUC (ROC) | 0,6601 | General discrimination capacity of the model |
| Balanced Accuracy | 0,6530 | Average between sensitivity and specificity |
| Kappa | 0,3219 | Degree of agreement beyond chance |
Source: Original results of the work
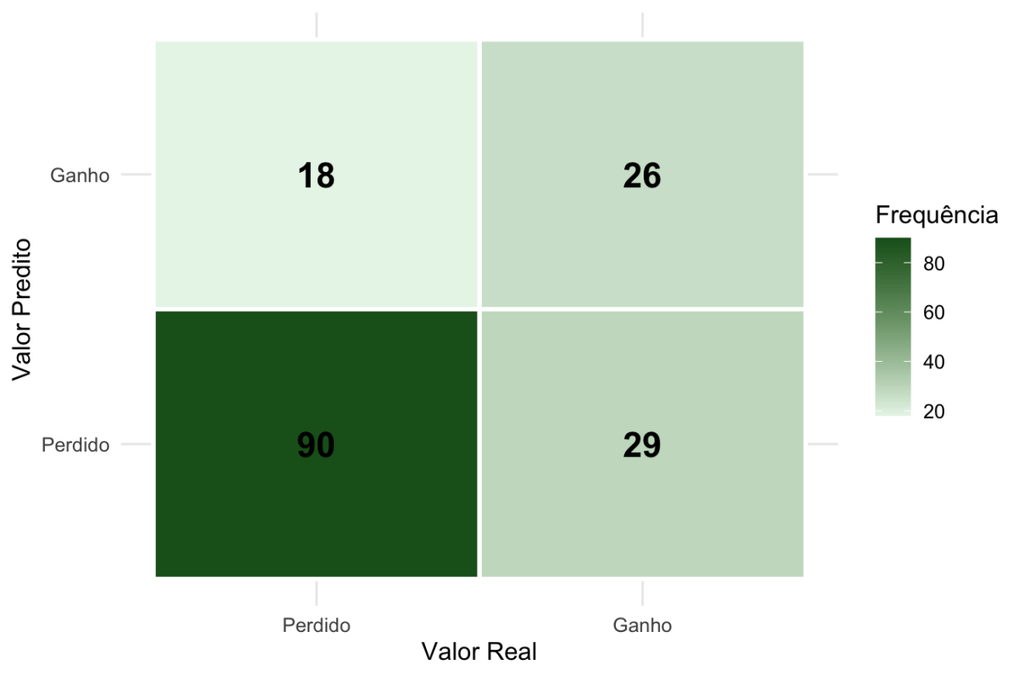
The model achieved an accuracy of approximately 71%, superior to the baseline (No Information Rate of 66%), indicating a predictive gain. However, the p-value of 0.106 suggests that this difference is not statistically significant at the 5% level, demanding caution in interpretation. The model’s sensitivity was 47%, indicating that less than half of the earned opportunities were correctly identified, which may underestimate high-conversion opportunities. In contrast, the specificity was 83%, showing good performance in identifying missed opportunities.
The model’s precision was 59%, meaning that slightly more than half of the opportunities classified as “won” materialized. This indicates a relevant proportion of false positives, which can lead to business decisions based on overestimated expectations. The confusion matrix in Figure 9 illustrates this model’s difficulty in correctly predicting wins.
Figure 9 – Confusion matrix
Source: Original research results
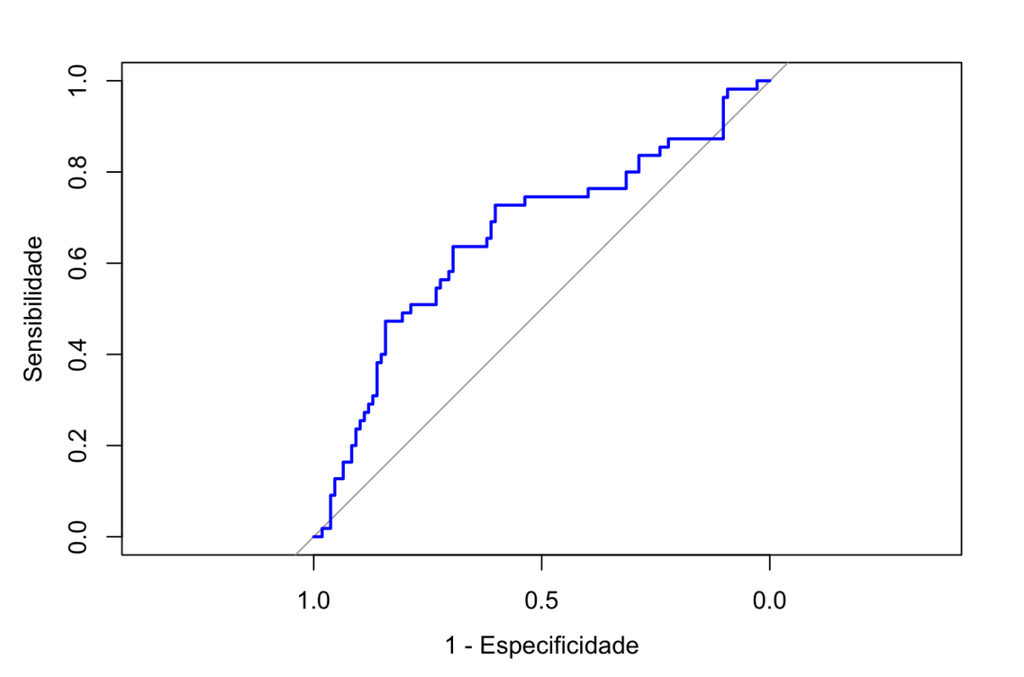
The area under the ROC curve (AUC) was approximately 0.66, as shown in Figure 10, indicating moderate discriminatory ability. This means that the model can distinguish, to some extent, between gain and loss opportunities, but has not yet achieved robust performance for critical predictive applications. This scenario is reinforced by the balanced accuracy of 65.3% and a Kappa coefficient of 0.32. From a business perspective, a relevant rate of false negatives (opportunities classified as “lost” that would have been “gained”) can lead to neglecting opportunities with real conversion potential, resulting in revenue loss.
Figure 10 – Area under the ROC curve (AUC)
Source: Original research results
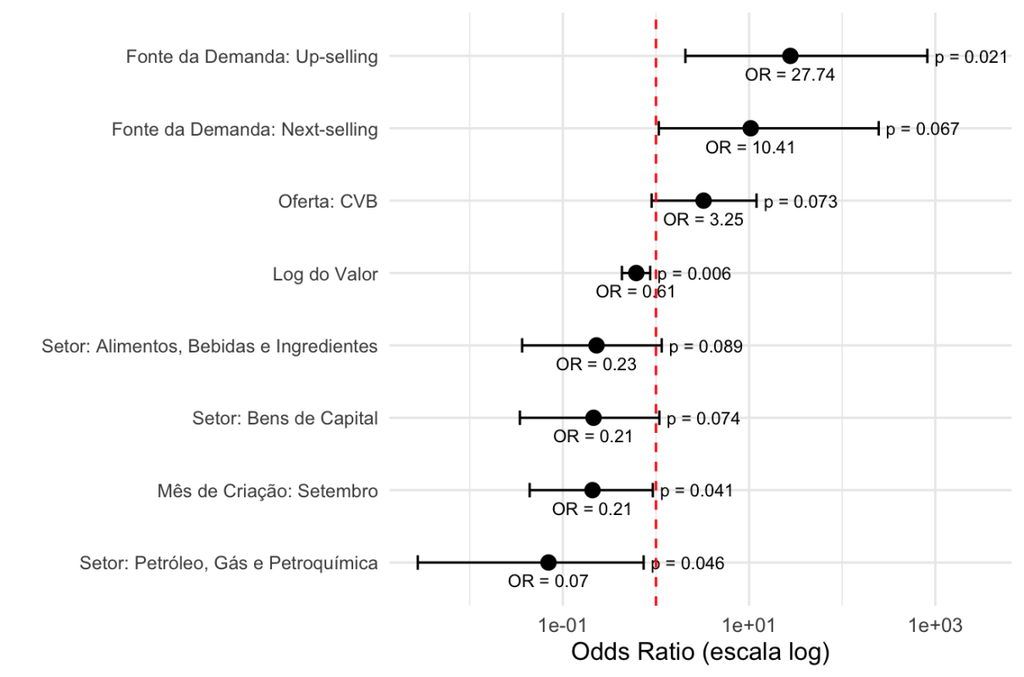
Despite the limitations, some relevant patterns were extracted. Figure 11, a Forest Plot of Odds Ratios, highlights the effect of the explanatory variables with greater statistical significance (p-value < 0.1) on the probability of commercial “gain”.
Figure 11 – Forest Plot of Odds Ratios for categories with a maximum p-value of 0.1
Source: Original research results
The “Source of demand” variable showed the most relevant effects on the probability of gain, especially for commercial strategies related to the customer base. Up-selling had an odds ratio of approximately 27.7 (p < 0,05), indicando que oportunidades via up-selling têm uma chance 27 vezes maior de fechar negócio do que via Eventos Próprios. O next-selling também mostrou um efeito positivo relevante (odds ratio ≈ 10,4), com significância marginal (p < 0,1). Negócios por “Indicação” apresentaram odds ratio de aproximadamente 5,42, mas sem relevância estatística (p-valor > 18%). These findings suggest that strategies based on relationships with existing customers are significantly more effective than traditional prospecting approaches, although the latter are necessary to attract new customers at the beginning of the funnel.
Regarding the offer variables, the “CVB” offer showed a marginally significant positive effect (p < 0.1), suggesting a higher chance of conversion. However, other categories presented extreme or near-zero coefficients, with high standard errors, indicating possible perfect separation issues due to data limitation or uniform outcome. When analyzing the CVB offer with the loss reasons, most lost deals were because the project would no longer be executed (about 67% of the time). This suggests the need for further investigation to understand cancellations and possibly help the client build a business case to support approval.
Some variables presented Odds Ratios lower than 1, indicating a negative impact on the probability of conversion. The log of the opportunity value suggests that higher value deals tend to have a lower probability of closing, possibly due to greater complexity and longer sales cycles, which aligns with the hypothesis that proposals with higher values have a lower chance of being closed. This trade-off between average ticket size and conversion probability is essential for effective sales pipeline management.
Regarding the sectors, most did not show statistical significance, with the exception of Oil, Gas and Petrochemicals, which had a significant negative effect (odds ratio ≈ 0.07), indicating a lower probability of conversion compared to the Electric Energy sector. This may reflect specific characteristics of these markets, such as technical rigor or competition. Other sectors, such as “Food, Beverages and Ingredients” and “Capital Goods”, showed negative effects with marginal significance. Thus, the hypothesis that sectors such as Agribusiness and Electric Energy would have a higher chance of success was not completely validated, as most sectors showed low statistical relevance.
The creation month variable showed few relevant effects, with the month of September standing out with a significant negative effect (odds ratio ≈ 0.21), indicating a lower probability of conversion compared to November. Thus, the hypothesis about more promising periods for closing deals was not fully validated with the available data.
In summary, the proposed model allowed the identification of relevant patterns associated with the conversion of commercial opportunities, highlighting the role of the demand source, especially in up-selling and next-selling strategies. The results reinforce the importance of the relationship with the customer base as a central revenue generation lever, while also evidencing limitations associated with higher-value opportunities and certain business sectors. Higher-value opportunities or those from sectors with lower conversion propensity may require differentiated approaches, such as greater prior qualification or proposal customization. Managerially, the findings suggest a more segmented commercial approach, prioritizing the expansion of existing customers for short-term returns, and maintaining prospecting initiatives for long-term pipeline sustainability. The model also highlights the importance of improving the quality and granularity of commercial data, especially in categories with low representation, to reduce statistical problems and increase the robustness of inferences. Although the model presents moderate predictive capacity, its results already allow for more informed commercial decisions, contributing to the efficient allocation of resources and the increased effectiveness of sales strategies.
4. Conclusion
This study sought to develop and validate a predictive classification model, based on logistic regression, to estimate the probability of conversion of new business in a Brazilian services consultancy. It was found that the application of the model allowed the identification of relevant patterns associated with commercial success, with the source of demand standing out as a determining factor. It was observed that strategies based on the client portfolio, such as up-selling and next-selling, showed a significant positive association with business conversion, indicating greater effectiveness compared to cold prospecting channels. On the other hand, it was identified that higher value opportunities and those from certain sectors, such as Oil, Gas, and Petrochemicals, tend to have a lower probability of closing. These findings offer a managerial contribution by translating historical CRM data into practical drivers, assisting leadership in prioritizing commercial efforts and formulating more segmented and effective sales strategies.
Although the model demonstrated moderate predictive capability, with an accuracy of approximately 71% and an AUC of 0.66, and outperformed the baseline, a limitation in sensitivity was noted, resulting in a relevant rate of false negatives, underestimating high conversion opportunities. The study’s limitations include the quality and granularity of historical data, as well as the inherent complexity of the business conversion phenomenon, which prevents inferring direct causality. It is recommended that the model be used as a complement to managerial judgment, not as a substitute. For future studies, it is suggested to explore new variables, apply more advanced modeling techniques, and incorporate a larger volume of data, aiming to improve predictive performance and broaden the model’s practical applicability in the consultancy’s commercial management.
Bibliographic References
James, G.; Witten, D.; Hastie, T.; Tibshirani, R. An Introduction to Statistical Learning: with Applications in R. 2. ed. New York: Springer, 2021. Disponível em: https://www.casact.org/sites/default/files/2022-12/James-G.-et-al.-2nd-edition-Springer-2021.pdf. Acesso em 10 out. 2025.
Laney, Doug. 3D Data Management: Controlling Data Volume, Velocity and Variety. META Group Research Note, 2001. Disponível em: https://blogs.gartner.com/doug-laney. Acesso em: 10 out. 2025.
Mitchell, Tom M. Machine Learning. New York: McGraw-Hill, 1997. Disponível em: https://www.cs.cmu.edu/~tom/files/MachineLearningTomMitchell.pdf. Acesso em: 10 out. 2025.
Pinheiro, C. (2024). A relevância da ciência de dados nos negócios disponível em https://mittechreview.com.br/ciencia-de-dados-nos-negocios/?srsltid=AfmBOoq9oCqoh1zwb5cB19sAMdfMRs-6SRTnIc497h1ZFhmeOqHH8Xvb. Acesso em 11 out. 2025.
Article originating from the Course Conclusion Work of the Specialization in Data Science and Analytics of the MBA USP/Esalq
To learn more about the course, click here and access the MBX Academy platform