
September 15, 2026
Unsupervised Methods Applied to Industrial Ethanol Producing Yeasts of First and Second Generations
Luciana Souto Mofatto; Cleverson Henrique de Freitas
DOI: 10.22167/2675-6528-202602264
Article derived from a Final Course Work (TCC), with content based on the student’s original work and adapted to the editorial format of the Revista E&S with the support of the ResumeAI tool, an artificial intelligence solution developed by the Pecege Institute for textual synthesis and organization.
Summary
The understanding of molecular mechanisms in ethanol production is crucial for industrial optimization, given its consolidation as a sustainable alternative. The study evaluated the transcriptomic profiles of industrial yeasts Saccharomyces cerevisiae “Pedra-2” in first-generation (1G) and second-generation (2G) ethanol production, at different fermentation times, using unsupervised methods. Public RNA-seq data were employed, subjected to quality control, pre-processing, genomic alignment, and transcript quantification in TPM. Analyses included Pearson correlation, Principal Component Analysis (PCA), Factor Analysis of Mixed Data (FAMD), and hierarchical clustering. The results revealed a clear separation between the gene expression profiles of 1G and 2G, with the type of fermentation as the main factor of variability. The 1G samples exhibited greater temporal organization and stability, while the 2G samples showed greater heterogeneity and metabolic complexity. Differences in metabolic pathways associated with carbon flux were identified, with glycolysis predominating in 1G and greater participation of the pentose phosphate pathway and the tricarboxylic acid cycle in 2G. It was concluded that unsupervised methods were effective in identifying relevant biological patterns, contributing to the understanding of metabolic differences between the processes and offering support for optimization strategies in ethanol production.
Keywords: Machine learning; Bioinformatics; Gene expression; Fermentation; Transcriptome.
1. Introduction
The growing demand for renewable energy sources has driven the production of ethanol as a sustainable alternative to fossil fuels (Goldemberg, 2008). Brazil stands out as one of the largest global producers, using sugarcane as the main raw material due to its high yield and economic viability (Basso et al., 2011; Renewable Fuels Association, 2024; Wheals et al., 1999). Government programs and investments in research and development, such as Proálcool, FAPESP’s BIOEN program, and the National Laboratory for Biorenewables (LNBR), have been fundamental to the advancement and consolidation of the sector (Leite et al., 2009; Roman, 2010).
The production of ethanol occurs through the fermentation of sugars, a process in which yeasts convert glucose into ethanol and carbon dioxide (Basso et al., 2011). The species Saccharomyces cerevisiae is widely used in industrial fermentations due to characteristics such as high cell viability, genetic conservation capacity, tolerance to high concentrations of ethanol and carbohydrates, and resistance to multiple fermentation cycles and temperature variations (Dequin, 2001). Brazilian industrial strains, such as “Pedra-2” and “CAT-1”, are examples of strains that exhibit these qualities (Argueso et al., 2009; Basso et al., 2008; Della-Bianca et al., 2013).
Ethanol is classified into generations, with the first generation (1G) being obtained from the fermentation of sucrose present in sugarcane juice. This is a consolidated process, with high productivity and which does not require pre-treatment of the raw material. However, 1G ethanol production faces challenges such as the seasonality of sugarcane and competition with sugar production. Sugarcane genetic improvement and optimization of industrial processes are strategies adopted to mitigate these limitations (Goldemberg, 2008; Leite et al., 2009).
In contrast, second-generation (2G) ethanol emerges as a promising alternative, utilizing lignocellulosic residues, such as sugarcane bagasse and straw, to enhance biomass utilization and sector sustainability (Lynd et al., 2005). This process involves the conversion of cellulose and hemicellulose into fermentable sugars through enzymatic or acidic hydrolysis. However, Saccharomyces cerevisiae does not naturally metabolize pentoses, sugars abundant in hemicellulose, which limits the efficiency of the 2G fermentation process (Matsushika et al., 2009).
To overcome the limitations of 2G ethanol, metabolic engineering has been used to genetically modify yeasts, allowing the consumption of hexoses and pentoses (xylose, arabinose) and thus enabling the production of 2G ethanol (Matsushika et al., 2009). Strategies include the introduction of reductive/oxidative and isomerization metabolic pathways, as well as the combination of genes from microorganisms such as Escherichia coli and Pichia stipitis (Karhumaa et al., 2007). Overexpression of sugar transporters also improves pentose uptake and metabolism, increasing productivity (Basso et al., 2011). Furthermore, evolutionary engineering enhances characteristics such as tolerance to ethanol, high temperatures, and toxic compounds, selecting more robust strains to reduce costs and increase efficiency (Della-Bianca et al., 2013; Basso et al., 2011; Leite et al., 2009).
Bioinformatics plays a crucial role in yeast engineering, aiding in genomic analysis and the identification of genes related to fermentation. DNA and RNA sequencing techniques, along with computational modeling, allow for a deep understanding of microbial physiology and optimize genetic modifications (Abreu-Cavalheiro and Monteiro, 2014; Buschke et al., 2013). RNA sequencing is particularly important for detecting changes in gene expression under different conditions. Previous studies have already employed this technique to evaluate the gene profiles of industrial yeasts during the production of 1G and 2G bioethanol (Carvalho-Netto et al., 2015; Carvalho et al., 2021).
Together with bioinformatics, machine learning has been widely applied in the structural prediction of proteins, the analysis of their interactions, and the evaluation of gene expression. As part of artificial intelligence, machine learning uses statistical models and algorithms that “learn” from data (Yousef and Allmer, 2023). In the context of gene expression, machine learning methodologies are implemented to predict variations in expression levels, such as the application of Bayesian networks based on the k-means clustering algorithm to identify patterns (Al Taweraqi and King, 2022).
Despite significant advances, challenges such as the complexity of hydrolysis and fermentation processes, high enzyme costs, and the need for greater efficiency in pentose conversion persist (Della-Bianca et al., 2013). The integration of metabolic and evolutionary engineering, allied with bioinformatics and machine learning, represents a promising approach to overcome these limitations (Karhumaa et al., 2007). In this context, the present work aims to perform analyses, using unsupervised methods, to evaluate different transcriptional profiles and gene expression variations, from already published data (Carvalho-Netto et al., 2015; Carvalho et al., 2021), of Saccharomyces cerevisiae yeast “Pedra-2” under industrial-scale 1G and 2G ethanol fermentation conditions.
2. Material and Methods
Data collection
Transcriptome data were obtained in FASTQ format from the “Sequence Read Archives Database” [SRA] repository (2009) (https://www.ncbi.nlm.nih.gov/sra/). These data, from Next Generation Sequencing of short reads generated by “Illumina” equipment (Cock et al., 2010), contain nucleotide sequences and quality scores.
For the first-generation industrial yeasts Saccharomyces cerevisiae [PE-2] [1G], data were collected in 2009, directly from the fermentation tanks of a distillery in Maracaí, São Paulo, Brazil, according to the article by Carvalho-Netto et al. (2015) (“BioProject number” “PRJNA172193”). Samples of “Typical fermentation” were obtained at 1h, 4h, 7h, 10h, 12h, and 15 hours of fermentation.
For yeasts that ferment 2G ethanol, data were obtained from the article by Carvalho et al. (2021) (“BioProject number” “PRJNA667443”), identified as “Industrial fermentation”. Samples were collected in December 2016, directly from the fermentation tank of a plant in São Miguel dos Campos, Alagoas, Brazil, at 7h, 12h, 16h, and 24 hours of fermentation. The [2G] ethanol production used a lignocellulosic hydrolysate, obtained from hydrothermal pretreatment on sugarcane straw. Table 1 details the identification, fermentation type, replicate, and description of the experiments.
Table 1. Description of transcriptome variables referring to industrial yeasts subjected to different fermentation times, for the production of first [1G] and second [2G] generation ethanol
| ID | Fermentation type (1G / 2G) | Replica | Description |
|---|---|---|---|
| TF1_1G_1h | 1G | Unique | Industrial yeasts (traditional fermentation [TF]), collected within 1 hour. |
| TF2_1G_4h | 1G | Unique | Industrial yeasts (traditional fermentation [TF]), collected in a vat within 4 hours |
| TF3_1G_7h | 1G | Unique | Industrial yeasts (traditional fermentation [TF]), collected over a 7-hour period |
| TF4_1G_10h | 1G | Unique | Industrial yeasts (traditional fermentation [TF]), collected over a 10-hour period |
| TF5_1G_12h | 1G | Unique | Industrial yeasts (traditional fermentation [TF]), collected in the 12-hour period |
| TF6_1G_15h | 1G | Unique | Industrial yeasts (traditional fermentation [TF]), collected in the 15-hour period |
| F1_2G_7h | 2G | 1 | Industrial yeasts (sugarcane bagasse fermentation [F]), collected from the vat 7 hours after pitching |
| F5_2G_7h | 2G | 2 | Industrial yeasts (sugarcane bagasse fermentation [F]), collected over a period of 7 hours |
| F6_2G_7h | 2G | 3 | Industrial yeasts (sugarcane bagasse fermentation [F]), collected over a period of 7 hours |
| F1_2G_12h | 2G | 1 | Industrial yeasts (sugarcane bagasse fermentation [F]), collected within 12 hours |
| F5_2G_12h | 2G | 2 | Industrial yeasts (sugarcane bagasse fermentation [F]), collected within 12 hours |
| F6_2G_12h | 2G | 3 | Industrial yeasts (sugarcane bagasse fermentation [F]), collected within 12 hours |
| F1_2G_16h | 2G | 1 | Industrial yeasts (sugarcane bagasse fermentation [F]), collected in the 16-hour period |
| F5_2G_16h | 2G | 2 | Industrial yeasts (sugarcane bagasse fermentation [F]), collected in the 16-hour period |
| F6_2G_16h | 2G | 3 | Industrial yeasts (sugarcane bagasse fermentation [F]), collected in the 16-hour period |
| F1_2G_24h | 2G | 1 | Industrial yeasts (sugarcane bagasse fermentation [F]), collected in the 24-hour period |
| F5_2G_24h | 2G | 2 | Industrial yeasts (sugarcane bagasse fermentation [F]), collected in the 24-hour period |
| F6_2G_24h | 2G | 3 | Industrial yeasts (sugarcane bagasse fermentation [F]), collected in the 24-hour period |
Source: Original research results
Data Treatment
The data underwent quality analysis with the software “FastQC” v0.11.4 (Andrews, 2010). The adapter sequences from “Illumina” sequencing were removed using “Trimmomatic” v0.39 (Bolger et al., 2014).
For the quantification of transcripts, the data were aligned against the gene sequences of the laboratory yeast Saccharomyces cerevisiae S288c from the “Saccharomyces Genome Database” [SGD] (2007) (https://www.yeastgenome.org/), and 23 genes specific to “Stone-2” [PE-2] (Argueso et al., 2009), totaling 5,938 genes. Quantification was performed by the software “Kallisto” v0.44 (Bray et al., 2016), with parameters “-k 31 -b 100”. For “single-end reads” (industrial ethanol yeasts [1G]), the parameters “-I 150 -s 0.01” were used. A final table with all data in Transcripts Per Million [TPM] was generated for unsupervised analyses.
Normalized [TPM] is calculated by dividing the count of “reads” by the length of the “gene” (in “kilobases”) to obtain “reads” per “kilobase” [RPK], and then dividing all [RPK] values by 1,000,000. This normalization considers the length of the “gene” and the sequencing depth, resulting in the same sum of [TPM] for each sample (Zhao et al., 2021).
Unsupervised data analysis
To compare the expression data between industrial [1G] and [2G] fermentation yeasts, unsupervised data methodologies were used to identify organization, patterns, similarities, and differences. Methods included Pearson Correlation, Principal Component Analysis [PCA], Factor Analysis of Mixed Data [FAMD] (Pagès, 2004), and agglomerative hierarchical clustering.
Pearson correlation analysis, with correlation matrix and heatmap, was generated by Python scripts, using the packages “pandas”, “numpy”, “pingouin”, and “plotly.graph_objects”.
For Principal Component Analysis [PCA], Python scripts were used with the packages “pandas”, “numpy”, “factor_analyzer”, and “matplotlib”. Bartlett’s Test of Sphericity was performed, and the number of principal components was evaluated by Kaiser’s Criterion. Table 2 presents the principal components, eigenvalues, and variances.
Table 2. Main components, eigenvalues, variance, and cumulative variance obtained from the expression data of industrial yeast transcriptomes at different fermentation times, for first [1G] and second [2G] generation ethanol production
| Principal Components | Eigenvalue | Explained Variance | Cumulative Variance |
|---|---|---|---|
| Component 1 | 11,9689 | 66,49% | 66,49% |
| Component 2 | 2,8776 | 15,99% | 82,48% |
| Component 3 | 1,3445 | 7,47% | 89,95% |
| Component 4 | 1,0451 | 5,81% | 95,76% |
Source: Original research results
Factor Analysis of Mixed Data [FAMD] was performed with scripts in the R language, using the libraries “ggplot2″, “dplyr”, “FactoMineR”, “factoextra”, “gridExtra” and “ggrepel”.
For agglomerative hierarchical clustering, Python scripts were employed with the packages “pandas”, “numpy”, “matplotlib”, “scipy.stats”, and “scipy”. The “complete linkage” method was used, applying Euclidean distance to all transcriptome data and to specific genes of carbon flux pathways affecting yeast metabolism. The metabolic pathways analyzed were: glycolytic pathway [GP], glycerol pathway [GR], pentose phosphate pathway [PPP], and the tricarboxylic acid cycle [TCA]. Table 3 lists the genes related to these pathways.
Table 3. Genes related to the metabolic pathways of carbon flux in industrial yeasts
| Metabolic Pathway | Genetic Units | Gene IDs | Gene Description |
|---|---|---|---|
| Glycolytic Pathway [GP] | GLK1 | YCL040W | Glucokinase |
| Glycolytic Pathway [GP] | HXK1 | YFR053C | Hexokinase isoenzyme 1 |
| Glycolytic Pathway [GP] | PGI1 | YBR196C | Glycolytic enzyme phosphoglucose isomerase |
| Glycolytic Pathway [GP] | FBP1 | YLR377C | Fructose-1,6-bisphosphatase |
| Glycolytic Pathway [GP] | PFK1 | YGR240C | Heterooctameric phosphofructokinase alpha subunit |
| Glycolytic Pathway [GP] | FBA1 | YKL060C | Fructose 1,6-bisphosphate aldolase |
| Glycolytic Pathway [GP] | TPI1 | YDR050C | Triose phosphate isomerase |
| Glycolytic Pathway [GP] | TDH1 | YJL052W | Glyceraldehyde-3-phosphate dehydrogenase (GAPDH), isozyme 1 |
| Glycolytic Pathway [GP] | PGK1 | YCR012W | 3-phosphoglycerate kinase |
| Glycolytic Pathway [GP] | PGM1 | YKL127W | Phosphoglucomutase, minor isoform |
| Glycolytic Pathway [GP] | ENO1 | YGR254W | Enolase I |
| Glycolytic Pathway [GP] | PYK2 | YOR347C | Pyruvate kinase |
| Glycolytic Pathway [GP] | PDC1 | YLR044C | Pyruvate decarboxylase |
| Glycolytic Pathway [GP] | ALD4 | YOR374W | Mitochondrial aldehyde dehydrogenase |
| Glycolytic Pathway [GP] | ALD5 | YER073W | Mitochondrial aldehyde dehydrogenase |
| Glycolytic Pathway [GP] | ADH1 | YOL086C | Alcohol dehydrogenase |
| Glycerol Pathway [GR] | GPD1 | YDL022W | NAD-dependent glycerol-3-phosphate dehydrogenase |
| Glycerol Pathway [GR] | GPD2 | YOL059W | NAD-dependent glycerol-3-phosphate dehydrogenase |
| Glycerol Pathway [GR] | GPP1 | YIL053W | Glycerol-1-phosphatase |
| Glycerol Pathway [GR] | GUT1 | YHL032C | Glycerol kinase |
| Pentose Phosphate Pathway [PPP] | ZWF1 | YNL241C | Glucose-6-phosphate dehydrogenase (G6PD) |
| Pentose Phosphate Pathway [PPP] | GND1 | YHR183W | 6-phosphogluconate dehydrogenase (decarboxylating) |
| Pentose Phosphate Pathway [PPP] | GND2 | YGR256W | 6-phosphogluconate dehydrogenase (decarboxylating) |
| Pentose Phosphate Pathway [PPP] | RPE1 | YJL121C | D-ribulose-5-phosphate 3-epimerase |
| Pentose Phosphate Pathway [PPP] | RKI1 | YOR095C | Ribose-5-phosphate ceto isomerase |
| Pentose Phosphate Pathway [PPP] | TKL1 | YPR074C | Transketolase |
| Pentose Phosphate Pathway [PPP] | TAL1 | YLR354C | Transaldolase |
| Tricarboxylic acid cycle [TCA] | PDA1 | YER178W | Alpha subunit E1 of the pyruvate dehydrogenase (PDH) complex |
| Tricarboxylic acid cycle [TCA] | PDB1 | YBR221C | Pyruvate dehydrogenase (PDH) complex beta subunit E1 |
| Tricarboxylic acid cycle [TCA] | LAT1 | YNL071W | Component of dihydrolipoyltransacetylase (E2) of the PDC |
| Tricarboxylic acid cycle [TCA] | PYC1 | YGL062W | Pyruvate carboxylase isoform |
| Tricarboxylic acid cycle [TCA] | CIT1 | YNR001C | Mitochondrial citrate synthase |
| Tricarboxylic acid cycle [TCA] | ADH1 | YOL086C | Alcohol dehydrogenase |
| Tricarboxylic acid cycle [TCA] | ADP1 | YCR011C | Putative ATP-dependent permease of the ABC transporter family. |
| Tricarboxylic acid cycle [TCA] | KGD1 | YIL125W | Mitochondrial alpha-ketoglutarate dehydrogenase complex subunit |
| Tricarboxylic acid cycle [TCA] | KGD2 | YDR148C | Di-hydrolipoyl transsuccinylase |
| Tricarboxylic acid cycle [TCA] | LSC1 | YOR142W | Alpha subunit of succinyl-CoA ligase |
| Tricarboxylic acid cycle [TCA] | LSC2 | YGR244C | Beta subunit of succinyl-CoA ligase |
| Tricarboxylic acid cycle [TCA] | SDH1 | YKL148C | Flavoprotein subunit of succinate dehydrogenase |
| Tricarboxylic acid cycle [TCA] | FUM1 | YPL262W | Fumarase enzymes |
| Tricarboxylic acid cycle [TCA] | MDH1 | YKL085W | Mitochondrial malate dehydrogenase |
| Tricarboxylic acid cycle [TCA] | ACO1 | YLR304C | Aconitase |
Source: Translated from Saccharomyces Genome Database [SGD] (2007)
3. Results and Discussion
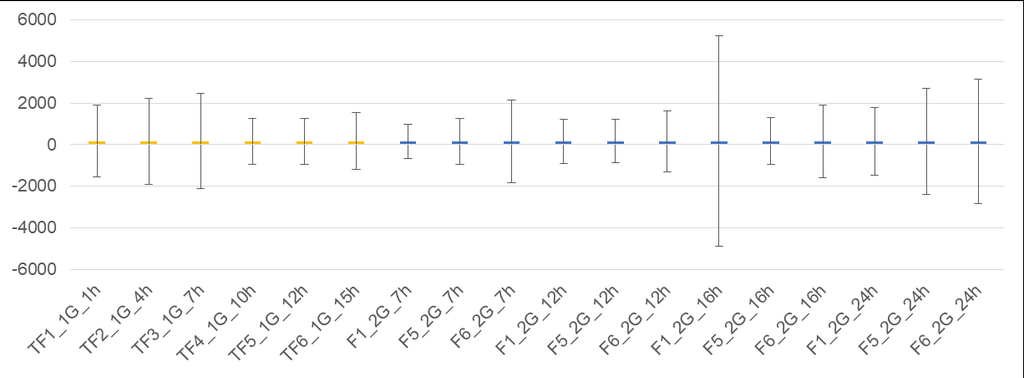
The descriptive statistical analysis of the data revealed that the gene expression means for all first-generation (1G) and second-generation (2G) yeast samples were close to 168.41. The standard deviations for the 1G samples ranged between 1,108.82 and 2,297.97, while for the 2G samples, the variation was from 829.04 to 5,064.89. The quartile 1 (25%) values for 1G were between 6.37 and 13.4, and for 2G, between 3.69 and 8.03. The maximum values for 1G ranged from 43,948 to 131,443, and for 2G, from 22,028.60 to 291,908. The uniformity of the means across all samples indicates that normalization of the data by Transcripts Per Million (TPM) was adequate, validating the comparability of the 1G (Carvalho-Netto et al., 2015) and 2G (Carvalho et al., 2021) data (Zhao et al., 2021).
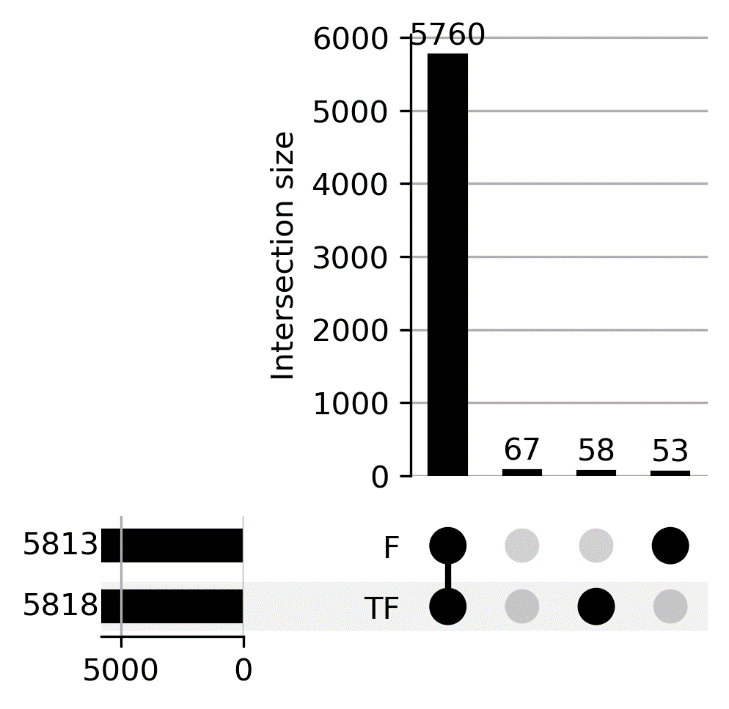
To identify the expressed genes, an upset plot (Venn Diagram) was generated (Figure 1). Of the 5,938 genes found, 5,760 were common to both fermentation groups (1G and 2G), 58 were exclusive to the 1G group, 53 exclusive to the 2G group, and 67 were absent in both. The presence of a large number of common genes suggests that the basic survival and fermentation machinery of Saccharomyces cerevisiae is maintained, despite differences in substrates (sugarcane broth for 1G and lignocellulosic hydrolysate for 2G) and temporal and metabolic stress dynamics.
Figure 1. Venn diagram (“upset”) containing the quantity of genes expressed in the transcriptome of industrial yeasts at different fermentation times, for the production of first [1G] (TF samples) and second [2G] generations (F samples) ethanol
Source: Original research results
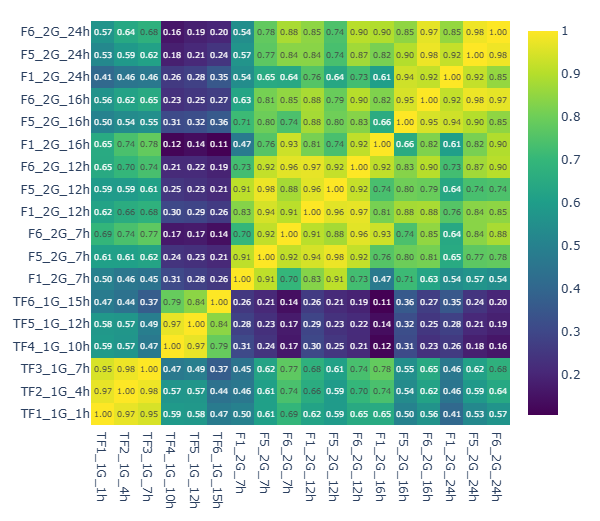
Pearson correlation analysis (Figure 2) revealed distinct groupings in the gene profiles. The 1G yeast samples formed two groups: one with 1h, 4h, and 7h of fermentation (correlation coefficient r > 0.95) and another with 10h, 12h, and 15h (r > 0.79). In the 2G samples, the 16h and 24h replicates showed lower correlation with the F1_2G_7h sample (r < 0.70 and 0.54, respectively). The F1_2G_24h sample also showed lower correlations with the 7h (r < 0.65) and 16h (r < 0.76) samples. All correlations were statistically significant (p < 0.05).
Figure 2. Heatmap referring to Pearson correlation methods on all genes obtained from the transcriptome data of fermentations [1G] (samples [TF]) and [2G] (samples [F]), at different collection periods. All correlations were significant (p-value < 0.05)
Source: Original research results
Principal Component Analysis (PCA) was applied to reduce data dimensionality and analyze variance. Bartlett’s Test of Sphericity (chi-square = 312,811.59, p < 0.05) indicated the adequacy of the correlation matrix. Four principal components (PCs) with eigenvalues greater than 1 were extracted, explaining 95.76% of the total data variance. Component 1 explained 66.49% of the variance, followed by Component 2 with 15.99%, Component 3 with 7.47%, and Component 4 with 5.81%.
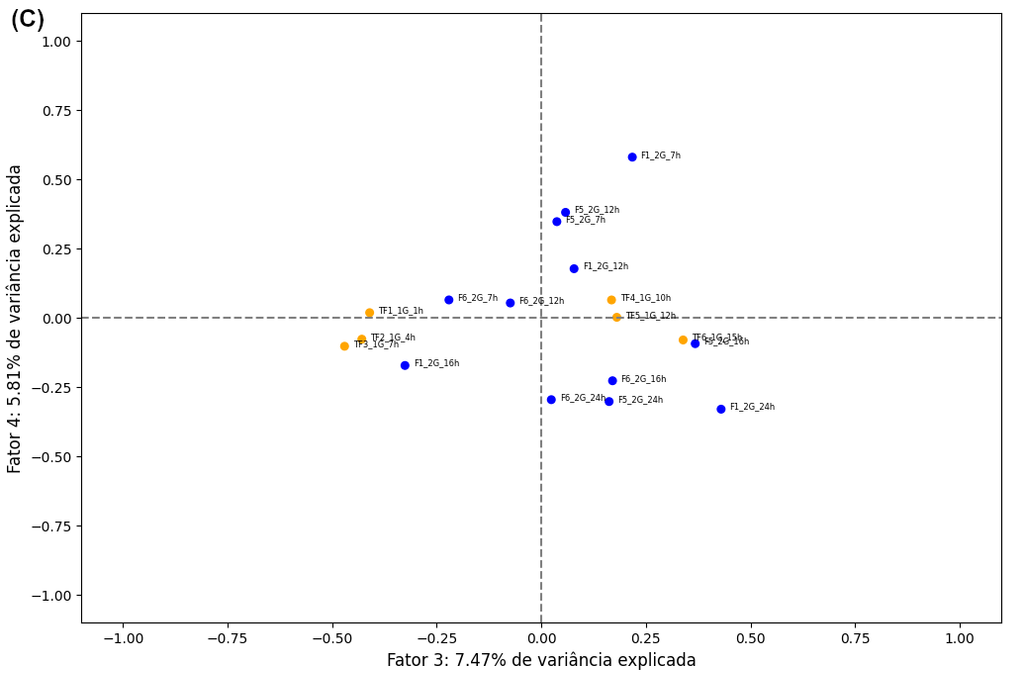
The factorial loadings (Figure 3) from PCA showed distinct groupings, with a clear separation between the 1G and 2G yeast samples, especially in Figure 3A, where PC1 explains the majority of the variance (66.49%). This finding indicates that the fermentation type is the main transcriptional differentiation factor between the samples.
Figure 3. “Loading plots” obtained from the factor loadings of industrial yeast transcriptome data subjected to first [1G] and second [2G] generation ethanol fermentations. (A) Factor 1 (PC1) x Factor 2 (PC2); (B) Factor 2 (PC2) x Factor 3 (PC3); and (C) Factor 3 (PC3) x Factor 4 (PC4)
Source: Original research results Note: Orange points: 1G; blue points: 2G
Hierarchical clustering by “complete linkage”
Agglomerative hierarchical clustering, using the “complete linkage” method and Euclidean distance, grouped the industrial yeast samples according to the type of ethanol production (Figure 4), resulting in five distinct groups with a cut-off at a Euclidean distance of 60. The 1G samples were grouped based on fermentation time (final times on the left and initial times on the right of the dendrogram), while the 2G samples did not follow a clear temporal pattern, showing greater transcriptomic heterogeneity.
Figure 4. Dendrogram generated from the hierarchical clustering by “Complete Linkage” of transcriptome data from all 5,938 industrial yeast genes subjected to different fermentation times for the production of first-generation [1G] (samples [TF]) and second-generation [2G] (samples [F]) ethanol
Source: Original research results
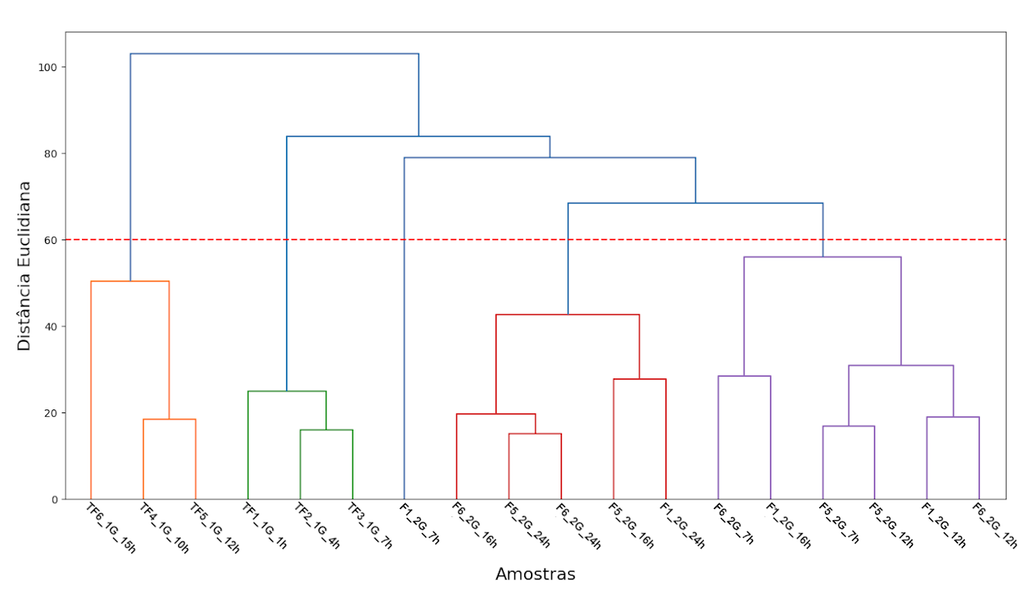
The analysis of specific genes of the glycolytic pathway (GP) (Table 5) also separated the yeasts by ethanol type (Figure 5), with two main groups defined by a cut-off at 6 Euclidean distance. The 1G samples were grouped by fermentation time (initial: 1h, 4h, 7h, 10h; final: 12h, 15h). The 2G samples, in turn, were distributed into three subgroups according to fermentation time, with one exclusive for 7h and the others grouping 12h, 16h, and 24h.
Table 5. Genes related to the carbon flux metabolic pathways in industrial yeasts
Source: Translated from Saccharomyces Genome Database [SGD] (2007)
Figure 5. Dendrogram generated from hierarchical clustering by “Complete Linkage” of transcriptome data from genes specific to the Glycolytic Pathway [GP] of industrial yeasts subjected to different fermentation times for first [1G] (TF samples) and second [2G] (F samples) generation of ethanol
Source: Original research results
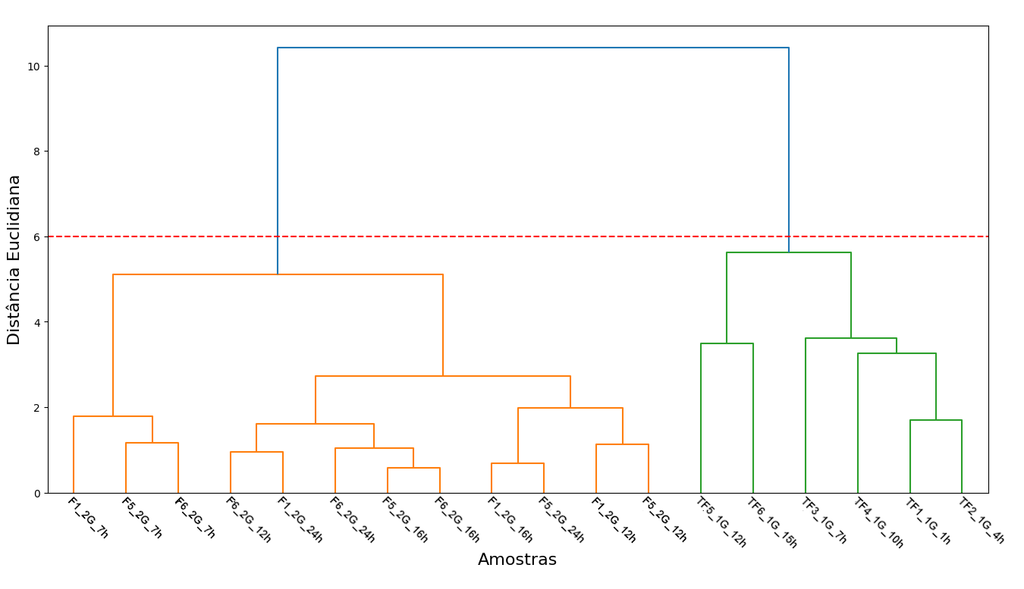
For the genes of the glycerol route (GR) (Table 5), hierarchical clustering (Figure 6) formed three clusters with a cut-off at a Euclidean distance of 3. Two groups corresponded to the 1G yeasts, separated by fermentation time (1h, 4h, 10h in one group; 12h, 15h in another). The third group was composed of the 2G samples. Notably, the TF2_1G_7h sample (1G, 7h) clustered with the 2G yeasts at the same time (7h), suggesting distinct transcriptomic behavior.
Figure 6. Dendrogram generated from the hierarchical clustering by “Complete Linkage” of transcriptome data of specific genes of the Glycerol [GR] Pathway from industrial yeasts subjected to different times of first [1G] (TF samples) and second [2G] (F samples) generation fermentations
Source: Original research results
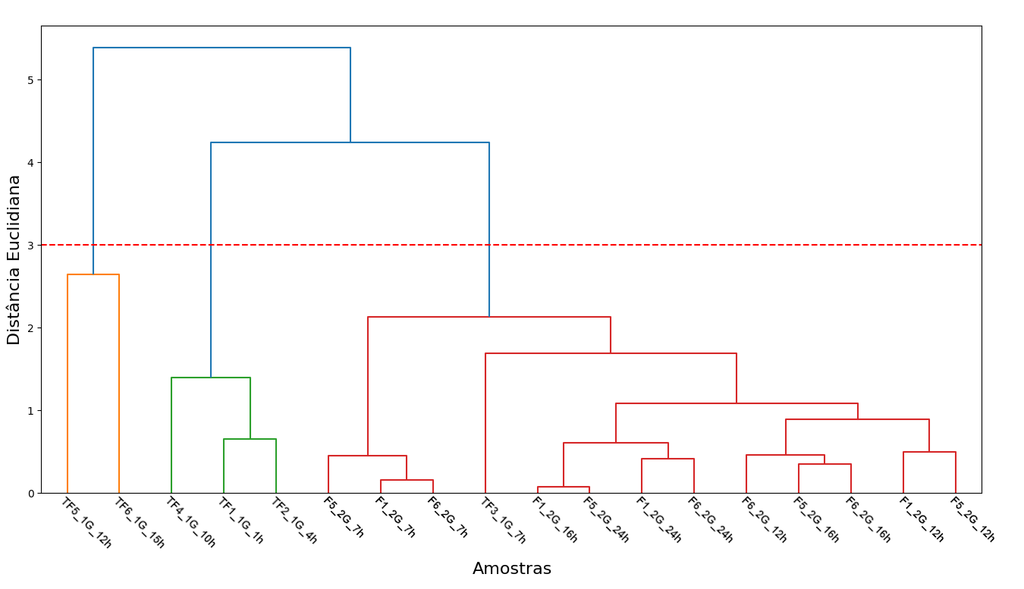
In the analysis of the pentose phosphate pathway (PPP) genes (Table 5), hierarchical clustering (Figure 7) resulted in four distinct groups with a cut-off at a Euclidean distance of 3. The first group included 2G samples from 7h and 12h. The second and third groups represented the 1G yeasts, grouped by fermentation time (final times: 10h, 12h, 15h; and initial times: 1h, 4h, 7h). The last group gathered 2G samples at the final fermentation times (12h, 16h, 24h).
Figure 7. Dendrogram generated from the hierarchical clustering by “Complete Linkage” of transcriptome data of specific genes of the Pentose Phosphate Pathway [PPP] of industrial yeasts subjected to different fermentation times for first [1G] (TF samples) and second [2G] (F samples) generation ethanol production
Source: Original research results
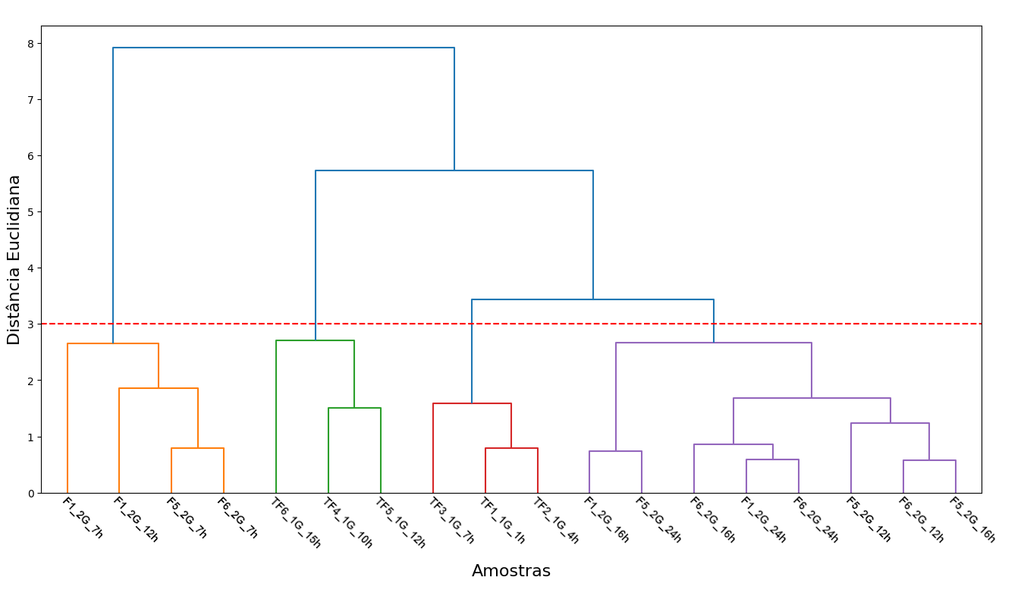
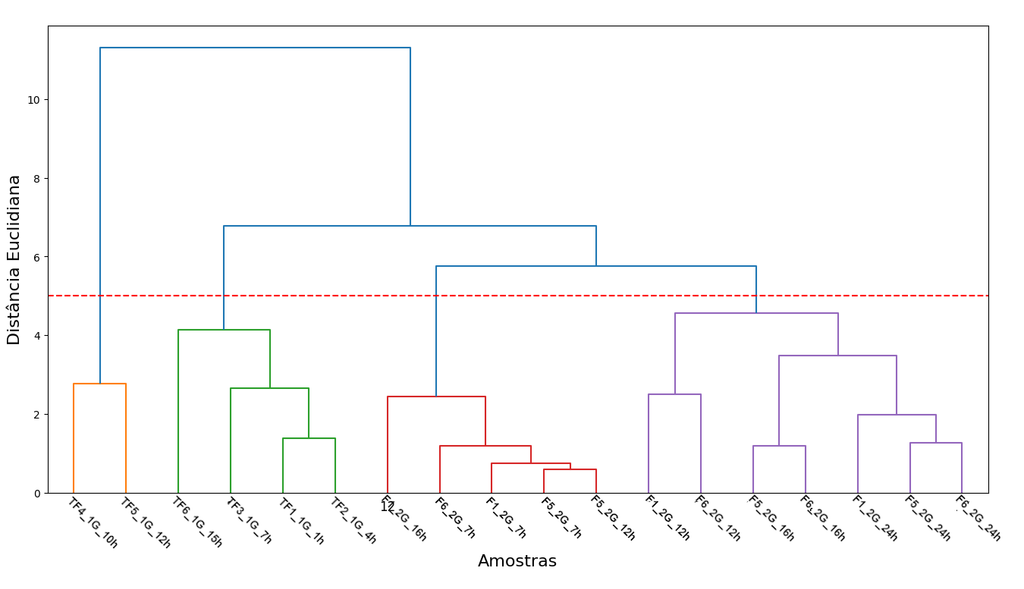
Finally, hierarchical clustering based on the tricarboxylic acid (TCA) cycle genes (Table 5) (Figure 8) also showed the separation of yeasts by ethanol type (1G and 2G). With a cut at a Euclidean distance of 5, four main groups were defined. The 1G samples formed two subgroups (10h and 12h in one; 1h, 4h, 7h, and 15h in another). The 2G samples also formed two subgroups (all 7h samples, one isolated 12h sample, and another 16h sample in one; and the remaining 12h, 16h, and 24h samples in another).
Figure 8. Dendrogram generated from the hierarchical clustering by “Complete Linkage” of transcriptome data of specific tricarboxylic acid [TCA] cycle genes from industrial yeasts subjected to different fermentation times for first [1G] (TF samples) and second [2G] (F samples) generation ethanol production
Source: Original research results
Factor Analysis of Mixed Data [FAMD]
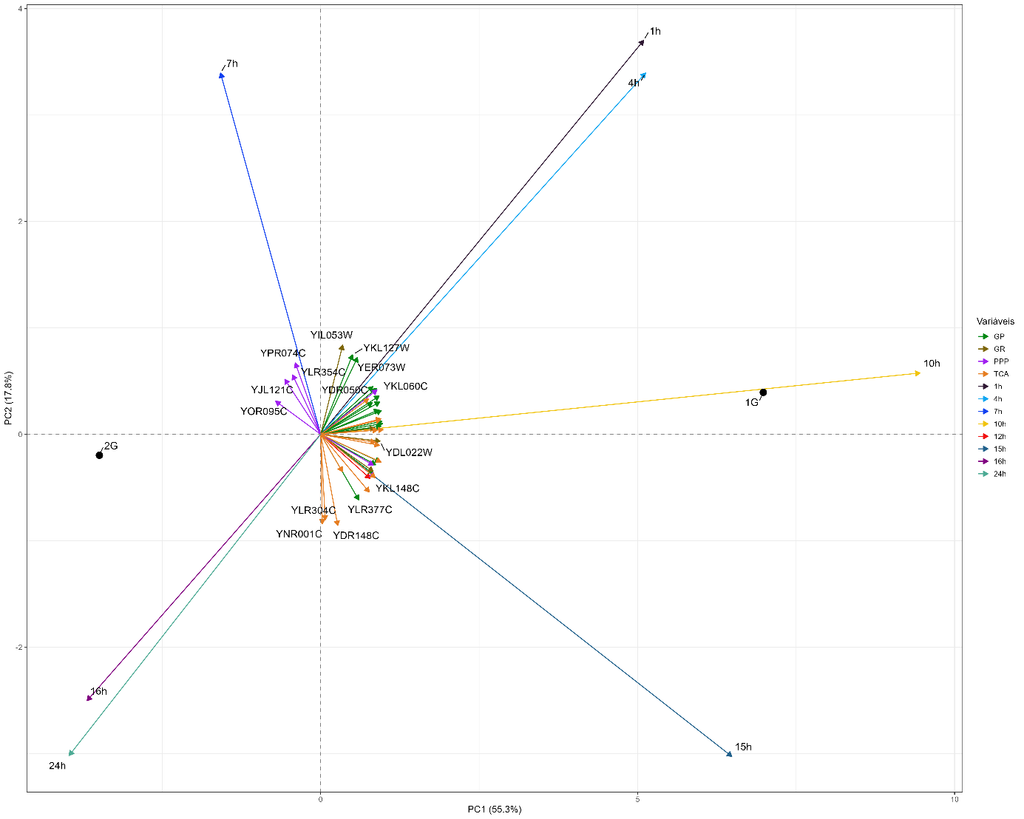
Factor Analysis of Mixed Data (FAMD) integrated quantitative (gene expression) and qualitative (fermentation times and types) variables, allowing the identification of association patterns. The first two principal components (PC1 and PC2) explained 73.1% of the total variance (PC1: 55.3%; PC2: 17.8%), indicating a good representation of the data (Figure 9). A strong separation was observed between samples along PC1, with 1G at the positive extreme and 2G at the negative extreme, confirming that the fermentation type is the main source of variation.
Figure 9. Biplot obtained by factorial analysis of mixed data [FAMD] from industrial yeast transcriptomes, considering dimensions 1 and 2
Source: Original research results Note: In this graph, variables such as metabolic pathways associated with genes, times, and types of fermentations for first [1G] and second [2G] generation ethanol production were considered. Acronyms: [GP]: glycolytic pathway, [GR]: glycerol route, [PPP]: pentose phosphate pathway, [TCA]: tricarboxylic acid cycle
The PC3 and PC4 components (Figure 10) explained 12% of the total variance (PC3: 7%; PC4: 5%), with 1G at the negative end of PC3 and 2G at the positive end, indicating a secondary contribution to the overall data structure. Regarding fermentation times, distinct groupings were observed: 1h and 4h positively correlated with PC2; 10h aligned with positive PC1 and 1G; 15h with a strong contribution to PC1 and a negative component in PC2; and 16h and 24h with opposite orientations to 1G, closer to 2G. The 7h time showed intermediate behavior, contributing mainly to PC2.
Figure 10. Biplot obtained by Factor Analysis of Mixed Data [FAMD] from industrial yeast transcriptomes, considering dimensions 3 and 4
Source: Original research results Note: In this graph, variables such as metabolic pathways associated with genes, times, and types of fermentations for first [1G] and second [2G] generation ethanol production were considered. Acronyms: [GP]: glycolytic pathway, [GR]: glycerol route, [PPP]: pentose phosphate pathway, [TCA]: tricarboxylic acid cycle
Metabolic pathway analyses associated with carbon flux (Table 5) revealed distinct patterns. Genes from the glycolytic pathway (GP), such as PFK1 (YGR240C), FBA1 (YKL060C), TPI1 (YDR050C), PGK1 (YJL052W), and PGI1 (YCR012W), were associated with early and late times of 1G fermentation, as were genes from the alcoholic fermentation pathway (PDC1 (YLR044C) and ENO1 (YGR254W)). Genes from the glycerol route (GR), such as GPD1 (YDL022W) and GPD2 (YOL059W), were associated with advanced 1G times, suggesting their role in metabolic adjustment. On the other hand, genes from the pentose phosphate pathway (PPP), such as ZWF1 (YNL241C), GND2 (YGR256W), and RPE1 (YHR183W), corresponded to 2G fermentation. Genes from the tricarboxylic acid cycle (TCA), including CIT1 (YNR001C), SDH1 (YKL148C), IDH1 (YPL262W), and ACO1 (YLR304C), correlated with late 2G times. These results indicate that gene expression variation is strongly associated with differences between 1G and 2G fermentations, as well as with temporal progression.
This work compared the gene expression profiles of industrial yeasts in first (1G) and second (2G) generation fermentations at different times, using unsupervised methods. The results showed a clear separation between the gene expression profiles associated with 1G and 2G processes, attributed to the metabolic differences between yeasts under these fermentation conditions. The type of substrate and process conditions influence the molecular behavior of yeasts. 1G fermentation presented more organized patterns over time, while 2G fermentation exhibited greater variability and metabolic complexity, reflecting the challenges of using lignocellulosic biomass. The analyses also indicated relevant differences between metabolic pathways associated with carbon flow, with the glycolysis pathway more associated with 1G and the pentose phosphate and tricarboxylic acid cycle pathways more involved in 2G. Unsupervised methods were effective in identifying relevant biological patterns, allowing the distinction between the molecular profiles of 1G and 2G fermentations and demonstrating potential as analytical tools for biotechnological improvement of ethanol production. It is important to note that the transcriptome data came from different studies, which may introduce “batch effects” due to variations in sequencing technologies and the number of biological replicates between 1G (2009) and 2G (2016) samples.
4. Conclusion
This study evaluated the transcriptomic profiles of industrial yeasts Saccharomyces cerevisiae “Pedra-2” in first and second-generation ethanol production, at different fermentation times, using unsupervised methods. A clear separation was observed between the gene expression profiles associated with first and second-generation processes, with the fermentation type being the main factor of variability. It was observed that first-generation samples exhibited greater temporal organization and stability, while second-generation samples demonstrated greater heterogeneity and metabolic complexity, reflecting the challenges of using lignocellulosic biomass. Differences were identified in metabolic pathways associated with carbon flux, with glycolysis predominating in first-generation fermentation and greater participation of the pentose phosphate pathway and the tricarboxylic acid cycle in second-generation fermentation. The main contribution lies in demonstrating the effectiveness of unsupervised methods for identifying relevant biological patterns, deepening the understanding of metabolic distinctions between the processes and providing subsidies for optimization strategies in ethanol production.
However, it is important to consider the limitations arising from the origin of the transcriptome data, which comes from different studies, potentially introducing “batch effects” due to variations in sequencing technologies and the number of biological replicates. Furthermore, the exploratory nature of unsupervised methods prevents direct causal inferences. For future studies, the incorporation of supervised approaches, greater experimental standardization, and validation with new datasets are suggested. Such initiatives can deepen the understanding of the molecular mechanisms involved and broaden the potential application of these results in industrial contexts, contributing to the biotechnological improvement of ethanol production.
Bibliographic References
Basso, LC.; De Amorim, H. V.; De Oliveira, A. J.; Lopes, M. L. 2011. Yeast selection for fuel ethanol production in Brazil. FEMS Yeast Research 11(2): 151-164.
Goldemberg, J. 2008. The Brazilian biofuels industry. Biotechnology for Biofuels 1-6.
Leite, R.C.C.; Leal, M.R.L.V.; Cortez, L.A.B.; Griffin, W. M.; Scandiffio, M.I.G. (2009). Can Brazil replace 5% of the 2025 gasoline world demand with ethanol? Energy 34(5): 655-661.
Renewable Fuels Association [RFA]. 2024. Market & Statistics – Annual Ethanol Production – 2024. Disponível em: . Acesso em: 10 mar. 2025.
Roman, C. 2010. Portal Ecodebate – Brasil busca liderança na produção de biocombustível.
Wheals, Α.Ε.; Basso, L.C; Alves, D.M.; Amorim, H.V. 1999. Fuel ethanol after 25 years. Trends Biotechnology 17(12):482-487.
Article originating from the Course Conclusion Work of the Specialization in Data Science and Analytics of the MBA USP/Esalq
To learn more about the course, click here and access the MBX Academy platform