
September 15, 2026
Factors Influencing the Decision to Hire Online Sports Consultancies
Karine Pereira Rodrigues; José Eduardo Vilas Bôas
DOI: 10.22167/2675-6528-202602249
Article derived from a Final Course Work (TCC), with content based on the student’s original work and adapted to the editorial format of the E&S Magazine with the support of the ResumeAI tool, an artificial intelligence solution developed by the Pecege Institute for textual synthesis and organization.
Abstract
The growth of the digital fitness market has boosted the offering of online sports consulting, demanding an understanding of the factors that determine purchase decisions. The study analyzed the constructs that influence perceived value and barriers to hiring in this segment. A descriptive quantitative survey was conducted online with 116 respondents, divided between consumers (n=50) and non-consumers (n=66). Data were subjected to descriptive statistics, Welch’s ANOVA, and Games-Howell post-hoc tests. The results indicated that the purchase decision was anchored in service personalization and recommendations, with digital positioning playing a secondary role. Cross-analysis revealed a significant effect of income on price perception, showing that high-income consumers prioritized exclusivity over cost-benefit. Among non-consumers, the main barrier to adoption was behavioral, the lack of self-discipline to train alone, evidencing a deficit in perceived self-efficacy. It was concluded that value in this market transcends technical prescription, residing in the professional’s ability to act as a motivational facilitator. It was suggested to reorient marketing strategies towards excellence in delivery and retention, enhancing organic growth through referrals.
Keywords: Consumer Behavior; Online Sports Consulting; Digital Marketing; Value Perception.
1. Introduction
The growing digitalization of services has profoundly redefined how consumers interact with and contract offers in the health and wellness sector. This transformation has been driven by the pursuit of greater flexibility and convenience, reflecting an increased awareness of the importance of prevention and quality of life. The digital health market, which encompasses various facets of services and products, projects significant growth (KHIDI, 2022), as consumers are increasingly receptive to virtual interventions that promote health and fitness (Korea PwC, 2022).
In this context, online sports consultancies emerge, differentiating themselves from generic fitness applications by focusing on human interaction and the personalization of professional guidance through digital technologies (Cotterill and Hurley, 2022). However, the expansion of this model is not without challenges. Building consumer trust in a non-face-to-face environment, effective communication of the value proposition, and differentiation in an increasingly saturated market are significant barriers.
The quality of service, a concept whose foundations were established by authors such as Parasuraman et al. (1988), Zeithaml and Berry (1988), and trust in the platform become essential predictors of perceived customer value (Catapan et al., 2025). Given this scenario, the central problem of this research questions what are the main factors that influence the consumer’s decision when hiring an online sports consulting service.
For the marketing manager, the problem translates into a practical and urgent dilemma: in a saturated market where trust is a challenge, how to allocate resources efficiently. The lack of concrete data on what truly converts the customer leads to decision-making based on intuition, resulting in scattered and low-return investments. Without this understanding, managers make decisions based on intuition, wasting resources.
The literature on consumer behavior, consolidated by authors such as Kotler and Keller (2016), already outlined the complex purchase decision process, pointing out that the consumer journey is influenced by multiple factors. The “experience economy”, a theory established by Pine and Gilmore (1998), and customer satisfaction, widely studied by Oliver (1980), are determinants for usage intentions and user retention. More recent studies indicate that perceived usability, risk perception, information quality, and service convenience significantly influence initial purchase intention (Kwon et al., 2022; Ahn and Park, 2023; Phamthi et al., 2024).
The concept of “value co-creation”, whose foundations were laid by Prahalad and Ramaswamy (2004), gains prominence in the digital environment, suggesting that customer engagement in the process is fundamental for the success and sustainability of digital health services (Peng et al., 2022). Research on the online fitness market reinforces that the trainer’s credibility, signaled by their expertise and reliability in digital contexts, increases consumer perceived competence and purchase intention (Park et al., 2022; Wang et al., 2024).
This research was important on two levels. On a theoretical level, it deepened the understanding of services marketing and consumer behavior within the digital health universe, a topic gaining momentum as technology redefines the relationships between students and professionals. On a practical level, the research provided useful learnings for those working in the field, managers, entrepreneurs, and professionals, offering pathways to improve customer attraction and retention strategies in an increasingly competitive and digitally consumer-centric scenario. Thus, the objective of this research was to identify the main factors influencing decision-making in the hiring of online sports consulting services.
2. Material and Methods
The research was characterized as a study of an applied nature, with a quantitative approach and descriptive character, carried out through an online field survey (Malhotra, 2019). The design involved collecting primary data via a structured questionnaire, complemented by bibliographic research for the construction of the theoretical framework.
The literature search was conducted in the Google Scholar, Scielo, ScienceDirect, and Emerald Insight databases, using keywords such as “perceived value”, “online fitness”, “digital coaching”, “consumer behavior”, “value co-creation”, and “sports consulting”. Scientific articles, books, and market reports published between 2019 and 2026 were consulted, totaling 27 references (8 books, 16 scientific articles, 3 market reports, and technical documents), which supported the constructs and the construction of the data collection instrument.
The data collection instrument was a structured questionnaire with 17 questions, developed on the Google Forms platform. The questionnaire is available in Appendix A (https://drive.google.com/file/d/1MnJddCqFkKtHX3TowTU1oCyxPSqCFlet/view?usp=drive_link).
The questionnaire was divided into three blocks: the first to characterize the sociodemographic profile of the respondents; the second to investigate hiring behavior, barriers, and motivations; and the third, the main one, used a 5-point Likert scale (1 = “Not important at all” to 5 = “Extremely important”) to assess the importance of 32 items, grouped into 8 theoretical constructs of perceived value: Personalization, Platform Trust, Price and Cost-Benefit, User Experience [UX], Credibility and Expertise, Recommendations and Reviews, Digital Positioning, and Image and Identification. The structure of the instrument and its theoretical references are detailed in Table 1.
Table 1. Research Instrument Structure and Theoretical Framework
| Block/Questions | Research Objective | Theoretical Framework of Base |
|---|---|---|
| Block 1 (Q1-Q7) | Characterize the sociodemographic profile, consumption habits, and frequency of physical activity practice. | Kotler and Keller (2016) Malhotra (2019) |
| Block 2 (Q8-Q9) | Identify the hiring behavior, barriers, and motivations that influence the purchase decision. | Bagozzi (2007) Ruyobeza et al. (2025) |
| Block 3 (Q10-Q17) | Measure and rank the perceived value factors through attitude scales (Likert) for 8 theoretical constructs. | Parasuraman et al. (1988) Prahalad and Ramaswamy (2004) |
Source: Original survey data
Data collection occurred between January 5 and March 9, 2026, through a questionnaire disseminated on social media and affinity groups, using convenience sampling (Gil, 2008).
The initial sample of 120 respondents was reduced to 116 after excluding 4 participants (1 under 18 years old and 3 non-binary, due to low representativeness for robust comparative analyses). The final sample was divided into 50 (43.1%) consumers of online sports consulting in the last six months, and 66 (56.9%) non-contractors, used for analysis of barriers to service adoption.
A pre-test was conducted with 5 respondents with similar demographic profiles to ensure the methodological rigor and clarity of the instrument, with positive feedback and no need for adjustments.
Ethical procedures were followed, with the application of a Free and Informed Consent Form [TCLE] at the beginning of the questionnaire, informing about the research objectives, the voluntary and anonymous nature of participation, and data confidentiality. Only consenting participants were able to proceed.
The data were tabulated and analyzed with the statistical software Jamovi (version 2.3.26). The analysis followed three steps: (1) Descriptive Analysis, with calculation of frequencies for profile and behavior variables; (2) Constructs Analysis, with calculation of means and standard deviations for the eight value constructs (n = 50); and (3) Inferential Analysis, with statistical tests to compare the perception of value between demographic segments, adopting α = 0.05. For comparison between income groups and age ranges, a one-factor ANOVA (Welch) was applied. In cases of statistical significance, the Games-Howell post-hoc test was used. To verify differences between the means of the eight value constructs, a repeated measures ANOVA was applied, with Greenhouse-Geisser correction and post-hoc comparisons with Bonferroni adjustment.
3. Results and Discussion
This section presents the research results at two levels of analysis. Initially, the sociodemographic profile of the total sample of valid respondents (n=116) is described, with the consumer and non-consumer groups presented separately. Then, the analysis focuses on the consumer group (n=50), with a focus on value perception, evaluated constructs, and statistical comparisons using ANOVA.
Block 1 – Sociodemographic profile of the sample
The sociodemographic profile of the valid sample (n=116) was divided into consumers (n=50) and non-consumers (n=66). Table 2 details the distribution of each group by gender, age group, monthly family income, and education level.
Table 2. Sociodemographic profile of respondents by group
| Category | Consumers (n=50) | Non-consumers (n=66) |
|---|---|---|
| Female | 33 (66,0%) | 52 (78,8%) |
| Male | 17 (34,0%) | 14 (21,2%) |
| 18-24 years | 3 (6,0%) | 17 (25,8%) |
| 25-34 years | 27 (54,0%) | 25 (37,9%) |
| 35-44 years | 16 (32,0%) | 15 (22,7%) |
| 45-54 years | 4 (8,0%) | 4 (6,1%) |
| 55 years or older | 5 (7,6%) | |
| Up to BRL 2,600 | 1 (2,0%) | 10 (15,2%) |
| BRL 2,601-BRL 5,200 | 12 (24,0%) | 25 (37,9%) |
| BRL 5,201-BRL 13,000 | 13 (26,0%) | 18 (27,3%) |
| BRL 13,001-BRL 26,000 | 17 (34,0%) | 8 (12,1%) |
| More than BRL 26,000 | 7 (14,0%) | 5 (7,6%) |
| Complete Elementary Education | 1 (1,5%) | |
| High School Diploma | 1 (2,0%) | 6 (9,1%) |
| Technical Education | 1 (2,0%) | 3 (4,5%) |
| Incomplete Higher Education | 4 (8,0%) | 10 (15,2%) |
| Complete Higher Education | 14 (28,0%) | 26 (39,4%) |
| Specialization | 16 (32,0%) | 16 (24,2%) |
| Master’s and Doctorate | 14 (28,0%) | 4 (6,1%) |
Source: Original research results
The sample, although non-probabilistic, revealed a predominance of women (73.3%; n=85), respondents between 25 and 44 years old (71.6%; n=83), and a high level of education, with 89.7% having at least incomplete higher education, which reflects the typical profile of users of digital health and wellness platforms (Bhaskaran, 2023). Family income was concentrated in the intermediate ranges, with 58.6% of respondents reporting income between R$ 2,601 and R$ 13,000. Of the total, 50 (43.1%) stated they had hired online sports consulting in the last six months, forming the focus group, while the remaining 66 (56.9%) comprised the group of non-hirers, used for comparative analyses of barriers to service adoption.
Block 2 – Hiring Behavior and Value Perception
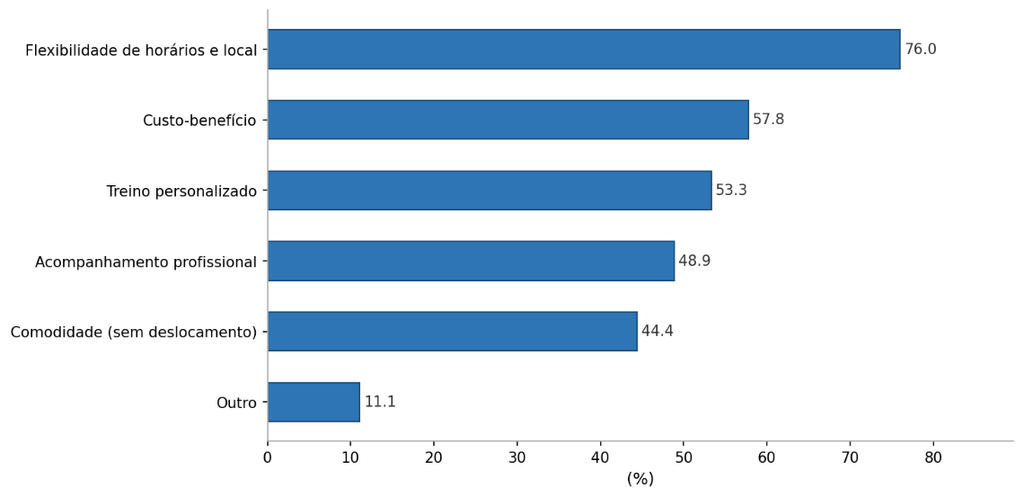
To understand the factors driving the purchase decision, consumers (n=50) were asked about the main motivators. Flexibility of training times and location was the most cited construct (76.0%; n=38), followed by cost-effectiveness compared to in-person personal training (58.0%; n=29), and the pursuit of more personalized training (54.0%; n=27). Figure 1 shows the distribution of these factors.
Figure 1. Decision Factors for Service Hiring (n=50)
Source: Original research results
The flexibility of schedules and training location (76%; n=38) and cost-effectiveness (58%; n=29) are the main drivers for hiring, indicating that online consulting aligns with the contemporary lifestyle. The high valuation of personalization and focus on individual goals (54%; n=27) is a significant finding. Cross-analysis by sociodemographic profile showed that schedule flexibility is the main motivator for both genders (women 79%; n=26; men 71%; n=12). Cost-effectiveness was more valued by women (61%) than by men (53%) (Monroe, 2003). Adult consumers (35 years or older) value personalization more (60%) than young people (50%), while younger individuals (18–34 years) prioritize cost-effectiveness (63% vs. 50%). Notably, 100% of middle-income consumers (R$ 5,201–13,000; n=13) cited cost-effectiveness, in contrast to 38% of high-income consumers (>R$ 13,000; n=24), reinforcing that price sensitivity decreases with increasing income. This suggests that consumers seek a perception of superior service and personalization is central to the perceived value proposition, aligned with the concept of value co-creation (Prahalad and Ramaswamy, 2004).
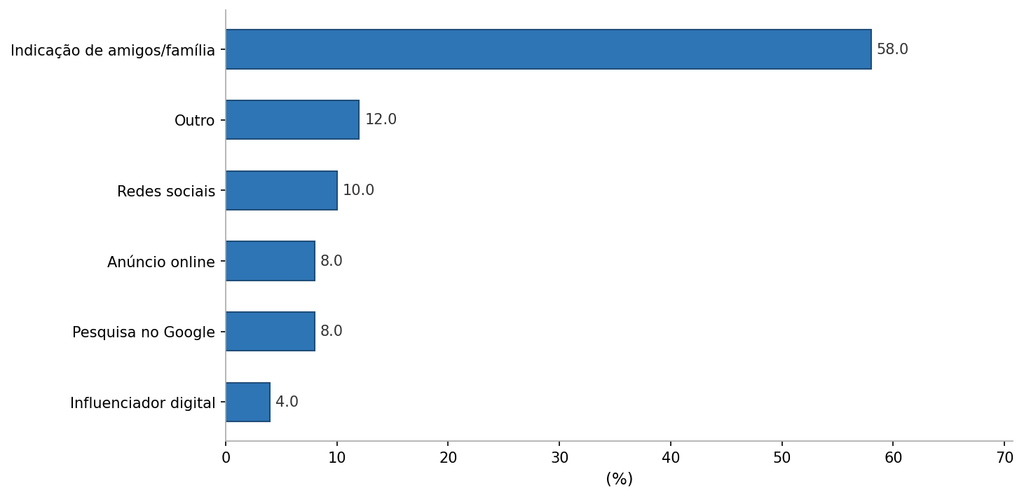
The service discovery channel is an important indicator of market growth dynamics. Recommendations from friends or family were the predominant channel, mentioned by 29 respondents (58.0%), followed by “other” channels (12.0%) and social networks (10.0%). Recommendations from sports and health professionals accounted for 16.0%, while digital influencers and online advertisements had a marginal participation (2.0% each). Figure 2 illustrates the distribution of discovery channels.
Figure 2. Online Sports Consulting Service Discovery Channel (n=50)
Source: Original research results
The indication of friends or family was predominant for women (61%; n=20) and men (53%; n=9), although men resort more to social networks (18%) than women (6%). No adult consumer (35 years or older) discovered the service through social networks (0%), while 17% of young people (18–34 years) did. High-income consumers (>R$ 13,000) showed the lowest indication rate (46%) and greater channel diversification, while low-income consumers (≤R$ 5,200) reached the service mainly through indication (77%). The predominance of indication (58.0%; n=29) is an implicit indicator of satisfaction, as recommendation involves a reputation commitment (Kotler and Keller, 2016). This result converges with Maia et al. (2022) and Park et al. (2022), who identified interpersonal trust and professional credibility as determining factors. The low performance of social media (10%; n=5) and digital influencers (2%; n=1) suggests that investment in digital marketing, although relevant for market education, is not the main conversion factor, with organic growth, anchored in delivery quality, being more effective.
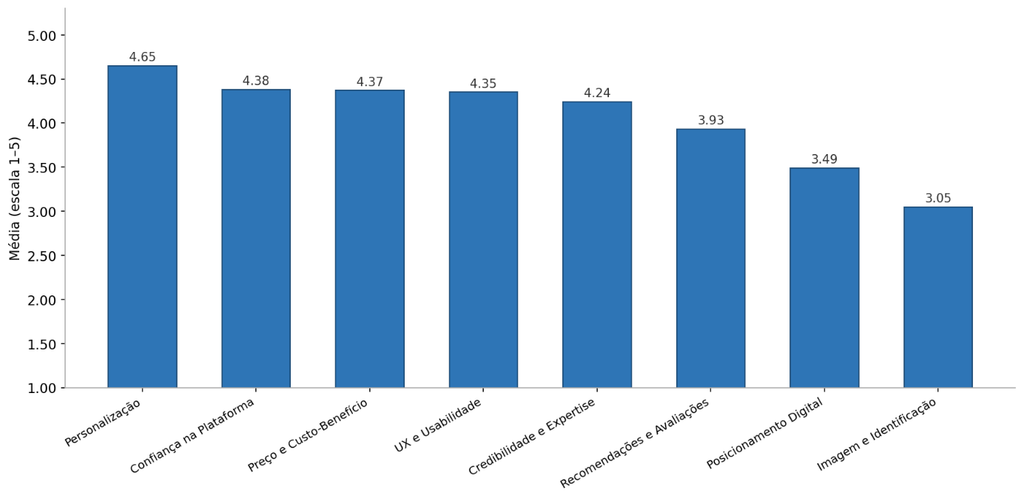
To deepen the understanding of value perception, consumers evaluated the importance of eight theoretical constructs on a scale of 1 to 5. Table 3 presents the hierarchy of these constructs, ordered by the average importance assigned, and Figure 3 illustrates this hierarchy.
Table 3. Hierarchy of Value Constructs (n=50)
| Position | Construct | Average | DP |
|---|---|---|---|
| 1° | Personalization | 4,65 | 0,51 |
| 2° | Platform Trust | 4,38 | 0,93 |
| 3° | Price and Cost-Benefit | 4,37 | 0,81 |
| 4° | UX and Usability | 4,35 | 0,68 |
| 5° | Credibility and Expertise | 4,24 | 0,77 |
| 6° | Recommendations and Evaluations | 3,93 | 0,88 |
| 7° | Digital Positioning | 3,49 | 0,89 |
| 8° | Image and Identification | 3,05 | 0,93 |
Source: Original research results
Figure 3. Hierarchization of Value Constructs by Mean Importance (n=50)
Source: Original research results
The repeated measures ANOVA confirmed statistically significant differences between the means of the eight constructs [F(7,343)=35.3; p<0,001]. A Personalização (M=4,65) ocupa o primeiro lugar, com diferença significativa em relação à Confiança na Plataforma (M=4,38; p=0,005). As médias de Confiança (M=4,38), Preço e Custo-Benefício (M=4,37) e UX/Experiência do Usuário (M=4,35) não diferem significativamente entre si (p>0.05), forming a block of equally valued constructs. At the lower end, Image and Identification (M=3.05) shows a significant difference in relation to all other constructs (p<0.001), being the construct of lowest perceived relevance.
The cross-analysis of the construct means by sociodemographic profile revealed that Personalization and Image and Identification maintained their highest and lowest value positions, respectively, across all segments. Women attribute slightly higher means to Price (M=4.46 vs. M=4.18) and Platform Trust (M=4.44 vs. M=4.25). Adult consumers (35 years or older) value Digital Positioning less (M=3.24) than younger consumers (M=3.66), indicating a lower influence of the professional’s digital presence. Low-income consumers (≤R$ 5,200) attribute higher means to Price (M=4.92) and Trust (M=4.72), while high-income consumers (>R$ 13,000) show the lowest means in these constructs (M=4.01 and M=4.28), reinforcing the decrease in price sensitivity with increasing income. This paradox, of high platform trust and low value attributed to digital marketing, suggests that the most efficient investment lies in the quality of the delivered experience, which generates valuable recommendations.
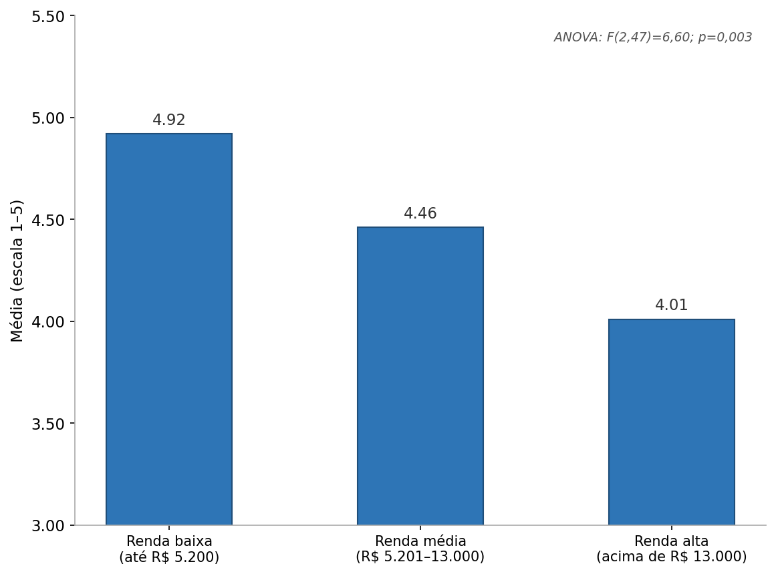
To verify the variation in value perception by sociodemographic characteristics, analyses of variance (ANOVA) were performed. Table 4 and Figures 4 and 5 present the results with statistical significance for the variation of the Price construct by income bracket and the UX construct by age group.
Table 4. ANOVAs Results: Price by Income and UX by Age Group (n=50)
| Analysis | Group | n | Average | ANOVA Result |
|---|---|---|---|---|
| Price × Income | Low income (≤ BRL 5,200) | 13 | 4,92 | F(2; 24.8) = 12.50 |
| Average income (BRL 5,201–13,000) | 13 | 4,46 | p < 0.001* | |
| High income (> BRL 13,000) | 24 | 4,01 | ||
| UX × Age Group | 18-34 years | 30 | 4,35 | F(3; 8.74) = 4.00 |
| 35-54 years | 20 | 4,22 | p = 0.047* |
Source: Original research results. * p < 0.05.
Figure 4. Price and Cost-Benefit Construct by Income Range (n=50)
Source: Original research results
Cross-analysis revealed significant differences in the perception of the constructs Price and Cost-Benefit according to consumers’ income bracket (n=50). The results indicated a significant main effect of income on price perception (F(2; 24.8) = 12.50; p < 0.001; η² = 0.219). Lower-income consumers (up to R$ 5,200; M=4.92) attribute greater importance to cost-benefit than those with intermediate income (R$ 5,201 to R$ 13,000; M=4.46) and higher income (above R$ 13,000; M=4.01). The Games-Howell post-hoc test revealed a statistically significant difference between the low-income and high-income groups (p < 0.05), with no significant difference between low and medium income. This demonstrates that, for the higher-income group, price ceases to be the main evaluation criterion, being replaced by attributes such as customization and exclusivity (Monroe, 2003).
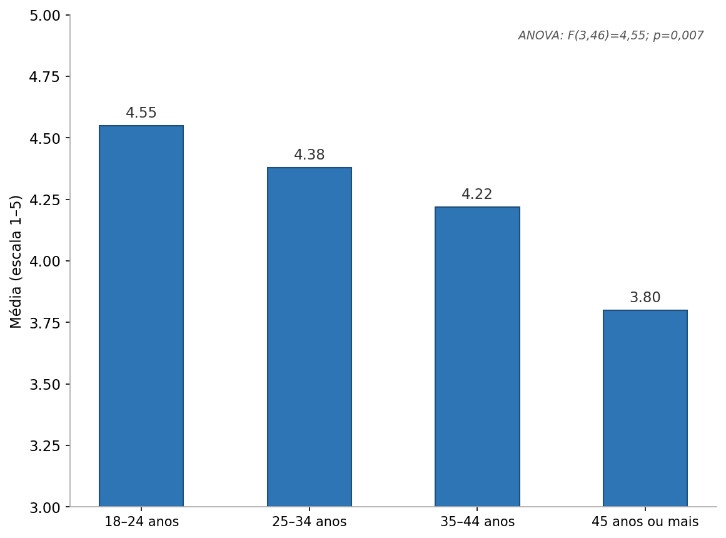
Figure 5. UX Construct and Usability by Age Group (n=116)
Source: Original research results
The analysis of the UX and Usability construct by age group also revealed a statistically significant difference [F(3,46)=4.55; p=0.007]. Younger consumers (18–24 years; n=3; M=4.78) value the digital experience more than those in older age groups (45–54 years; n=4; M=3.42). Although the test indicated a statistically significant difference (F(3; 8.74) = 4.00; p = 0.047), the effect size was practically null (η² = 0.001), suggesting that age group has minimal influence on UX perception in the studied sample. This finding suggests that the platform’s ease of use is especially relevant for the young audience, with higher expectations regarding the service’s interface and usability.
Block 3 – Comparative Analysis: Hiring Barriers
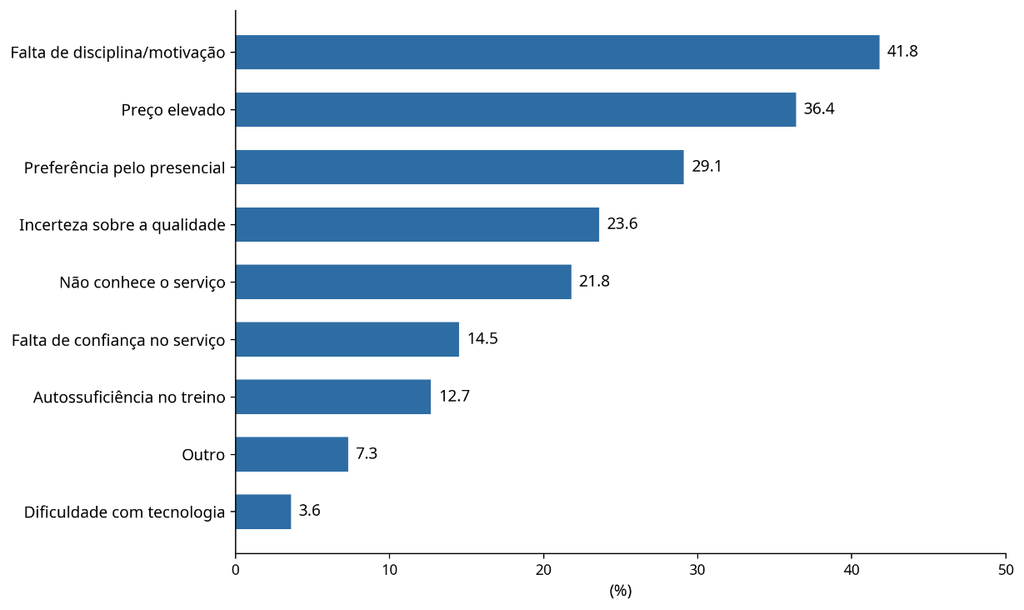
The group of respondents who never hired an online sports consultancy (n=55) was investigated regarding barriers to service adoption. The main barriers identified are behavioral and perceptual in nature: lack of discipline and motivation (41.8%), perceived high price (36.4%), and preference for in-person service (29.1%). Figure 6 presents the cited barriers in descending order of frequency. Comparisons between subgroups (gender) were performed descriptively due to sample limitations.
Figure 6. Barriers to Hiring the Service (n=66)
Source: Original research results
The lack of discipline and motivation to train alone (41.8%; n=23) is the main obstacle among non-subscribers (n=55), followed by the perceived high price (36.4%; n=20) and preference for in-person contact (29.1%; n=16). The data on discipline is relevant, as it shifts the marketing challenge from price justification to perceived self-efficacy (Bandura, 1997). The barrier is neither financial nor technological, but doubt about the ability to maintain consistency without the physical presence of a professional. Segmentation by gender shows that self-discipline is the main barrier for women (48.8%; n=21), while self-sufficiency (“I don’t see the need” and “I can train alone”) is more prominent among men (41.7%; n=5, each). This suggests distinct communication strategies for each segment. The perception of “high price” as a barrier among non-subscribers (36.4%) contrasts with the high valuation of cost-benefit among subscribers (M=4.37), indicating that the price is not objectively high, but that the value perception has not yet been established for those who have not experienced the service. The most effective communication strategy should focus on demonstrating value and customer experience.
The results of Block 3 dialogue with the theory of diffusion of innovations (Rogers, 2003), which points out that the adoption of new services is hindered by psychological factors such as uncertainty and resistance to changing habits. The barrier of self-discipline refers to perceived self-efficacy (Bandura, 1997), where the decision to hire the online service is conditioned by the belief in the ability to execute the plan autonomously. The preference for in-person service corroborates the findings of Parasuraman et al. (1988), Zeithaml and Berry (1988) on tangibility in service quality, where physical presence is perceived as an indicator of trust and commitment.
Synthesis of Results
Table 5 presents the main findings of the research, as well as indications of practical applications for marketing managers and industry professionals.
Table 5. Synthesis of results and possible practical applications
| Step | Main research findings | Possible practical applications |
|---|---|---|
| Decision Factors (Overall Average) | Personalization (M=4.65) and Recommendations (M=4.50) are the most valued constructs in the purchase decision. – Digital Positioning (M=3.49) and Image (M=3.05) have secondary relevance. | Prioritize the delivery of highly tailored workouts to the client’s routine. – Actively encourage referral marketing and the collection of real testimonials from satisfied students. |
| Cross Analysis (Price x Income) | Low-income consumers (up to R$ 5,200) attribute significantly greater importance to price (M=4.92) than high-income consumers (M=4.01). – For high income, price ceases to be the central criterion. | Create product pipelines with different tickets: basic and automated plans for entry, and premium plans focused on exclusivity and intensive support for high income. |
| Cross Analysis (UX × Age) | The demand for platform usability and quality [UX] varies across age groups, although with a small effect size. | Ensure that the workout delivery app or platform is intuitive and easy to navigate, reducing technological friction for all ages. |
| Hiring Barriers | The main barrier for non-customers is the lack of discipline/motivation (41.8%), followed by the high price (36.4%) and preference for in-person (29.1%). | Shift the communication focus: instead of just justifying the price, demonstrate how the service offers continuous support and motivation tools to maintain student consistency. |
Source: Original research results.
The data synthesis shows that the online sports consulting market operates under the logic of the experience economy. Sustainable growth depends less on massive investments in acquisition via social networks and more on excellence in service delivery (personalization), which generates satisfaction and feeds the main sales channel: organic recommendation.
4. Conclusion
This study aimed to identify the main factors influencing decision-making in the hiring of online sports consulting services. It was found that service personalization and recommendations from friends or family constituted the pillars of the purchase decision, while the professional’s digital positioning proved to be a secondary factor. It was observed that price perception varied significantly with income, indicating that high-income consumers prioritized attributes such as exclusivity over cost-benefit. Among non-consumers, the main barrier identified was the lack of self-discipline to train alone, highlighting a behavioral challenge linked to perceived self-efficacy, rather than merely financial or technological issues. The main contribution of this work lies in demonstrating that value in this market transcends mere technical prescription, anchoring itself in the professional’s ability to act as a motivational facilitator. For managers, it is suggested to reorient marketing strategies, prioritizing excellence in delivery and customer retention to enhance organic growth by referral, instead of massive investments in acquisition via social media.
However, it is essential to acknowledge the limitations of this study, which include the use of a convenience sample, generating a self-selection bias, and a cross-sectional design, which prevents understanding the evolution of value perception over time. Additionally, the small size of the non-contractor sample limited the depth of inferential analyses on market barriers. For future investigations, longitudinal studies are recommended to monitor retention rates in relation to perceived support, as well as qualitative research exploring the psychological strategies employed by students who overcame demotivation in the virtual environment.
Bibliographic References
Ahn, J.; Park, S. 2023. Usability and user experience in fitness applications. Journal of Digital Health 12(3): 45-62.
Bandura, A. 1997. Self-Efficacy: The Exercise of Control. W.H. Freeman, New York, NY, USA.
Bhaskaran, V. 2023. Designing for trust: the crucial role in digital user experiences. Journal of User Experience 19(2): 112-128.
Catapan, A.; Silva, M.; Santos, R. 2025. Perceived value and trust in online platforms. Brazilian Journal of Marketing 14(1): 33-48.
Cotterill, S.; Hurley, M. 2022. Online sports coaching: a new paradigm. International Journal of Sports Science & Coaching 18(2): 112-125.
Gil, A.C. 2008. Métodos e Técnicas de Pesquisa Social. 6ed. Atlas, São Paulo, SP, Brasil.
Korea Health Industry Development Institute [KHIDI]. 2022. Digital health market report. Disponível em: . Acesso em: 16 mar. 2026.
Kotler, P.; Keller, K.L. 2016. Marketing Management. 15ed. Pearson, Harlow, Reino Unido.
Kwon, S.; Lee, J.; Kim, H. 2022. Continuity of use in fitness applications. Journal of Consumer Behaviour 21(4): 567-584.
Maia, C.; Lunardi, G.; Dolci, P. 2022. Trust and purchase intention in Brazilian e-commerce. Revista de Administração Contemporânea 26(3): e210123.
Malhotra, N.K. 2019. Marketing Research: An Applied Orientation. 7ed. Pearson, Harlow, Reino Unido.
Monroe, K.B. 2003. Pricing: Making Profitable Decisions. 3ed. McGraw-Hill, New York, NY, USA.
Oliver, R.L. 1980. A cognitive model of the antecedents and consequences of satisfaction decisions. Journal of Marketing Research 17(4): 460-469.
Parasuraman, A.; Zeithaml, V.A.; Berry, L.L. 1988. SERVQUAL: a multiple-item scale for measuring consumer perceptions of service quality. Journal of Retailing 64(1): 12-40.
Park, J.; Kim, S.; Lee, M. 2022. Trainer credibility in online fitness services. Sport Management Review 25(2): 234-251.
Peng, X.; Wang, Y.; Zhang, L. 2022. Value co-creation in digital health services. Journal of Service Research 25(1): 89-105.
Phamthi, N.; Nguyen, T.; Tran, H. 2024. Factors influencing initial purchase intention in online services. Asian Journal of Business Research 14(1): 1-15.
Pine, B.J.; Gilmore, J.H. 1999. The Experience Economy: Work Is Theatre & Every Business a Stage. Harvard Business School Press, Boston, MA, USA.
Prahalad, C.K.; Ramaswamy, V. 2004. The Future of Competition: Co-Creating Unique Value with Customers. Harvard Business School Press, Boston, MA, USA.
PricewaterhouseCoopers Korea [PwC Korea]. 2022. Consumer trends in digital wellness. Disponível em: . Acesso em: 16 mar. 2026.
Rogers, E.M. 2003. Diffusion of Innovations. 5ed. Free Press, New York, NY, USA.
Wang, L.; Chen, X.; Liu, Y. 2024. Expertise signaling and purchase intention in digital coaching. Computers in Human Behavior 150: 107985.
Article originating from the Final Course Work of the Specialization in Marketing of the MBA USP/Esalq
To learn more about the course, click here and access the MBX Academy platform