
September 10, 2026
Performance of Machine Learning Models in the Selection of Brazilian Stock Exchange Stocks
Gabriel Fernandes Masalskas; Ricardo Janes
DOI: 10.22167/2675-6528-202602221
Article derived from a Final Course Work (TCC), with content based on the student’s original work and adapted to the editorial format of the Revista E&S with the support of the ResumeAI tool, an artificial intelligence solution developed by the Pecege Institute for textual synthesis and organization.
Summary
The Brazilian stock market, characterized by high volatility and liquidity constraints, poses challenges to the application of machine learning models in return prediction and investment strategy construction. The study compared the predictive and economic performance of machine learning models and traditional statistical methods in estimating future returns and forming portfolios based on asset ranking. Historical data from B3 stocks were used, with technical and financial variables derived from prices and volume. Linear models (Linear Regression, Ridge, LASSO, Elastic Net), ensemble models (Random Forest, XGBoost, LightGBM), and a neural network (Multilayer Perceptron) were evaluated. Predictive evaluation was performed using error metrics on a test set, and economic evaluation through backtesting of long-only strategies, with operational costs based on turnover for gross and net return analysis. The results revealed low predictive capacity across all models, with negative R² and high errors. Although marginal differences in predictions generated variations in economic performance, these were of low magnitude and unstable. The LightGBM model achieved the best economic performance, but with limited gains compared to the benchmark after including operational costs. No consistent evidence of superior risk-adjusted return generation was observed.
Keywords: machine learning; backtest; stock market; return prediction; asset selection.
1. Introduction
The Brazilian stock market, traded by B3 S.A. – Brasil, Bolsa, Balcão (B3), presents particularities that differentiate it from developed markets, imposing specific challenges for the application of machine learning models in return prediction and investment strategy construction. Understanding its dynamics is fundamental for investors and researchers seeking to optimize performance and risk management in a highly complex environment.
Among the distinctive characteristics of the Brazilian market, higher volatility, lower liquidity depth, and higher operational costs stand out. Comparative studies confirm that emerging markets, such as Brazil, tend to exhibit greater sensitivity to volatility shocks and lower structural liquidity compared to mature markets. Vartanian (2023), for example, identified Brazil among the most volatile markets during periods of instability. De Carvalho (2021) highlighted a significant liquidity premium in B3 stocks, while Brito (2024) demonstrated that the relationship between liquidity and volatility in the national market is accentuated during crises. Additionally, Benetti et al. (2007) emphasized that operational and tax costs in the Brazilian stock market remain higher than those observed in developed countries. These structural particularities make Brazil a challenging environment for the implementation of quantitative strategies.
In this context, machine learning (ML) emerges as a promising tool for analyzing and predicting returns of variable income assets. Recent literature already demonstrates significant advances in the application of ML in finance. Arismendi-Zambrano et al. (2023) showed that ML methods based on penalized regressions are capable of predicting intraday returns in the Brazilian market, generating strategies with performance adjusted for transaction costs superior to linear benchmarks. In the field of fund management, the CFA Society Brazil (2024) applied XGBoost to distinguish managers, finding that portfolios formed based on the model’s predictions presented a better risk-return ratio. Felizardo and Pinto (2019) also evaluated artificial neural network architectures in predicting returns of Brazilian stocks, demonstrating gains in assertiveness compared to linear approaches, although they highlighted the sensitivity of performance to hyperparameter calibration. Additional evidence (Henrique et al., 2019) indicates the potential of non-linear models, such as Support Vector Regression, in predicting prices and returns of financial assets in Brazil, despite limitations associated with model stability and generalization.
Despite these advances, relevant gaps persist in the national literature. Most works focus on high-frequency predictions or fund analyses, with rare research systematically comparing different families of ML models, such as Random Forest, boosting (XGBoost, LightGBM), and neural networks, in asset recommendation contexts in the stock market. Furthermore, few studies incorporate operational elements of Brazilian reality, such as transaction costs, slippage, and effective liquidity, in their backtests and temporal validations. This lack of comprehensive evaluation prevents a complete assessment of the practical and economic viability of ML-based strategies in the local market.
The application of ML in the Brazilian financial market is therefore in a promising stage, but still lacks approaches that reconcile predictive robustness and operational viability. As highlighted by De Prado (2018) and Gu, Kelly, and Xiu (2020), the success of ML models in finance depends not only on statistical performance but also on the ability to generate economically useful and feasible predictions. In the national context, this discussion becomes particularly relevant due to liquidity constraints and trading costs, which can render profitable strategies unfeasible in simulations. Thus, it becomes necessary to develop studies that comparatively and reproducibly evaluate the performance of different ML algorithms in asset recommendation strategies in the Brazilian stock market, using risk-adjusted metrics such as the Sharpe ratio, as well as drawdown and volatility measures. In particular, understanding which models offer the best trade-off between performance and operational viability is a relevant contribution to both academic research and professional practice. Therefore, this work aims to compare the predictive and economic performance of machine learning models and traditional statistical methods in estimating future returns and constructing ranking-based investment strategies in the Brazilian stock market.
2. Material and Methods
This work evaluated the predictive capacity and economic utility of different machine learning models and traditional statistical methods applied to the Brazilian stock market. The analysis was conducted using historical adjusted price data of stocks traded on B3, covering an unbalanced panel of assets.
Definition of the investable universe and data treatment
The study used historical data of adjusted stock prices traded on B3, obtained from the platform “Market Data – Stocks listed on B3” and collected via the Python yfinance library (Yahoo Finance). The price series corresponded to adjusted closing prices (“adjusted close”), which incorporate corporate events such as dividends and stock splits, ensuring temporal consistency of returns.
From the initial set of assets, eligibility and sequential filtering criteria were applied to define the investable universe. These criteria included historical data availability, price consistency, minimum liquidity (traded financial volume), and exclusion of incomplete or inconsistent series, as detailed in Table 1.
Table 1. Steps for defining the investable universe
| Step | Description |
|---|---|
| Initial base | Stocks listed on B3 |
| Data collection | Assets with history available in the provider |
| Quality filter | Exclusion due to price and volume inconsistencies |
| Minimum history | Exclusion of insufficient series |
| Liquidity | Monthly selection of the 50 most liquid assets |
| Final universe | Dynamic panel of eligible assets |
Source: Original survey data
The daily data were aggregated for monthly periodicity, using the last available closing price in each month. Additionally, in each period, the 50 most liquid assets (based on daily traded financial volume) were selected to form a dynamic investable universe, reflecting the market’s operational reality.
Definition of the target variable
The variable of interest was the future monthly logarithmic return of each asset, calculated from the monthly closing prices, according to Equation 1:
rt+1 = ln(Pt+1 / Pt) (1)
where: rt+1 is the logarithmic return in period t+1; Pt+1 is the closing price in period t+1; and Pt is the closing price in period t. This return was associated with period t (shift), so that predictions made at the end of month t referred to the return observed in month t+1. The problem was formulated as a supervised regression task to estimate continuous future returns. The economic evaluation of the strategies was based on simple returns.
Construction of the explanatory variables and models
The explanatory variables included lagged returns, volatility measures, trend indicators, and price- and volume-based technical metrics, as detailed in Table 2.
Table 2. Explanatory variables used in the modeling
| Group | Variable | Description |
|---|---|---|
| Returns | log_return_1d | Daily logarithmic return |
| Returns | return_5d | 5-day cumulative return |
| Returns | ret_21d | Monthly return |
| Returns | ret_63d | Quarterly return |
| Returns | return_252d | Annual return |
| volatility | vol_21d | Standard deviation of returns (21 days) |
| volatility | vol_63d | Standard deviation of returns (63 days) |
| Trend | price_sma21_ratio | Price / 21-day moving average ratio |
| Trend | price_sma63_ratio | Price / 63-day moving average ratio |
| Trend | sma_diff_21_63 | Difference between moving averages (21d – 63d) |
| Indicators | rsi_14 | Relative Strength Index (14 days) |
| Indicators | rsi_21 | Relative Strength Index (21 days) |
| Indicators | macd | MACD Indicator |
| Indicators | macd_signal | MACD signal line |
| Indicators | macd_hist | MACD Histogram |
| Risk | ATR_14 | Average True Range (14 days) |
| Liquidity | vol_avg_21d | Average traded volume |
| Liquidity | vol_med_63d | Average volume (63 days) |
| Liquidity | vol_fin_med_21d | Average financial volume |
| Liquidity | vol_fin_med_63d | Average financial volume (63 days) |
| Liquidity | revenue_proxy | Liquidity proxy |
| Others | adx_14 | Average Directional Index |
| Others | obviously | On Balance Volume |
Source: Original survey data
The variables were calculated daily and aggregated monthly, using the last available observation. All explanatory variables were lagged by one month (t-1) to ensure that the forecasts used only information available up to the end of the previous month.
Representative models of different approaches were selected: linear regressions (Linear Regression, Ridge, LASSO, and Elastic Net), decision tree-based ensemble models (Random Forest, XGBoost, and LightGBM), and an artificial neural network (Multilayer Perceptron – MLP). Table 3 lists the models and their Python implementation libraries.
Table 3. Models used and respective implementation libraries
| Model | Library | Implementation |
|---|---|---|
| Linear Regression | scikit-learn | LinearRegression |
| Crest | scikit-learn | Crest |
| LASSO | scikit-learn | Lasso |
| Elastic Net | scikit-learn | ElasticNet |
| Random Forest | scikit-learn | RandomForestRegressor |
| XGBoost | xgboost | XGBRegressor |
| LightGBM | lightgbm | LGBMRegressor |
| Neural Network (MLP) | tensorflow / keras | Sequential (Fully connected) |
Source: Original survey data
The explanatory variables were standardized by z-score transformation for scale-sensitive models, while ensemble models were estimated on the original variables. All models were formulated as supervised regression problems to predict continuous future returns. The sample was divided temporally in a sequential manner, with the initial 80% of observations for training and the final 20% for testing, preserving the chronological order of the data.
The predictive evaluation was performed using error metrics (RMSE, MAE, and R²), and the economic evaluation was conducted by a “backtest” on the test set, utilizing metrics such as average return, volatility, Sharpe ratio, and maximum “drawdown”. A benchmark, defined as an equally weighted portfolio of all eligible assets with monthly rebalancing, was used as a reference. To ensure reproducibility, random “seeds” were fixed in the Python (random), NumPy, and TensorFlow libraries.
Construction of ranking-based strategies
The model predictions were used to build “long-only” investment strategies based on “cross-sectional” ranking. Monthly, the 10 assets with the highest predicted return, among the 50 most liquid assets in the investable universe, were selected to form an equally weighted portfolio. The portfolios were fully rebalanced at the end of each month.
Portfolio turnover was measured by the average monthly turnover, which is the proportion of assets replaced between consecutive periods. The strategy return was calculated as the simple average of the realized returns of the selected assets in the subsequent month. Operational costs were incorporated as a simplified estimate, applying a fixed proportional cost of 0.2% per unit of turnover. The net return (rnet) was calculated by deducting this cost from the gross return (rgross), according to Equation 2:
rliquidity = rgross – c * turnovert (2)
where c is the operational cost (0.2%) and turnovert is the proportion of assets replaced in period t. The performance of the portfolios was evaluated in the test period in terms of gross and net return, with net return being the main metric for economic comparison. The benchmark, in turn, had no operational costs.
3. Results and Discussion
The interpretation of the results considered the methodological context adopted, including the temporal horizon of the test set period and the simplifications inherent in the backtest, such as the modeling of operational costs based on portfolio turnover (fixed at 0.2%), without the incorporation of additional components like slippage, market impact, and liquidity constraints.
Impact of filters on the asset universe
The application of the eligibility and filtering criteria resulted in a progressive reduction of the initial universe of assets available for analysis. Table 4 presents the selection funnel, detailing the number of remaining assets after each step of the process.
Table 4. Asset universe selection funnel
| Step | Number of assets |
|---|---|
| Initial base (listed actions – CSV) | 398 |
| Assets with historical data in the provider | 393 |
| After quality filter (price and volume) | 150 |
| After minimum history filter | 150 |
| Top 50 by liquidity (final sample) | 50 |
Source: Original survey data
A significant reduction in the universe of assets was observed, from 398 to 50, representing an approximate 87% contraction of the initial set. This reduction highlights the high concentration of liquidity in the Brazilian stock market and is consistent with the market structure, where few assets have sufficient trading volume for systematic strategies. The final universe used in the modeling and backtesting predominantly reflects the behavior of more liquid assets. Methodologically, this filtering implies that the results are not directly generalizable to less traded assets, and the dynamic definition of the investable universe influences the composition of portfolios and the benchmark, impacting the comparative evaluation of strategies.
Descriptive statistics of the target variable
Before modeling, the distribution of the target variable, the future monthly logarithmic return, was analyzed to assess its statistical properties and economic plausibility. Table 5 presents the descriptive statistics of the variable.
Table 5. Descriptive statistics of the future monthly logarithmic return
| Metric | Value |
|---|---|
| Observations | 3.207 |
| Average | 0,0121 |
| Standard deviation | 0,1237 |
| Minimum | -0,9252 |
| 1% | -0,3462 |
| 5% | -0,1661 |
| 25% | -0,0538 |
| Median | 0,0118 |
| 75% | 0,0807 |
| Maximum | 0,6987 |
Source: Original research results
The results indicated a distribution characterized by high volatility and long tails, a pattern widely documented in financial literature (Fama and French, 2015; Harvey et al., 2016). The mean close to zero (0.012) and the high standard deviation (0.124) evidenced a low signal-to-noise ratio environment, making it difficult to identify consistent predictive patterns. The presence of extreme values, with minimum returns close to -92% and maximums around 70%, indicated the occurrence of idiosyncratic events and a negative asymmetry in the distribution, characteristic of emerging stock markets. These properties imply modeling challenges, such as sensitivity to outliers and instability in estimates, reinforcing the importance of evaluating strategy performance in a risk-adjusted manner.
Predictive evaluation of the models
The predictive capacity of the models was evaluated by error metrics such as RMSE, MAE, and coefficient of determination (R²), calculated on the test set. The predictions were based on the explanatory variables described in the methodology. Table 6 presents the predictive performance of the models, comparing linear and non-linear approaches.
Table 6. Predictive performance of the models (RMSE, MAE, and R²)
| Model | RMSE | MAE | R² |
|---|---|---|---|
| Straight-line | 0.1031 | 0.0754 | -0.0571 |
| Crest | 0.1031 | 0.0754 | -0.0567 |
| LASSO | 0.1029 | 0.0753 | -0.0533 |
| ElasticNet | 0.1030 | 0.0754 | -0.0547 |
| RandomForest | 0.1017 | 0.0742 | -0.0297 |
| XGBoost | 0.1074 | 0.0792 | -0.1476 |
| LightGBM | 0.1121 | 0.0831 | -0.2503 |
| MLP | 0.1244 | 0.0943 | -0.5391 |
Source: Original research results
All models showed low predictive power on the test set, with negative coefficients of determination in all specifications, indicating that their predictions are, on average, inferior to a naive strategy based on the historical average of returns. The differences between models in terms of RMSE and MAE were relatively small, with no evidence of consistent superiority of more complex models over linear approaches. Regularized models, such as LASSO and Elastic Net, showed marginally superior performance, while more flexible models, such as Gradient Boosting and neural networks, exhibited worse performance, suggesting possible overfitting. The proximity between RMSE values and the standard deviation of the target variable (Table 5) suggests that the models are unable to explain a significant portion of the variance in returns in a low signal-to-noise ratio environment. The observed differences should be interpreted with caution, given the absence of statistical evidence of superior predictive ability (Giacomini and White, 2006).
Economic evaluation of strategies
Table 7 presents the main economic performance indicators of ranking-based strategies, calculated in the test period, already deducted from the estimated operational costs based on portfolio turnover. Reported are the average monthly return, the monthly geometric return, the annualized return, the return volatility, the Sharpe ratio, the maximum drawdown, and the average monthly turnover, in addition to the final value of a hypothetical investment of R$ 100.
Table 7. Economic performance of strategies by model
| Model | Monthly return (%) | Geom. ret. (%) | Annual return (%) | Volume (%) | Sharpe | Maximum Drawdown (%) | Average monthly turnover | R$ 100 total |
|---|---|---|---|---|---|---|---|---|
| LightGBM | 0,45 | 0,15 | 1,76 | 8,15 | 0,1920 | -28,79 | 0,5619 | 103,10 |
| Crest | 0,28 | 0,01 | 0,10 | 7,75 | 0,1249 | -31,31 | 0,4619 | 100,18 |
| ElasticNet | 0,28 | -0,01 | -0,07 | 8,01 | 0,1225 | -33,30 | 0,4429 | 99,87 |
| Reference Standard | 0,13 | -0,06 | -0,72 | 6,41 | 0,0703 | -25,34 | 98,74 | |
| LASSO | 0,21 | -0,10 | -1,21 | 8,29 | 0,0873 | -34,54 | 0,4143 | 97,90 |
| Straight-line | 0,13 | -0,11 | -1,31 | 7,22 | 0,0621 | -30,96 | 0,4714 | 97,72 |
| XGBoost | 0,24 | -0,12 | -1,38 | 8,83 | 0,0949 | -30,93 | 0,4524 | 97,60 |
| RandomForest | 0,16 | -0,18 | -2,10 | 8,42 | 0,0644 | -31,16 | 0,3476 | 96,35 |
| MLP | -0,43 | -0,62 | -7,14 | 6,30 | -0,2365 | -35,44 | 0,6000 | 87,84 |
Source: Original research results
The benchmark, an equally weighted passive strategy with monthly rebalancing, served as a reference. The results indicate that the economic performance of ranking-based strategies was generally limited. The LightGBM model showed the best performance, with a positive monthly geometric return and a final value superior to the initial investment. Regularized linear models, such as Ridge and Elastic Net, also exhibited slightly positive geometric returns. However, models like Linear, LASSO, XGBoost, Random Forest, and MLP showed negative geometric returns, indicating a loss of value over time. The difference between average and geometric return reflects the impact of volatility, resulting in negative compound growth for most models, where the variability of returns exceeded the expected average gain. The performance differences between models were small, and Sharpe ratios remained low, indicating that the risk-return relationship of the strategies was unattractive. The economic evaluation window of 21 months is relatively short, implying that the results are sensitive to specific market conditions and limiting the robustness of the conclusions.
Temporal evolution of the strategies’ performance
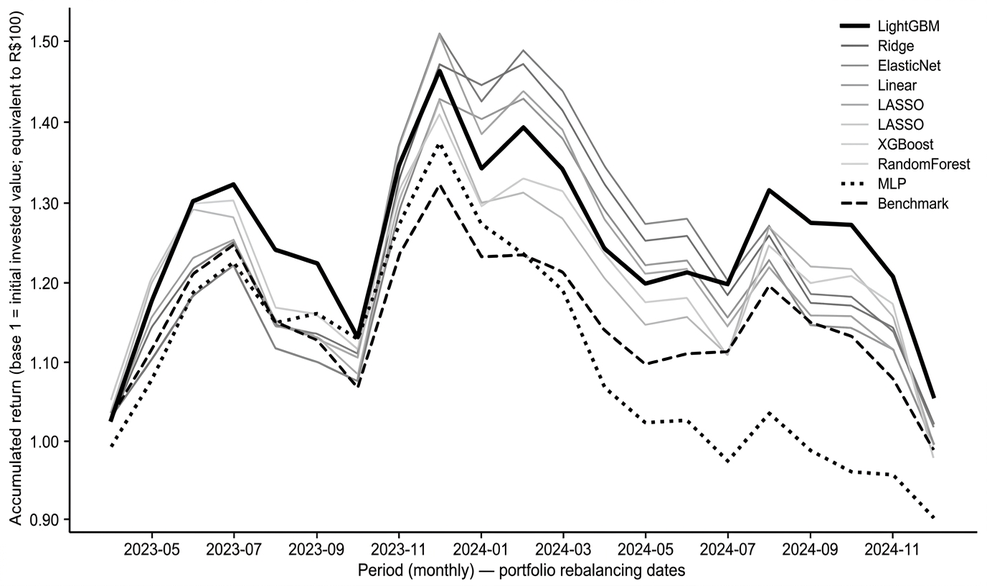
Figure 1 shows the temporal evolution of the accumulated return of ranking-based strategies in the test set period, built from the compound capitalization of the monthly returns of each model, including the benchmark.
Figure 1. Evolution of the accumulated return of strategies based on machine learning models
Source: Original research results
The analysis of Figure 1 shows relevant differences in the performance trajectory between the strategies. The best-performing model presented a relatively more consistent growth trajectory, albeit with episodes of decline, while the worst-performing model exhibited progressive capital deterioration. The benchmark showed intermediate behavior, with a smaller amplitude of variation, reflecting the effect of diversification. The strategies did not follow monotonic growth trajectories, being characterized by alternating cycles of gains and losses. Small differences in model predictions can translate into relevant impacts on accumulated performance, reinforcing the sensitivity of the strategies to the relative ordering of assets. The dispersion between the curves at the end of the period was limited, suggesting that the performance difference stems more from punctual successes than from persistent advantages, aligned with low predictive capacity. The presence of prolonged drawdown periods in almost all strategies highlights the significant associated risk, even in cases of positive final performance, reinforcing the importance of evaluating the temporal dynamics of losses in contexts of high volatility.
Relationship between turnover and economic performance
The incorporation of operational costs, even if simplified, altered the relative ordering of the models, highlighting the importance of accurate modeling of these costs. Table 8 presents the impact of estimated operational costs on the performance of the strategies, including annualized returns and final values before and after cost deduction, as well as metrics associated with portfolio turnover.
Table 8. Impact of transaction costs on strategy performance
| Model | Gross annual return (%) | Gross final value (R$) | Average monthly turnover | Total of traded assets | Total cost est. (R$) | Net. ann. ret. (%) | Net final value (R$) |
|---|---|---|---|---|---|---|---|
| LightGBM | 3,15 | 105,58 | 0,5619 | 118 | 2,36 | 1,76 | 103,10 |
| Crest | 1,22 | 102,14 | 0,4619 | 97 | 1,94 | 0,10 | 100,18 |
| ElasticNet | 1,00 | 101,75 | 0,4429 | 93 | 1,86 | -0,07 | 99,87 |
| Reference Standard | -0,72 | 98,74 | -0,72 | 98,74 | |||
| LASSO | -0,21 | 99,62 | 0,4143 | 87 | 1,74 | -1,21 | 97,90 |
| Straight-line | -0,19 | 99,67 | 0,4714 | 99 | 1,98 | -1,31 | 97,72 |
| XGBoost | -0,29 | 99,49 | 0,4524 | 95 | 1,90 | -1,38 | 97,60 |
| RandomForest | -1,28 | 97,77 | 0,3476 | 73 | 1,46 | -2,10 | 96,35 |
| MLP | -5,78 | 90,10 | 0,6000 | 126 | 2,52 | -7,14 | 87,84 |
Source: Original research results
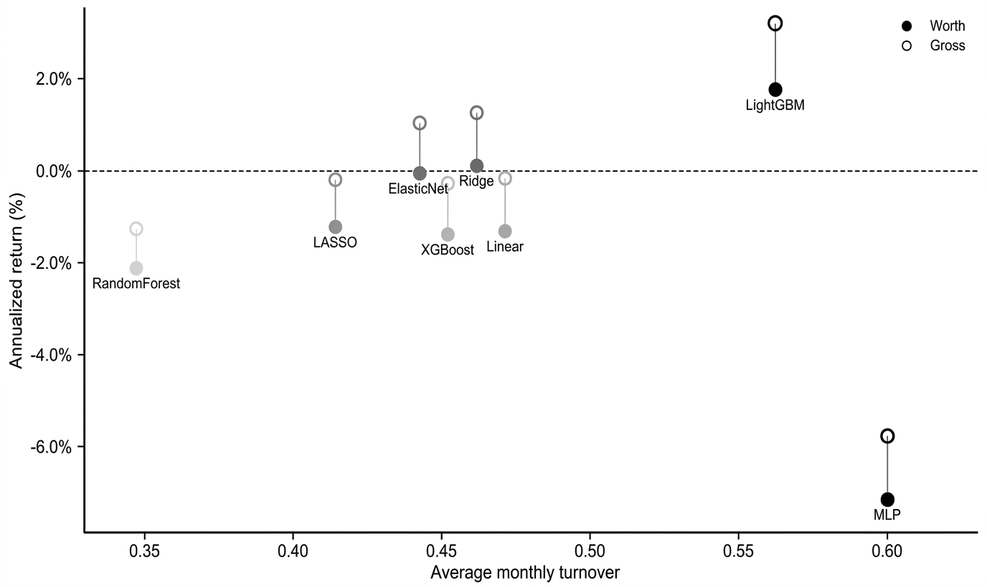
The comparison between gross and net returns shows that the incorporation of costs not only reduces the return but can alter the relative ordering of strategies. Models with superior gross performance may become inferior after cost deduction, especially with high turnover, indicating that evaluation based solely on gross returns can be biased. The average monthly turnover varied between 0.35 and 0.60. Strategies with higher turnover, such as LightGBM and MLP, presented higher accumulated costs. In contrast, models with lower turnover, like Random Forest, had lower return erosion, suggesting that strategy efficiency depends on the interaction between predictive capability and trading intensity. Figure 2 illustrates the relationship between average monthly turnover and net annualized return.
Figure 2. Relationship between average monthly turnover and net annualized return of the strategies
Source: Original research results
Figure 2 does not show a clear monotonic relationship between turnover and performance, indicating that higher levels of turnover do not necessarily imply worse economic performance. However, there is greater dispersion of results among strategies with higher turnover, suggesting that turnover amplifies performance variability by increasing exposure to operational costs. This result indicates that the economic impact of turnover is determined by the interaction between operational costs and the quality of the predictive signal. Strategies with higher relative ordering capacity can offset trading costs, while models with low predictive capacity tend to have their performance deteriorated. The modeling of operational costs is central to the evaluation of machine learning strategies, and the use of simplified proxies, although useful for comparison, may not fully capture real market frictions, overestimating the economic performance of the strategies.
Integrated interpretation of results
The results showed low predictive capacity of the models, with negative R² in the out-of-sample set (Table 6), indicating that they did not outperform predictions based on the historical average of returns. This is consistent with the high volatility and low signal-to-noise ratio of the target variable (Table 5). Despite this limitation, small differences in estimates were sufficient to generate variations in the economic performance of the strategies (Table 7), due to the ranking selection mechanism, where the relative ordering of assets was more relevant than absolute precision. However, these variations were reduced and did not constitute robust evidence of consistent value generation, with the strategies showing net performance close to the benchmark, with occasional gains dependent on the period. The incorporation of operational costs reduced returns and, in some cases, altered the relative ordering of the strategies, highlighting the influence of trading intensity. The relationship between turnover and performance (Figure 2) did not indicate a clear monotonic pattern. The comparison with the benchmark revealed a trade-off between active and passive strategies; although some strategies outperformed the benchmark at certain times, the latter showed lower volatility and more controlled drawdowns (Table 7 and Figure 1), reflecting the effect of diversification. The temporal analysis indicated an absence of persistent superiority among the models, with frequent alternation of performance, suggesting a strong dependence on the time frame. Overall, the evaluated models did not present consistent capacity for generating risk-adjusted returns superior to the benchmark.
4. Conclusion
This work aimed to compare the predictive and economic performance of machine learning models and traditional statistical methods in estimating future returns and constructing ranking-based investment strategies in the Brazilian stock market. It was found that all evaluated models exhibited low predictive capacity on the test set, with negative determination coefficients, indicating that their predictions were, on average, inferior to a naive strategy. Despite marginal differences in predictions, these generated variations in the economic performance of the strategies, albeit of low magnitude and unstable over time. The LightGBM model achieved the best economic performance, but with limited gains compared to the benchmark after incorporating operational costs. No consistent evidence of generating risk-adjusted return superior to the benchmark was observed. The main contribution of the study lies in the systematic evaluation of different machine learning model families in a challenging emerging market, highlighting the importance of operational cost modeling and the limited practical viability of alpha generation strategies in the tested configurations.
The study’s limitations included simplification in operational cost modeling, which did not account for components like slippage and market impact, and the restriction of the asset universe to the 50 most liquid ones, limiting the generalization of results to less traded assets. Additionally, the 21-month economic evaluation window implies sensitivity of the results to specific market conditions. For future studies, it is suggested to implement more robust temporal validation, such as walk-forward approaches, systematic hyperparameter tuning, more realistic modeling of market frictions, and the exploration of different portfolio construction and rebalancing rules, as well as a review of the criteria for defining the investable universe.
Bibliographic References
ARISMENDI-ZAMBRANO, J.; LEONE ALEXANDRE, A.; GENARO, A. Intraday returns forecasting using machine learning: evidence from the Brazilian stock market. SSRN Electronic Journal, 2023. DOI: 10.2139/ssrn.5122977. Acesso em: 9 set. 2025.
BENETTI, C.; DECOURT, R.; RENATO, P. The practice of corporate finance in Brazil and in the USA: comparative survey evidence. São Paulo: ICN Business School; Universidade do Vale do Rio dos Sinos; Catholic University of Santiago de Guayaquil, 2007. Disponível em: https://www.researchgate.net/publication/265454641. Acesso em: 4 nov. 2025.
BRITO, A. D. Instability of returns and liquidity during the Covid-19 pandemic: evidence from the Brazilian stock market. Revista de Administração UFSM, v. 17, n. 2, p. 1–19, 2024. Disponível em: https://periodicos.ufsm.br/reaufsm/article/view/84713. Acesso em: 9 set. 2025.
CARVALHO, G. A. de. Pricing of liquidity risk in the Brazilian stock market. Revista Brasileira de Finanças, v. 19, n. 3, p. 67–94, 2021. Disponível em: https://periodicos.fgv.br/rbfin/article/view/81844. Acesso em: 8 set. 2025.
CFA SOCIETY BRASIL. Using machine learning to separate good and bad equity mutual fund managers: evidence from Brazil. São Paulo: CFA Society Brasil, 2024. Disponível em: https://cfasociety.org.br/wp-content/uploads/2024/09/final_paper.pdf. Acesso em: 14 out. 2025.
DE PRADO, M. L. Advances in financial machine learning. Hoboken: John Wiley & Sons, 2018. Acesso em: 7 fev. 2026.
FAMA, E. F.; FRENCH, K. R. A five-factor asset pricing model. Journal of Financial Economics, v. 116, n. 1, p. 1–22, 2015. DOI: 10.1016/j.jfineco.2014.10.010. Acesso em: 10 jan. 2026.
FELIZARDO, C.; PINTO, A. A study on neural network architecture applied to the prediction of Brazilian stock returns. arXiv preprint, arXiv:1901.09143, 2019. Disponível em: https://arxiv.org/abs/1901.09143. Acesso em: 1 nov. 2025.
GIACOMINI, R.; WHITE, H. Tests of conditional predictive ability. Econometrica, v. 74, n. 6, p. 1545-1578, 2006. DOI: 10.1111/j.1468-0262.2006.00718.x. Acesso em: 19 jan. 2026.
GU, S.; KELLY, B.; XIU, D. Empirical asset pricing via machine learning. The Review of Financial Studies, v. 33, n. 5, p. 2223–2273, 2020. DOI: 10.1093/rfs/hhaa009. Acesso em: 19 jan. 2026.
HARVEY, C. R.; LIU, Y.; ZHU, H. …and the cross-section of expected returns. The Review of Financial Studies, v. 29, n. 1, p. 5–68, 2016. DOI: 10.1093/rfs/hhv059. Acesso em: 19 jan. 2026.
HENRIQUE, B. M.; SOBREIRO, V. A.; KIMURA, H. Stock price prediction using support vector regression on daily and up to the minute prices. Journal of Finance and Data Science, v. 5, n. 1, p. 1–12, 2019. DOI: 10.1016/j.jfds.2018.04.003. Acesso em: 1 nov. 2025.
VARTANIAN, P. R. The VIX index and the volatility of the Latin American and G7 markets. International Journal of Economics and Finance, v. 15, n. 4, p. 1–15, 2023. DOI: 10.5539/ijef.v15n12p25. Acesso em: 1 nov. 2025.
Article originating from the Course Conclusion Work of the Specialization in Data Science and Analytics of the MBA USP/Esalq
To learn more about the course, click here and access the MBX Academy platform