
September 09, 2026
Optimized Portfolios in the Brazilian Market: Selic Rate, Efficient Frontier, and Risk Allocation
Alessandro Damião Paulin; Veruska Evanir Pereira
DOI: 10.22167/2675-6528-202602125
Article derived from a Final Course Work (TCC), with content based on the student’s original work and adapted to the editorial format of the Revista E&S with the support of the ResumeAI tool, an artificial intelligence solution developed by the Pecege Institute for textual synthesis and organization.
Abstract
The efficient allocation of capital in emerging markets faces challenges when the interest rate varies, affecting the expected return and risk of portfolios. This study investigated how the variation of the SELIC rate influences the structure of optimized portfolios in the Brazilian stock market. Markowitz’s mean-variance optimization was applied to six representative assets (Petrobras, Vale, Itaú Unibanco, Banco Bradesco, Ambev, and Magazine Luiza), using historical data from January 2020 to March 2026 (1,543 daily observations). Four SELIC scenarios (2%, 5%, 10%, and 15%) were analyzed, calculating risk-return metrics (Sharpe Ratio, Value at Risk, Conditional Value at Risk). The maximum Sharpe portfolio progressively concentrated on Petrobras as the SELIC rate increased, reaching 100% at SELIC rates of 10% and 15%, with the Sharpe ratio decreasing from 0.5949 to 0.2717 (a 54.3% deterioration). The minimum variance portfolio maintained a stable sector composition but showed a negative excess return at SELIC rates of 10% and 15%. Comparison with the Ibovespa Index revealed the superiority of the optimized portfolios; however, the IBOV presented a negative Sharpe ratio at a SELIC rate of 15% (-0.3426). It was concluded that optimal allocation in emerging markets should be dynamic, adjusting to the macroeconomic environment, and that practical concentration restrictions are necessary to mitigate the instability of the Markowitz model.
Keywords: Brazilian stock market; Markowitz Model; Portfolio optimization; Risk-return; SELIC rate.
1. Introduction
Portfolio management in the Brazilian capital market operates in a unique macroeconomic environment, marked by high interest rates and volatility. At the beginning of 2026, the benchmark interest rate of the Special System for Settlement and Custody (SELIC) reached fifteen percent per year, a level significantly higher than the historical low of two percent recorded in 2021. This scenario reflects the Central Bank’s efforts to contain inflationary pressures (CBC, 2026).
This context of high interest rates redefines the attractiveness of fixed-income assets, such as Tesouro Selic, which becomes a benchmark for opportunity cost for any risky investment. Consequently, the allocation of resources to variable-income assets, such as stocks traded on B3, requires an even more careful analysis of the risk-return relationship (Galdi et al., 2023). This need is amplified in a market with high concentration in a few companies, such as Petrobras (PETR4) and Vale (VALE3), which together represent a substantial portion of the Ibovespa index.
The challenge of building efficient portfolios in this environment is amplified by the dynamics of volatility and correlation between assets (Costa, 2024). Recent studies show that, during crisis periods, the correlation between assets in the Brazilian market tends to increase, which limits the benefits of traditional diversification (Martins et al., 2025). Furthermore, the strong connection with international markets exposes local investors to external volatility shocks, as observed during the global banking instability of 2023 (Bambo, 2025).
Modern finance theory, consolidated by Markowitz (Markowitz, 1952), offers the mean-variance model as a fundamental tool for portfolio optimization. However, the direct application of this model in Brazil faces criticism, mainly due to the sensitivity of the results to estimation errors of the input parameters, such as means, variances, and covariances. This can lead to unrealistic portfolio allocations with low out-of-sample performance (Sampaio et al., 2025).
Academic literature has explored alternatives to improve portfolio optimization in Brazil. Oliveira et al. (2024) investigated the use of “resampling” techniques to mitigate the estimation problems of the Markowitz model, but found no evidence of superiority over classic optimization. Barroso et al. (2021) proposed the integration of technical analysis strategies into multi-objective optimization, seeking to capture different dimensions of asset behavior.
However, a gap persists in the literature: the in-depth analysis of how the SELIC rate variation, as a representation of the risk-free asset, impacts the efficient frontier and the optimal composition of portfolios in different macroeconomic scenarios. This gap is especially relevant considering the high concentration of the Brazilian stock market. The dynamics and effects of the risk-free asset return in an environment of high interest rates, such as the Brazilian one, are still little explored from a risk management perspective, despite being a pillar of the asset pricing model (CAPM) and portfolio optimization.
The research problem that emerges from this context is: in what way does the variation of the SELIC rate, as a premise for the risk-free asset return, influence the structure of optimal portfolios and the risk-return relationship for investors in the Brazilian stock market, and what are the implications for risk management in a scenario of high sectoral concentration?
The practical and theoretical relevance of this research justifies its undertaking. For fund managers, financial analysts, and individual investors, it is crucial to understand the impact of interest rates on optimal asset allocation, especially in a market where fixed income offers a competitive alternative. Within the scope of controlling, the sensitivity analysis of the portfolio to variations in the risk-free rate provides subsidies for more robust risk management aligned with corporate objectives.
Thus, the general objective of this work is to analyze the impact of the SELIC rate variation on the composition of stock portfolios optimized according to the mean-variance criterion in the Brazilian market, considering a diversified asset base. Specifically, we seek to: (a) construct the efficient frontier for a portfolio composed of representative assets from different sectors of the Brazilian market (PETR4, VALE3, ITUB4, BBDC4, ABEV3, MGLU3) under different SELIC rate levels; (b) evaluate the changes in optimal asset allocation and sectoral composition resulting from variations in the risk-free rate; (c) calculate and compare risk-return metrics (Sharpe ratio, Value at Risk, standard deviation) for each SELIC rate scenario; and (d) discuss the implications of the results for portfolio management, sectoral diversification analysis, and risk mitigation in different interest rate environments in the Brazilian context.
2. Material and Methods
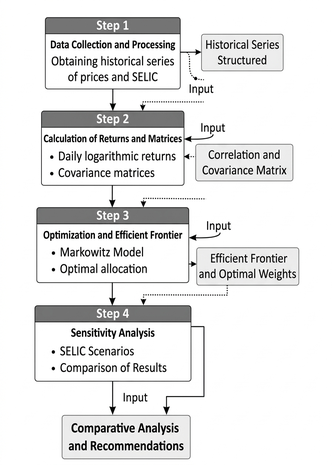
The present study is classified as a quantitative research, of a descriptive nature and with an ex post facto design. The quantitative approach was used to test the objective relationship between the variables (return, risk, and SELIC rate) using statistical and mathematical models to analyze numerical data, as recommended by Creswell and Creswell (2023). The descriptive nature aimed to describe the characteristics of the risk-return relationship and the composition of optimal portfolios under different scenarios, without active manipulation of variables by the researcher (Gil, 2022). The ex post facto design was based on the analysis of historical data of events that have already occurred (variation in asset prices and the SELIC rate) to investigate cause-and-effect relationships, an approach common in econometric studies with secondary data (Wooldridge, 2020). The flowchart of the research steps is presented in Figure 1.
Figure 1. Research steps flowchart
Source: Original research data
The research was structured in four sequential methodological stages. The first stage involved data collection and processing, obtaining historical series of daily closing prices for the analyzed assets and the SELIC rate. In the second stage, daily logarithmic returns were calculated, and the matrices of expected returns and covariance, necessary for portfolio modeling, were constructed. The third stage applied Markowitz’s portfolio selection model to minimize portfolio variance at different return levels, constructing the efficient frontier. Finally, the fourth stage consisted of a sensitivity analysis, repeating the optimization procedure for different SELIC rate levels (2%, 5%, 10%, and 15%), followed by a comparative analysis of the results.
The study sample is non-probabilistic and intentional, composed of six stocks representing different sectors of the Brazilian stock market. The analysis period covers daily data from January 2020 to March 2026, totaling more than five years of observations. Price data were collected via the Yahoo Finance API, and SELIC rate data were obtained from the Central Bank of Brazil. Table 1 lists the six selected stocks.
Table 1. Selected assets for investment portfolio composition
| Active | Ticker Symbol | Sector |
|---|---|---|
| Petrobras | PETR4 | Energy |
| Okay | VALE3 | Mining |
| Itaú Unibanco | ITUB4 | Financial |
| Bradesco Bank | BBDC4 | Financial |
| Ambev | ABEV3 | Consumption |
| Magazine Luiza | MGLU3 | Retail |
directly integrating the optimized portfolio as an allocated asset.
Source: Original research data
The analytical procedures were based on Modern Portfolio Theory and Markowitz’s (1952) mean-variance optimization model. This included estimating asset returns, measuring risk through the covariance matrix, and determining efficient portfolios through quadratic optimization. The empirical operationalization of the model was sequential.
Initially, the daily logarithmic return of the assets was calculated by the difference between the natural logarithms of consecutive closing prices. The return in period (t) was calculated according to Eq. (1):
Rt = ln (Pt / Pt-1) (1)
where Rt represents the return in period t, Pt corresponds to the closing price in period t and Pt-1 refers to the closing price in the immediately preceding period.
Next, the expected return and risk of the portfolio were estimated. The expected return of the portfolio corresponds to the weighted average of the expected returns of the individual assets, and the risk is measured by the portfolio variance, obtained from the combination of asset weights and the covariance matrix. These relationships are formalized by Eq. (2) or in matrix form (3):
E(Rp) = ∑i=1 wiE(Ri) (2)
E(Rp) = wT E(R) (3)
where wi represents the weight of asset (i) in the portfolio, E(Ri) corresponds to the expected return of asset i, w is the portfolio weights vector, and Σ represents the covariance matrix of returns.
Subsequently, mean-variance optimization was performed, minimizing portfolio variance for a given expected return level, with the restriction that the sum of asset weights equaled one. The solution to this problem generated the efficient frontier, representing the optimal combinations between risk and return, according to Eq. (4) and (5):
σp² = ∑i=1n ∑j=1n wiwjσij (4)
min/w wTΣw (5)
Finally, the performance and sensitivity of the portfolios were analyzed. For each portfolio on the efficient frontier, the Sharpe Ratio was calculated, which expresses the excess return per unit of risk relative to the risk-free rate, according to Eq. (6):
S = (E(Rp)-Rf) / σp (6)
where E(Rp) represents the expected return of the portfolio, Rf corresponds to the risk-free rate, and σp indicates the portfolio’s standard deviation. Sensitivity analysis was performed by recomputing the efficient frontier and the Sharpe Ratio under different values of the risk-free rate, corresponding to the SELIC rate scenarios. Additionally, the historical “Value at Risk” [VaR] (95% and 99%) and the CVaR (95% and 99%) were estimated to measure the potential maximum loss associated with the optimal portfolios in each scenario.
3. Results and Discussion
The analysis of historical data for the six selected assets, covering the period from January 2020 to March 2026, provided a detailed overview of risk and return behavior in the Brazilian stock market. Initial results revealed significant heterogeneity in asset performance, with Petrobras showing the highest average annual return but also considerable volatility. On the other hand, Magazine Luiza recorded the worst performance, characterized by a negative average annual return and the highest volatility among the studied assets.
The descriptive statistics of annual logarithmic returns indicated that Petrobras obtained an average annual return of 26.52% and a volatility of 42.40%, while Magazine Luiza presented a negative average annual return of -39.75% and the highest volatility of 68.90%. Ambev, in turn, proved to be the asset with the lowest risk, with volatility of 28.75%, but with a more modest return of 1.74%. The presence of high kurtosis for most assets, notably Petrobras with 31.19, suggests a more frequent occurrence of extreme events than expected in a normal distribution, which is a critical factor for risk management in emerging markets.
The analysis of return asymmetry and kurtosis is crucial in emerging markets, where non-Gaussian return behavior is a common characteristic, especially during periods of high interest rates. The findings of the present study corroborate the observations of Viana et al. (2024) regarding the importance of considering such behaviors. The high kurtosis in Petrobras, for example, indicates that risk models assuming normality, such as the traditional parametric Value at Risk, may underestimate tail risk, reinforcing the need for more robust metrics like historical VaR or Conditional Value at Risk (CVaR) for accurate risk measurement in stress scenarios.
The correlation matrix between the daily logarithmic returns of the assets revealed a positive correlation among all of them, being a fundamental element for portfolio diversification. The strong correlation of 0.79 between Itaú Unibanco and Banco Bradesco stood out, indicating that both assets respond similarly to movements in the financial sector. The lowest correlation, 0.23, was observed between Vale and Ambev, suggesting diversification potential when combining an asset from the mining sector with one from the consumer sector. The moderate correlation between Petrobras and the other assets, ranging between 0.28 and 0.48, reflects the influence of macroeconomic and sectoral factors.
Portfolio optimization in emerging markets is sensitive not only to the correlation structure but also to the instability of input parameters. The empirical results obtained, as discussed by Oliveira et al. (2024), do not indicate that resampling techniques outperform the traditional Markowitz mean-variance optimization model, suggesting that this model remains a robust benchmark, despite its known limitations. The high correlation between financial sector assets in the sample exemplifies a practical challenge, where sector concentration can limit the benefits of diversification.
The analysis of tail risk metrics for maximum Sharpe portfolios in different SELIC rate scenarios revealed a progressive increase in risk as the SELIC rate rises. In the scenario of SELIC at 2%, the 95% Value at Risk (VaR) was -3.04% per day, indicating a 5% probability of the portfolio losing more than 3.04% in one day. However, when the SELIC reached 15%, the 95% VaR increased to -3.62% per day, representing a 19% increase in tail risk. The Conditional Value at Risk (CVaR), which measures the average loss in the worst 5% or 1% of cases, proved to be even more severe.
This behavior aligns with the observations of Gondim Neto (2025), who highlighted the difficulty of obtaining attractive risk premiums in high interest rate scenarios in Brazil. The increase in VaR as SELIC rises reflects a critical dynamic: in high interest rate environments, the optimizer tends to concentrate the portfolio in assets with higher expected returns, such as Petrobras, which increases volatility and, consequently, tail risk. This is a fundamental trade-off between optimizing the Sharpe Ratio and mitigating tail risk.
The sectoral decomposition of optimal portfolios by SELIC scenario showed a clear pattern. The maximum Sharpe portfolio progressively concentrated on the energy sector (Petrobras) as SELIC increased, moving from 72.9% at SELIC 2% to 100% at SELIC 10% and 15%. In contrast, the minimum variance portfolio maintained a stable sectoral composition across all scenarios, with 45% in consumption (Ambev), 27.8% in mining (Vale), and 27.2% in financial (Itaú Unibanco), with minimal exposure to the energy sector. This behavior demonstrates the high sensitivity of the maximum Sharpe strategy to the level of the risk-free rate, while the minimum variance strategy seeks stability.
The sectoral concentration in energy in the maximum Sharpe strategy illustrates the instability of the Markowitz optimizer, a problem addressed by Santos et al. (2022) who proposed the integration of technical analysis with the model to mitigate this instability. The results of the present study confirm that, when an asset, such as Petrobras with its expected return of 26.52%, shows significantly superior performance to others, the optimizer tends to allocate the maximum possible to this asset, especially when the risk-free rate increases and reduces the risk premium of other assets.
The concentration indices of the portfolios, including the Herfindahl-Hirschman Index (HHI), the Gini Coefficient, and the Effective Number of Assets, reinforce the observations on allocation. The maximum Sharpe portfolio showed an HHI of 0.6045 at SELIC 2%, which increased to 1.0000 at SELIC 10% and 15%, indicating total concentration in a single asset. The effective number of assets, which measures how many assets with equal weights would have the same HHI, decreased from 1.65 at SELIC 2% to 1.00 at SELIC 10%, confirming extreme concentration. In contrast, the minimum variance portfolio maintained a stable HHI of 0.3532 across all scenarios, equivalent to 2.83 effective assets, demonstrating more robust diversification.
This contrast between the two optimization strategies illustrates a fundamental dilemma in portfolio management: the pursuit of risk-adjusted returns (Sharpe) can lead to extreme concentrations, while the pursuit of safety (minimum variance) offers diversification, but with potentially inadequate returns. Jha et al. (2025) propose adaptive minimum variance frameworks that consider sensitivity to macroeconomic factors as an intermediate solution. The present study highlights the need for managers to impose maximum concentration constraints per asset to avoid corner solutions, which may be unrealistic or undesirable in practice.
The comparison of the optimized portfolios with the Ibovespa Index (IBOV), the main benchmark of the Brazilian market, demonstrated the superiority of the maximum Sharpe portfolio in all SELIC scenarios. At SELIC 2%, the optimized portfolio offered a return of 23.56% with a Sharpe Ratio of 0.5949, significantly superior to the IBOV, which presented a return of 6.61% and a Sharpe Ratio of 0.1881. This difference widened with the increase in SELIC; at SELIC 15%, the Sharpe Ratio of the optimized portfolio was 0.2717, while the IBOV registered a negative Sharpe Ratio of -0.3426. This result is revealing, as in scenarios of high interest rates, the IBOV does not offer sufficient return to compensate for the risk.
This phenomenon, documented in the literature by Viana et al. (2024), who observed that during periods of high interest rates in Brazil, the Sharpe ratio of stock portfolios becomes negative, making the Tesouro SELIC a more attractive alternative, is corroborated by the data. When the SELIC reaches 15%, the IBOV offers an expected return of only 6.61%, insufficient to compensate for the risk of 24.49% volatility. This suggests that, in scenarios of very high interest rates, the optimal allocation could include a significant proportion of risk-free assets, which transcends the scope of this study but deserves future investigation.
The sensitivity analysis of asset weights in the maximum Sharpe portfolio revealed a critical dynamic: as the SELIC increases, the optimizer progressively reduces the allocation in Vale, from 27.1% to 0%, and increases it in Petrobras, from 72.9% to 100%. This behavior occurs because, with a higher risk-free rate, the risk premium offered by Vale (return of 15.60% minus SELIC) becomes less attractive relative to Petrobras (return of 26.52% minus SELIC). The inflection point, where Vale is completely eliminated from the portfolio, occurs between SELIC 5% and SELIC 10%.
None of the other assets, such as Itaú, Bradesco, Ambev, and Magazine Luiza, were selected in any scenario for the maximum Sharpe portfolio, as their expected returns are lower than those of Petrobras and Vale, making them inefficient on the efficient frontier. This result illustrates a practical limitation of the Markowitz model, where in a scenario with only two efficient assets, diversification is severely limited. Oliveira et al. (2024) highlight that this instability of weights is one of the main criticisms of the pure Markowitz model, and managers frequently implement maximum weight restrictions per asset to avoid extreme concentrations.
The Sharpe Ratio’s sensitivity to SELIC variation proved asymmetric between the two optimization strategies. The maximum Sharpe portfolio reduced its Sharpe from 0.5949 (SELIC 2%) to 0.2717 (SELIC 15%), a drop of 54.3%. In contrast, the minimum variance portfolio decreased from 0.2451 to -0.3065, a drop of 225%. The difference between the two strategies increased as SELIC rose, going from 0.3498 at SELIC 2% to 0.5782 at SELIC 15%. This pattern reveals that the maximum Sharpe strategy is more resilient to increases in the risk-free rate, maintaining an expected return that compensates for risk even in high interest rate scenarios, while the minimum variance strategy becomes progressively inadequate.
This result has significant practical implications for portfolio managers. In a rising SELIC environment, a manager following the minimum variance strategy would see their Sharpe ratio deteriorate rapidly, becoming negative. This suggests that, in emerging markets like Brazil, where the interest rate is volatile, the choice of optimization strategy must take into account the expected macroeconomic scenario. Jha et al. (2025) propose adaptive models that adjust the strategy as macroeconomic conditions change, an approach that could mitigate this problem.
The decomposition of return into excess return and risk premium revealed a critical pattern. While the expected return of the maximum Sharpe portfolio remained relatively stable, between 23.56% and 26.52%, the excess return significantly decreased as SELIC increased, from 21.56% at SELIC 2% to 11.52% at SELIC 15%, a reduction of 46.6%. This occurs because the increase in the risk-free rate reduces the premium the investor receives for taking on risk. The minimum variance portfolio, on the other hand, offered a constant expected return of 7.78%, but its excess return became negative at SELIC 10% and 15%, indicating that the risk is not compensated.
The risk premium, measured in basis points (bps), decreased from 2156 bps at SELIC 2% to 1152 bps at SELIC 15% for the maximum Sharpe portfolio. For the minimum variance portfolio, the premium became negative at SELIC 10% (-222 bps) and 15% (-722 bps). This result has an important implication: in scenarios of high SELIC, the risk premium offered by Brazilian stocks may be insufficient to compensate for the risk, making fixed-income securities, such as Tesouro SELIC, a more attractive alternative. This dynamic is documented in Gondim Neto (2025), who analyzed the composition of Brazilian portfolios in different interest rate environments.
In summary, the sensitivity analysis of the optimized portfolios to the variation of the SELIC rate revealed a critical dynamic in the Brazilian stock market, where the increase in the risk-free rate leads to the concentration of the optimal asset allocation in Petrobras, reducing diversification. This behavior highlights that the Markowitz model, although robust, produces corner solutions that limit its practical applicability in high-interest environments, impacting the risk-return relationship and the need for more dynamic portfolio management strategies that are adaptive to the macroeconomic environment.
4. Conclusion
The study analyzed the impact of the SELIC rate variation on the composition of stock portfolios optimized according to the mean-variance criterion in the Brazilian market, using a diversified asset base. It was found that the portfolio with the maximum Sharpe Ratio progressively concentrated on Petrobras as the SELIC rate increased, reaching 100% allocation in scenarios of 10% and 15% SELIC. This concentration resulted in a deterioration of the Sharpe Ratio from 0.5949 to 0.2717. In contrast, the minimum variance portfolio maintained a stable sectoral composition but showed a negative excess return in scenarios with SELIC at 10% and 15%. The comparison with the Ibovespa Index revealed the superiority of the optimized portfolios, although the IBOV registered a negative Sharpe Ratio at 15% SELIC, indicating that the benchmark did not offer sufficient return to compensate for risk in high interest rate environments. This dynamic highlights that the pursuit of risk-adjusted returns in emerging markets, especially in a high interest rate environment, tends to favor concentrated allocations, evidencing a critical trade-off between diversification and performance.
The main contribution of this work lies in offering a quantitative framework that allows portfolio managers and investors to dynamically anticipate and adjust optimization strategies according to variations in the SELIC rate and the macroeconomic environment. However, it was observed that the Markowitz model, in its unrestricted application, produces corner solutions that limit diversification and its practical applicability, especially in high interest rate scenarios where few assets prove efficient. To mitigate this instability and the extreme concentration observed, it is suggested that future studies incorporate maximum allocation constraints per asset and per sector. Additionally, the inclusion of fixed-income assets, such as Tesouro SELIC and corporate bonds, and derivatives, is recommended for a more comprehensive analysis of optimal allocation and to determine the appropriate proportion of risk-free assets in Brazilian portfolios under different interest rate regimes.
Bibliographic References
Bambo, A.A.T. 2025. Impacto das estratégias de gestão do risco usadas para mitigação do risco financeiro em um contexto de volatilidade nos bancos comerciais em Moçambique: estudo de caso do banco Beta (2022-2024). ALBA-ISFIC Research and Science Journal, 1(8), 256-267.
Banco Central do Brasil. 2026, 28 de janeiro. Copom mantém a taxa Selic em 15,00% a.a. Comunicado da 276ª reunião do Comitê de Política Monetária. Banco Central do Brasil. Disponível em: Acesso em 02 mar. 2026
Barroso, B.C.; Cardoso, R.T.N.; Melo, M.K. 2021. Performance analysis of the integration between Portfolio Optimization and Technical Analysis strategies in the Brazilian stock market. Expert Systems with Applications, 186, 115788. Disponível em: Acesso em 04 mar. 2026
Costa, K.F. 2024. Otimização de carteiras de investimentos baseadas em ETFs através dos modelos de Markowitz e Black-Litterman. LUME. Repositório Digital. Universidade Federal do Rio Grande do Sul.
Creswell, J. W.; Creswell, J.D. 2023. Research design: Qualitative, quantitative, and mixed methods approaches (6th ed.). Sage publications.
Galdi, F.C; Brugni, T.V; Silveira, E.C; Santos, F.A; 2023. Tesouro Selic 2025 e CDB DI: um estudo de duas opções à poupança. RBC recebe Qualis B2, 65.
Gil, A.C. 2022. Como elaborar projetos de pesquisa (7th ed.). Atlas.
Gondim Neto, J.G. 2025. Aplicação do value at risk e índice de sharpe para composição de carteira de investimentos: Application of Value at Risk and Sharpe Ratio for Investment Portfolio Composition. RCMOS – Revista Científica Multidisciplinar O Saber, 1(2). Disponível em: Acesso em 06 mar. 2026
Jha, A.; Shirvani, A.; Jaffri, A.; Rachev, S.T. 2025. Advancing portfolio optimization: adaptive minimum-variance portfolios and minimum risk rate frameworks. arXiv preprint. Cornell University. Disponível em: Acesso em 07 mar. 2026
Markowitz, H. 1952. Portfolio selection. The Journal of Finance, 7(1), 77–91. Disponível em: Acesso em 04 mar. 2026
Martins, P.R.; Silva, P.N.; Vasconcellos, C.F. 2025. Seleção de carteiras de investimento: um modelo a quatro momentos. Proceeding Series of the Brazilian Society of Computational and Applied Mathematics, 11(1), 1-6. Disponível em: Acesso em 03 mar. 2026
Oliveira, A.B., Trucíos, C.; Pereira, P.L.V. 2024. Portfolio resampling in the Brazilian stock market: Can it outperforms Markowitz optimization? Brazilian Review of Finance, 22(3), 57–75. Disponível em: Acesso em 04 mar. 2026
Sampaio, Y.L.G.; Nascimento, J.O., Nakano, C.A.; Sanchez, E.M; Lugoboni, L.F.; Zittei, M.V.M. 2025. Análise das teorias de portfólio: existe mais do que apenas Markowitz. Contabilometria, Brazilian Journal of Quantitative Methods Applied to Accounting. 12(1).
Santos, A.A.P; Torrent, H.S. 2022. Markowitz meets technical analysis: Building optimal portfolios by exploiting information in trend-following signals, Finance Research Letters, Elsevier, vol. 49(C). Disponível em: Acesso em 07 mar. 2026
Viana, M. C. B., da Silva, A. L. C.; Roquete, R.M. 2024. The role of alternative investments in Brazilian portfolios. Brazilian Review of Finance*, 22(2), 93–111. Disponível em: Acesso em 05 mar. 2026
Wooldridge, J.M. 2020. Introductory econometrics: A modern approach (7th ed.). Cengage Learning.
Article originating from the Final Course Work of the Specialization in Finance and Controllership of the MBA USP/Esalq
To learn more about the course, click here and access the MBX Academy platform