
September 15, 2026
Evaluation of the Implementation of Master Data Management and the Challenges of Change Management
Julyana Cerqueira Buery; Gleison De Souza
DOI: 10.22167/2675-6528-202602247
Article derived from a Final Course Work (TCC), with content based on the student’s original work and adapted to the editorial format of the Revista E&S with the support of the ResumeAI tool, an artificial intelligence solution developed by the Pecege Institute for textual synthesis and organization.
Abstract
This study analyzed the implementation and sustainability of a Master Data Management (MDM) initiative focused on product data, with special attention to the role of Change Management (CM) in this process. The objective was to evaluate the initiative three years after its implementation, based on the perceptions of employees and managers directly involved in operational activities related to master data. The research collected data from a team of 46 people in a global organization through a structured questionnaire using a Likert scale. The data were analyzed with descriptive statistics (Mean). The results indicated a general trend of agreement in the evaluated dimensions, suggesting that the MDM initiative was successfully implemented and integrated into daily organizational routines, with the Adoption and Integration dimension demonstrating a high level of operational maturity. However, intermediate average scores in the dimensions of governance, organizational culture, and long-term sustainability revealed that the initiative has not yet achieved full institutionalization. Although MDM was perceived as value-generating, this perception was not entirely uniform. Regarding Change Management, the results suggested that the implementation process was effective but faced challenges in sustaining the change over time, especially in terms of continuous reinforcement, leadership engagement, and cultural alignment. It was concluded that the initiative is in an intermediate stage of maturity, combining strong operational adoption with ongoing organizational challenges.
Keywords: Data Culture; Change Management; Data Governance; Organizational Maturity.
1. Introduction
Master Data Management, or Master Data Management, is a global trend in managing large volumes of data, ranging from global companies to small businesses (Shaikh et al., Sharma, 2024). This industrial and governance practice emerged mainly in the early 2000s, driven by the growing business need for data integration.
By definition, Master Data Management is a technology-enabled business practice in which business and Information Technology areas work in an integrated manner. Its benefits consist of ensuring uniformity, accuracy, responsible management, governance, semantic consistency, and accountability of the organization’s official and shared master data (Loshin, 2009; Silvola et al., 2011; Otto, 2011; Parker, 2025). Buffenoir and Bourdon (2013) add that Master Data Management can be understood as a data governance paradigm that aims to ensure consistency and quality of information, establishing a single point of reference for data shared among various systems within an organization.
The implementation of Master Data Management in organizations offers clear benefits, such as improved data quality, strengthened information governance, and support for effective strategic decisions (Hikmawati et al., 2021; Pansara, 2024). However, despite significant financial and personnel investment in technology and processes, the success of these initiatives critically depends on the organization’s ability to manage the profound changes associated with implementation. The definition of roles, responsibilities, and the integration between business areas and Information Technology are determining factors for the success or failure of the intended change (Hikmawati et al., 2021; Norejko et al., 2024; Kalluri et al., 2025).
In this context, Change Management plays a central role in the adoption of Master Data Management initiatives, as organizational discipline, alignment between areas, and cultural transformation are indispensable for generating the necessary change in master data management (Heikkinen and Pekkola, 2019). Furthermore, sustaining the change over time represents a significant challenge after the initial implementation phase. When sustainability is weakened, the expected benefits of the project may be compromised (Heikkinen and Pekkola, 2019; Pansara, 2021; Shaikh et al., 2024; Elahi, 2026).
The literature highlights the importance of factors such as continuous reinforcement, cultural alignment, and clarity of responsibilities for consolidating change. It is therefore relevant to evaluate Change Management initiatives within the scope of Master Data Management, in order to verify their capacity to generate practical and sustainable results, effectively integrated into organizational routines and supported by mechanisms of governance, leadership, and culture. In organizations involved in product resale and distribution, Master Data Management initiatives are essential for integrating commercial and logistical processes throughout the supply chain (Otto and Österle, 2015; Haug et al., 2023), making Change Management a critical success factor, especially in environments with multiple systems and business units that rely on consistent data (Heikkinen and Pekkola, 2019; Haug et al., 2023).
With a specific focus on the Biotechnology industry, in the resale and distribution of products segment, this work aims to analyze the implementation and sustainability of a Master Data Management initiative focused on product data, with special attention to the role of Change Management in this process.
2. Material and Methods
The research had exploratory and descriptive objectives, with a quali-quantitative approach. Data were collected from employees and managers of an operational team responsible for managing product data for the European market, in a global company for the resale and distribution of biotechnological products.
Data collection was carried out using a structured questionnaire, containing 15 specific Likert scale statements (Likert, 1932), to measure respondents’ attitudes and perceptions. The responses were organized into agreement levels and converted into numerical values, as shown in Table 1, allowing for the calculation of the arithmetic mean for each item and dimension analyzed. The option “Not possible to assess” was treated as missing data. The practice of calculating the mean on Likert scales is widely adopted in empirical studies (Boone and Boone, 2012; Joshi et al., 2015).
Table 1. Correspondence between agreement levels and numerical values of the Likert scale
| Level of agreement | Numerical value |
|---|---|
| I totally disagree | 1 |
| I disagree | 2 |
| Neutral | 3 |
| I agree | 4 |
| I fully agree | 5 |
| Could not evaluate | Not applicable |
Source: Elaborated by the author based on Likert (1932)
The questionnaire was made available online via “Google Forms”, containing 18 closed-ended items and three open-ended questions. It was drafted in English to accommodate the linguistic differences of the respondents. The open-ended questions aimed to collect details about employee perception and suggestions regarding Change Management (CM) and the sustainability of the Master Data Management (MDM) initiative. For the discursive responses, thematic analysis (Braun and Clarke, 2021) was used, which involved exploratory reading, initial coding, and grouping into categories, allowing for the identification of perception patterns regarding benefits and opportunities for improvement.
The questionnaire dissemination occurred through internal social networks and professional emails, with weekly reminders, over a period of 24 days. The items were organized into 6 sessions, including demographic profile and 5 dimensions for evaluating the CM initiative for MDM implementation: Adoption and Integration; Sustainability and Governance; Culture and Leadership; Value Generation; and Overall Assessment. The instrument’s development was based on a literature review, which included books, scientific articles, corporate documents, and academic studies, providing the theoretical basis for defining the dimensions and concepts.
3. Results and Discussion
The research was conducted with the voluntary participation of 20 professionals from a global biotechnology company, working in product data management for the European market. Data collection occurred anonymously to preserve the individuals’ identities.
Demographic Profile
The demographic profile of the participants was collected through questions about nationality, length of service in the organization, presence during the implementation of the MDM initiative, and current position, as detailed in Table 2.
Table 2. Demographic profile of participants
| Elements | Response options | Attendees | Percentage |
|---|---|---|---|
| Nationality | Portuguese | 6 | 30% |
| British | 6 | 30% | |
| French | 3 | 15% | |
| Spanish | 1 | 5% | |
| Did not want to answer | 4 | 20% | |
| Sum | 20 | 100% | |
| Length of service in the organization | Less than 3 years | 4 | 20% |
| 3 to 7 years | 6 | 30% | |
| 8 to 12 years | 3 | 15% | |
| More than 12 years | 7 | 35% | |
| Sum | 20 | 100% | |
| Employed in Jan/2023 | Yes | 16 | 80% |
| No | 4 | 20% | |
| Sum | 20 | 100% | |
| Current position | Specialist | 11 | 55% |
| Manager | 3 | 15% | |
| Senior Manager | 1 | 5% | |
| Analyst | 2 | 10% | |
| Temporary contract | 2 | 10% | |
| Sum | 20 | 100% |
Source: Original research results
The team of participants is composed of diverse nationalities, with the majority being Portuguese (30%) and British (30%), and 20% did not report. An experienced profile was observed, with 35% of respondents having more than 12 years of experience in the company and 30% between 3 and 7 years. The majority (80%) were already in the organization during the implementation of the MDM initiative in January 2023, indicating familiarity with the process. Specialists represented the largest portion of participants (55%), which lends robustness to the results, given their direct involvement in data operation and management, as highlighted in the literature (Reichert et al., 2013; Otto and Österle, 2015; Haug et al., 2023; Raharjo et al., 2023).
Assessment of Dimensions
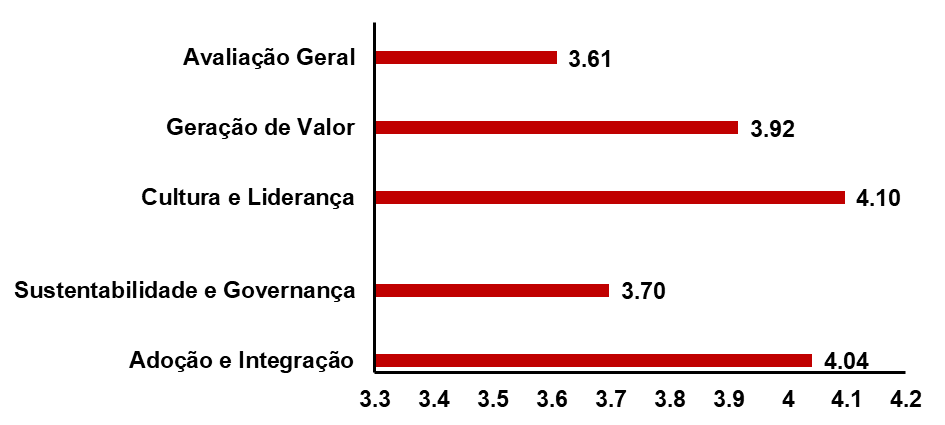
The arithmetic means of the responses were calculated for each specific statement and for the five dimensions evaluated, presented in Table 3 and Figure 1.
Table 3. Arithmetic means of the responses (converted to numbers according to the Likert scale) of the specific statements and the 5 dimensions evaluated in the questionnaire
| Dimensions | Specific affirmations | Specific averages | Means of the dimensions |
|---|---|---|---|
| Dimension 1: Adoption and Integration | 1.1 The MDM initiative represents the standard way of working currently. | 4.00 | |
| 1.2 MDM processes and tools are used consistently. | 4.00 | ||
| 1.3 The initiative is incorporated into day-to-day operations. | 4.13 | 4.04 | |
| Dimension 2: Sustainability and Governance | 2.1 New collaborators receive adequate guidance on MDM. | 3.44 | |
| 2.2 The documentation related to MDM is updated and accessible. | 3.50 | ||
| 2.3 There is clarity regarding the responsibilities for the maintenance and governance of data masters. | 3.79 | ||
| 2.4 The governance structure supports the MDM initiative. | 4.07 | 3.70 | |
| Dimension 3: Culture and Leadership | 3.1 The MDM initiative is aligned with the current organizational culture. | 4.07 | |
| 3.2 Leadership reinforces behaviors related to data quality and governance. | 4.00 | ||
| 3.3 Data discipline is perceived as a natural part of everyday work. | 4.22 | 4.10 | |
| Dimension 4: Value Generation | 4.1 The MDM initiative continues to generate value for the organization. | 4.08 | |
| 4.2 The organization would be at a disadvantage without this initiative. | 3.81 | ||
| 4.3 The benefits achieved justify the investment made. | 3.86 | 3.92 | |
| Dimension 5: Overall Assessment | 5.1 Over the past three years, the change management associated with the MDM initiative has been successful. | 3.75 | |
| 5.2 The initiative declared sustainability after its implementation. | 3.47 | 3.61 |
Source: Original research results
Figure 1. Visual comparison of the arithmetic means between the results of the 5 dimensions evaluated by the specific questionnaire statements
Source: Original research results
Dimension 1: Adoption and Integration
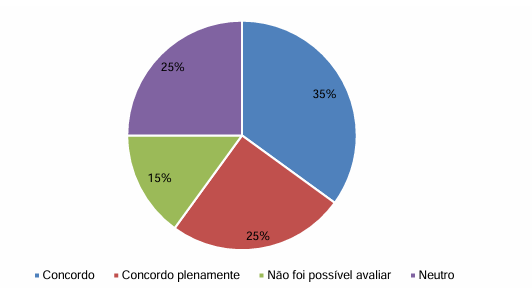
The “Adoption and Integration” dimension showed a high level of incorporation of the MDM initiative into team operations, with an average of 4.04 (Table 3, Figure 1). Statement 1.1, which addresses the representation of MDM as the standard way of working, obtained an average of 4.00, with a predominance of agreement responses (Figure 2). This suggests that the MDM initiative is recognized as an integral part of the teams’ operational model, aligning with literature that describes MDM as an integrated organizational discipline (Surasani et al., 2025).
Figure 2. Survey respondents’ perception of specific statement 1.1: The MDM initiative represents the standard way of working currently
Source: Original research results
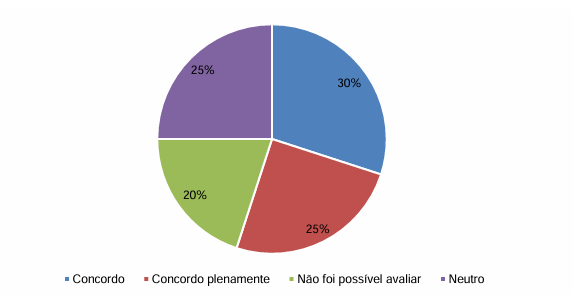
Statement 1.2, regarding the consistent use of MDM processes and tools, also showed a concentration of positive responses, with an average of 4.00 (Figure 3). However, the presence of neutral responses indicates variations in application among teams, which can be attributed to the different roles and knowledge levels of professionals. The literature corroborates that the effectiveness of MDM depends on interdepartmental coordination and that consistency in process application is a challenge in complex environments (Surasani et al., 2025; Krishnasamy, 2024; Adapa, 2025).
Figure 3. Survey respondents’ perception of the specific statement 1.2: MDM processes and tools are used consistently
Source: Original research results
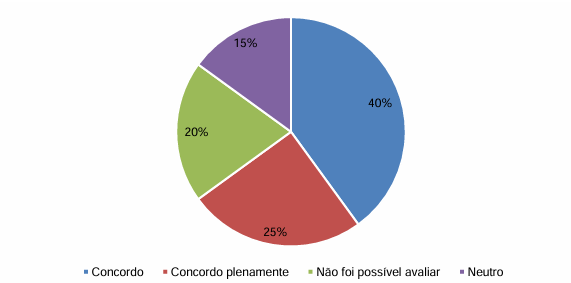
Statement 1.3, regarding the incorporation of MDM into daily operations, obtained the highest average for the dimension (4.12, Table 3, Figure 4). This indicates a robust perception of MDM integration into team routines, a key factor for success in data-driven environments (Adapa, 2025). The effective incorporation of MDM into daily work tends to generate value, even if adoption is heterogeneous across functions (Heikkinen and Pekkola, 2019; Haug et al., 2023). In summary, dimension 1, with an average of 4.04 (Table 3, Figure 1), reflects a high level of operational maturity and institutionalization of MDM within the organization.
Figure 4. Survey respondents’ perception of specific statement 1.3: The initiative is embedded in day-to-day operations
Source: Original research results
Dimension 2: Sustainability and Governance
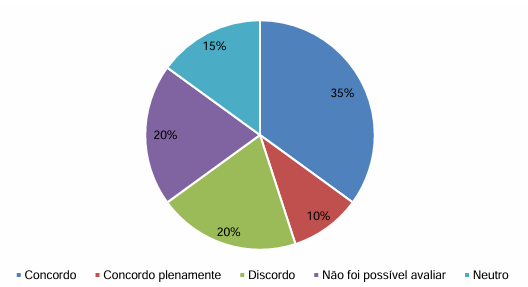
The “Sustainability and Governance” dimension showed greater dispersion in the responses (Figure 1, Table 3). Statement 2.1, regarding the orientation of new collaborators in MDM, had an average of 3.44 (Table 3), indicating heterogeneity in the responses (Figure 5). This result suggests that the onboarding and training process is not fully consolidated or homogeneous, which may affect the consistency in applying data management practices, as pointed out in the literature (Haneem et al., 2019; Surasani et al., 2025).
Figure 5. Survey respondents’ perception of specific statement 2.1: New collaborators receive adequate guidance on MDM
Source: Original research results
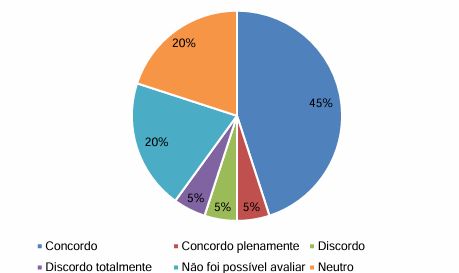
Statement 2.2, which assesses the update and accessibility of MDM documentation, obtained an average of 3.50 (Figure 6). This suggests limitations in these aspects, corroborating the literature that indicates the neglect of documentation and process standardization after initial implementation (Shaikh et al., 2024).
Figure 6. Survey respondents’ perception of specific statement 2.2: MDM-related documentation is up-to-date and accessible.
Source: Original research results
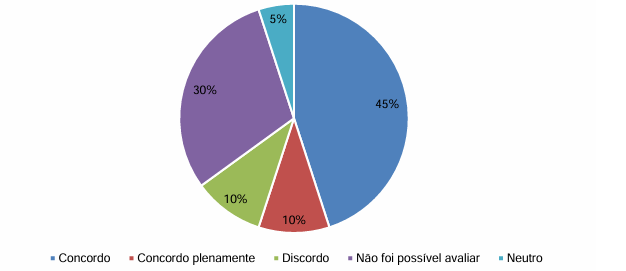
Statement 2.3, regarding the clarity of responsibilities for data maintenance and governance, registered an average of 3.79 (Figure 7). This value indicates an intermediate level of role definition, suggesting that ambiguities may persist in the understanding and application of these responsibilities among teams. The literature points out that the definition of roles and the assignment of ownership are central challenges in the consolidation of MDM, requiring continuous adjustments and impacting the effectiveness of data governance in complex organizations (Heikkinen and Pekkola, 2019; Haug et al., 2023; Shaikh et al., 2024).
Figure 7. Survey respondents’ perception of specific statement 2.3: There is clarity regarding the responsibilities for data maintenance and governance
Source: Original research results
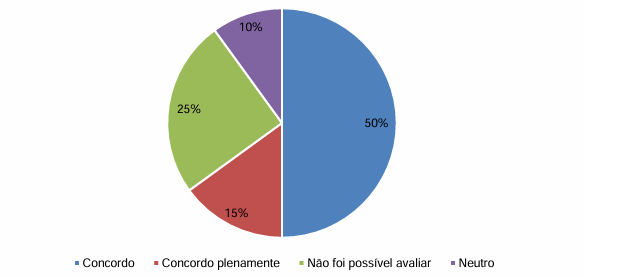
Statement 2.4, which assesses whether the governance structure supports the MDM initiative, showed high agreement, with a mean of 4.07 (Table 3, Figure 8). This indicates a relatively rapid maturation of governance, although complete consolidation is a long-term process (Surasani et al., 2025). The overall mean for dimension 2 was 3.70 (Figure 1), characterizing an intermediate stage of maturity in sustainability and governance processes, with opportunities for improvement.
Figure 8. Survey respondents’ perception of specific statement 2.4: The governance structure supports the MDM initiative
Source: Original research results
Dimension 3: Culture and Leadership
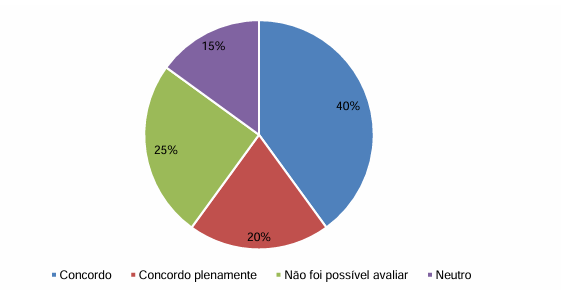
The “Culture and Leadership” dimension revealed a high level of general agreement (Figure 1). Statement 3.1, regarding the cultural alignment of the MDM initiative, obtained an average of 4.06 (Table 3), indicating good adherence to the organizational culture (Figure 9). This alignment is crucial for the consolidation of MDM, with data culture being a critical success factor (Surasani et al., 2025).
Figure 9. Survey respondents’ perception of specific statement 3.1: The MDM initiative is aligned with the current organizational culture
Source: Original research results
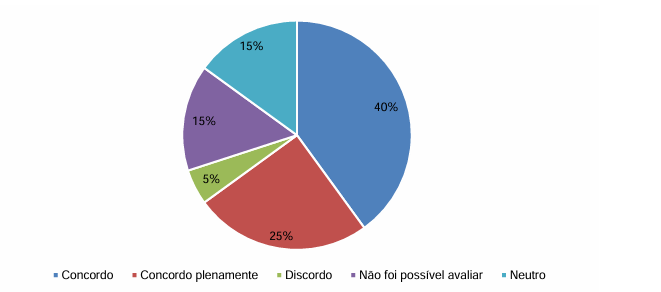
Statement 3.2, which addresses leadership reinforcing behaviors related to data quality and governance, presented an average of 4.00 (Table 3, Figure 10). This suggests that leadership support is perceived, although with room for strengthening. Active leadership is fundamental for sustaining data initiatives (Shaikh et al., 2024; Surasani et al., 2025), and the results indicate a maturation of the MDM initiative within the team.
Figure 10. Survey respondents’ perception of the specific statement 3.2: Leadership reinforces behaviors related to data quality and governance
Source: Original research results
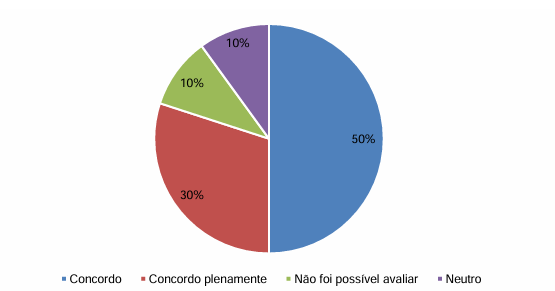
Statement 3.3, which addresses the perception of data discipline as a natural part of daily work, obtained the highest average for the dimension (4.22, Table 3, Figure 11). This demonstrates that the team is aware of the responsibility in handling master data, a crucial aspect for data governance maturity (Sargiotis, 2024). Dimension 3, with an average of 4.09, reflects a high level of cultural and leadership maturity, contributing to the consolidation of MDM through cultural alignment, leadership support, and internalization of data discipline.
Figure 11. Survey respondents’ perception of specific statement 3.3: Data discipline is perceived as a natural part of everyday work
Source: Original research results
Dimension 4: Value Generation
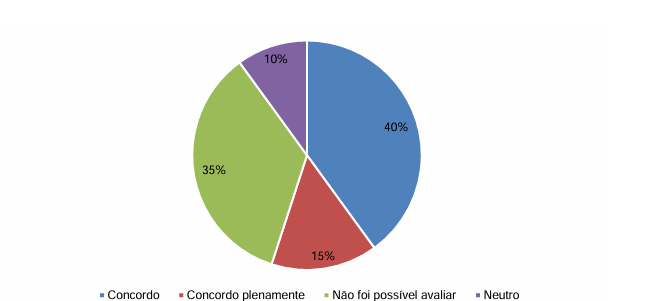
The “Value Generation” dimension showed a positive, although not uniform, perception (Figure 1). Statement 4.1, regarding the continuity of MDM value generation for the organization, obtained an average of 4.08 (Table 3, Figure 12). This indicates that respondents recognize the benefits of MDM after three years of implementation, a finding that aligns with the literature on the continuous value generation of MDM over time (Shaikh et al., Schmuck, 2024).
Figure 12. Survey respondents’ perception of specific statement 4.1: The MDM initiative continues to generate value for the organization
Source: Original research results
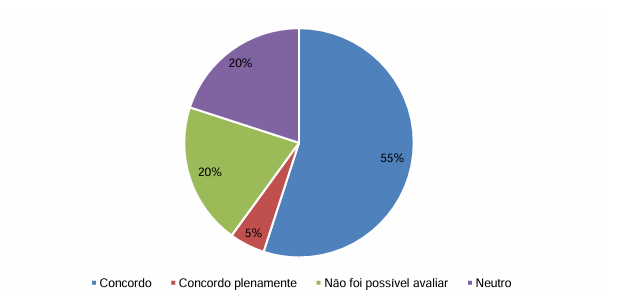
Statement 4.2, which assesses whether the organization would be at a disadvantage without the MDM initiative, obtained an average of 3.81 (Table 3, Figure 13). This moderate perception of agreement is in line with the literature, which highlights the contribution of MDM to competitive advantage by treating data as strategic assets and supporting organizational decisions (Haug et al., 2023).
Figure 13. Survey respondents’ perception of specific statement 4.2: The organization would be at a disadvantage without this initiative
Source: Original research results
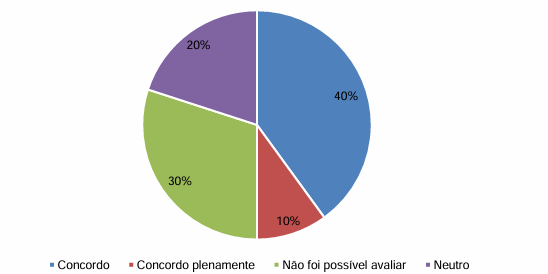
Statement 4.3, regarding the justification of investment in the MDM initiative by the benefits achieved, registered an average of 3.86 (Table 3, Figure 14). This suggests a partial recognition of benefits or an information gap regarding the investment, given that half of the respondents could not evaluate or were neutral. Dimension 4, with an average of 3.92, indicates an intermediate maturity in the perception of value generation, which tends to grow with MDM maturation (Shaikh et al., 2024).Figure 14. Respondents’ perception of the survey on specific statement 4.3: The benefits achieved justify the investment made
Source: Original research results
Dimension 5: Overall Assessment
The “Overall Evaluation” dimension highlights challenges and opportunities for improvement. Perceptions regarding change management and initiative sustainability obtained averages of 3.75 and 3.47 (Table 3), respectively. These results indicate positive perceptions, but not yet fully consolidated.
The overall average of dimension 5 was 3.61, the lowest among all dimensions, indicating an intermediate stage of agreement. This finding reinforces the literature that points to the long-term sustainability of MDM as the main challenge, not its initial implementation (Shaikh et al., 2024; Surasani et al., 2025).
Thematic analysis: word cloud
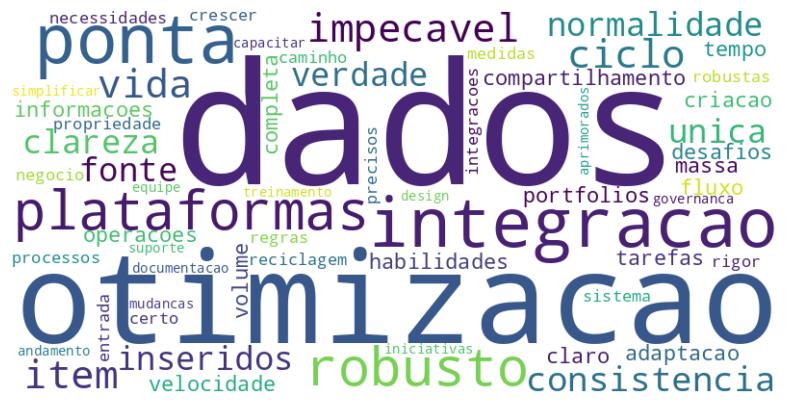
The answers to the open-ended questions, analyzed with the aid of the word cloud (Figure 14), revealed a predominantly positive perception of the benefits of MDM. Participants highlighted the improvement in data quality, system integration, and greater operational efficiency, with terms such as “single source of truth” and “clarity” indicating greater reliability and support for decision-making. These findings are in line with the literature, which emphasizes the role of MDM in standardizing, integrating, and optimizing processes (Otto and Österle, 2015; Haug et al., 2023). However, challenges were identified for the sustainability of the initiative, including the definition of responsibilities, strengthening governance, the need for continuous training, and the robustness of technological processes and integrations.
Figure 14. Word cloud of the open-ended responses about the benefits of MDM implementation and opportunities for improvement for its sustainability
Source: Original research results
The significant presence of “Neutral” and “Unable to assess” responses in various statements suggests variations in the participants’ level of knowledge and involvement with the MDM initiative. This pattern indicates that the perception of MDM is not uniform across teams, possibly due to gaps in communication, training, or integration of data management practices, reinforcing the interpretation that the initiative is in an intermediate stage of maturity, where adoption and understanding are not yet fully consolidated.
In summary, the results indicate that the MDM initiative demonstrated success in adoption and integration into organizational operations, with the “Adoption and Integration” dimension revealing a high level of recognition and incorporation of MDM into daily routines. However, the dimensions of governance, organizational culture, and sustainability have not yet reached full consolidation, presenting points of fragility related to clarity of responsibilities, dissemination of governance practices, and institutionalization of a data culture. Value generation is perceived positively, albeit not uniformly, suggesting observable benefits with potential for expansion. Change management, despite being effective in implementation, faces challenges in long-term sustainability, evidenced by the lower average in the “Overall Evaluation” dimension. This positions the MDM initiative at an intermediate stage of maturity, with strong operational adoption, but with the need for continuous improvements in governance, data culture, and change management to achieve higher levels of maturity and sustainable value generation.
4. Conclusion
This study analyzed the implementation and sustainability of a Master Data Management (MDM) initiative focused on product data, with special attention to the role of Change Management (CM) in this process, three years after its implementation. It was found that the MDM initiative was widely adopted and integrated into the organization’s daily operations, with the Adoption and Integration dimension demonstrating a high level of operational maturity. It was observed that data discipline is perceived as a natural part of daily work and that the initiative continues to generate value for the organization, although this perception is not entirely uniform among respondents. However, it was identified that the initiative is in an intermediate stage of maturity, with intermediate average scores in the dimensions of Sustainability and Governance, Culture and Leadership, and Value Generation. Change Management, although effective in the implementation phase, faced challenges in sustaining the transformation over time, especially regarding the continuous reinforcement of behaviors, leadership engagement, and cultural alignment, which was reflected in the lower average of the Overall Assessment dimension.
The main contribution of this work lies in providing empirical evidence on the implementation and sustainability of MDM initiatives in a real-world context of reselling and distributing biotechnology products, a sector still underexplored in academic literature. The results offer practical insights for organizations seeking to strengthen data governance, expand clarity of responsibilities, and continuously develop a data culture to ensure the initiative’s evolution to higher levels of maturity and value generation. Limitations include the small sample size and the use of perceptual data. It is suggested that future research deepen the analysis through broader quantitative approaches or comparative studies across different sectors and organizational contexts.
Bibliographic References
Loshin, D. 2009. Master Data Management. Morgan Kaufmann, Burlington, EUA. Disponível em: . Acesso em: 16 abr. 2
Shaikh, A.; Harreis, H.; Machado, J.; Rowshankish, K.; Saxena, R.; Jain, R. 2024. Master data management: the key to getting more from your data. McKinsey Digital. Disponível em: https://www.mckinsey.com/~/media/mckinsey/business%20functions/mckinsey%20digital/our%20insights/master%20data%20management%20the%20key%20to%20getting%20more%20from%20your%20data/master-data-management-the-key-to-getting-more-from-your-data.pdf. Acesso em: 03 abr. 2026.
Sharma, R. 2024. Master Data Management: A Must for Every Organization. ResearchGate. Disponível em: . Acesso em: 03 abr. 2026.
Article originating from the Final Course Work of the Specialization in Project Management of the MBA USP/Esalq
To learn more about the course, click here and access the MBX Academy platform