
September 16, 2026
Application of Machine Learning in the Analysis and Classification of Paleomagnetic Data from the São Francisco Craton
Oscar Andres Lazcano Patroni; João Vitor Matos Gonçalves
DOI: 10.22167/2675-6528-202602300
Article derived from a Final Course Work (TCC), with content based on the student’s original work and adapted to the editorial format of the Revista E&S with the support of the ResumeAI tool, an artificial intelligence solution developed by the Pecege Institute for textual synthesis and organization.
Summary
Paleomagnetic data are crucial for paleogeographic reconstructions; however, directional dispersion and remagnetizations hinder the acquisition of reliable averages. The potential of unsupervised machine learning techniques was evaluated in the analysis and interpretation of paleomagnetic data from the São Francisco Craton, focusing on the Tonalito Itarerú and Sienito Itiúba formations, aiming to improve the determination of average directions. The DBSCAN, K-means, and Gaussian Mixture Model (GMM) algorithms were compared, using the elbow method, AIC, and BIC for parameter selection. DBSCAN stood out in detecting dense regions and outliers, although sensitive to hyperparameters. K-means provided an initial segmentation but without a clear definition of the optimal number of clusters. GMM demonstrated greater flexibility and probabilistic assignment, with minor differences between models. The methods produced complementary results, revealing plausible directional patterns. It was concluded that the integration of machine learning, classical statistics, and geological interpretation is a promising approach for paleomagnetic exploratory analysis, and it is recommended to expand the databases and adopt directional statistics approaches.
Keywords: Exploratory Data Analysis; Machine Learning; Clustering; DBSCAN; K-means.
1. Introduction
Paleomagnetic data constitute the main source of information for paleogeographic reconstructions. This is because paleomagnetism is the only geophysical tool capable of anchoring the position of tectonic plates relative to the Earth’s rotation axis over geological time (Butler, 1992; Tauxe, 2010; Torsvik et al., 2008). Accurate paleogeographic reconstructions are essential not only for understanding geodynamic processes but also for studies on past climatic dynamics (Donnadieu et al., 2006), the paleobiogeographic distribution of fossils (Middlemiss, 1979), and the absolute position of continental and oceanic masses, which are fundamental for constraining paleoclimatic numerical models (Herold et al., 2008; Hollis et al., 2019).
Paleomagnetic directions form the basis of paleomagnetic studies, and statistical approaches for their analysis have evolved significantly over the past two decades, with advances ranging from the analysis of individual directions to the study of directional groupings (Heslop and Roberts, 2016; Tauxe et al., 2004; Vaes et al., 2021; Heslop et al., 2023). However, the utility of this data depends on the ability to accurately determine the age of the magnetic remanence. Although classic field tests, such as baked contact, conglomerate, and fold tests, can identify remagnetizations, the responsible mechanisms are not always well understood. This uncertainty complicates age determination, rendering data in global paleomagnetic databases (GPMDB; Pisarevsky et al., 2022) practically unusable for paleogeographic reconstructions without the correct identification of their origins and ages.
The determination of directions by means of alternating field (AF) and thermal (TD) demagnetization methods has proven effective in separating magnetization components of natural remanent magnetization (NRM) and in obtaining consistent directions. However, in some cases, the average directions calculated for specific sites of the Tonalito Itarerú and Sienito Itiúba formations, both located in the northeastern region of the São Francisco Craton, in the state of Bahia, do not present the same coherence. The determination of these average directions can be particularly challenging, even with the consolidation of paleomagnetic methods.
An alternative still little explored to overcome these limitations is the use of statistical learning tools, capable of identifying complex and non-linear patterns in large datasets. Machine learning is a subfield of artificial intelligence that employs mathematical and statistical methods for computational systems to learn patterns from data, improving performance in specific tasks without explicit programming (Bishop, 2006; Hastie et al., 2009; Murphy, 2012). In geosciences, machine learning has been applied to process and interpret large volumes of data, including geophysical, geochemical, and paleomagnetic data (Gwirtz et al., 2022; Dallanave, 2024; Gallo et al., 2025). Specifically, unsupervised learning seeks to identify internal structures, patterns, or natural groupings in unlabeled data, being useful for exploratory analyses and clustering of paleomagnetic data. Despite the promising potential, challenges in paleomagnetism data acquisition hinder the generation of extensive, high-quality databases, leaving the potential of machine learning largely unexplored in this field.
Given this scenario, the integration of innovative approaches, such as machine learning, with classical statistics and geological interpretation, emerges as a promising strategy to enhance paleomagnetic exploratory analysis and the reliability of data used in paleogeographic reconstructions. The present work aims to investigate the use of machine learning techniques through unsupervised methods in the analysis and interpretation of paleomagnetic data, focusing on improving the determination of average directions in geological formations of the São Francisco Craton, specifically in the Tonalito Itarerú and Sienito Itiúba units, located in the state of Bahia.
2. Material and Methods
Paleomagnetism
253 oriented cylindrical core samples were extracted from 26 sites of the Itareru pluton, using a portable gasoline-powered drill rig equipped with 25.4 mm diameter diamond bits. Of these sites, 14 correspond to granodioritic facies, 8 to tonalitic facies, and 4 to basement units. At least eight oriented cores were collected per site, with orientation performed by a Pomeroy device (ASC Scientific, USA), coupled with Brunton and solar compasses. Similarly, 348 specimens were collected from 45 sites of the Itiúba Syenite, originating from three distinct lithological sets: (i) predominantly leucocratic and hypersolvus syenites, containing diopside, hornblende, and biotite; (ii) apatite-diopside layers; and (iii) alkaline granite dikes.
The core samples were cut into specimens of 22.0 × 25.4 mm, obtaining at least two or three specimens per core. For the Itareru Tonalite, 770 specimens were obtained, of which 253 were selected for paleomagnetic analyses. For the Itiúba Syenite, 1460 specimens were obtained, with 222 used for analysis.
The specimens were subjected to thermal treatments and alternating field (AF) demagnetization in successive steps to isolate the characteristic remanent magnetization. Alternating field demagnetization was conducted with pulses of 2.0 mT, 2.5 mT, 5 mT, or 10 mT, up to about 100 mT, using a Molspin AF demagnetizer or an AD-D2000T AF demagnetizer (ASC Scientific, USA). Thermal demagnetization was performed in an ASC TD-60 double-chamber furnace, with increments of 100 °C (between 100 °C and 500 °C) and 25 °C (above 500 °C). Remanent magnetization measurements were obtained with an Agico JR-6A spinner magnetometer (AGICO, Czech Republic). All laboratory procedures were conducted at the Laboratory of Magnetic Susceptibility Anisotropies and Rock Magnetism of the University of São Paulo (LAMS-IGc-USP).
The magnetization direction of each specimen was determined by the principal component analysis method (Kirschvink, 1980), using least squares fitting for lines and planes, and providing the maximum angular deviation (MAD) as a measure of uncertainty. The magnetization directions at each demagnetization step were analyzed by orthogonal projections in Zijderveld diagrams (1967) using the Agico Remasoft 3.0 software (Chadima and Hrouda, 2007).
After determining the individual directions, the vector mean was calculated to obtain the average direction of magnetization of the site, corresponding to the Characteristic Remanent Magnetization (ChRM). The magnetization directions were treated statistically based on Fisher’s statistics (1953), which describes the angular distribution of directions around the mean. The precision parameter (k) was estimated by equation (1):
k = (N-1) / (N-R)
where N is the number of directions and R is the magnitude of the resultant vector from the vector sum of these directions. The a95 confidence limit was approximated by equation (2):
a95 = 140 / sqrt(kN)
Virtual Geomagnetic Pole
The Virtual Geomagnetic Pole (VGP) was calculated based on the geographic coordinates of the sampled site and the mean direction of characteristic remanent magnetization (ChRM). Statistical analysis of the VGPs was performed based on Fisher’s (1953) statistics, allowing for the determination of mean poles and their respective precision parameters and confidence limits (A95).
Machine Learning
In geosciences applications, machine learning has been used for the processing and interpretation of large volumes of data, including paleomagnetic data. In this project, the aim was to develop a statistical model to classify and group the available paleomagnetic datasets for the Itiúba Sienite and Itarerú Tonalite. For this purpose, the DBSCAN clustering algorithm (Ester et al., 1996) was adopted as the main analysis method. Complementarily, the performance of DBSCAN was compared with other unsupervised learning algorithms, including k-means and Gaussian Mixture Model (GMM).
Density-Based Spatial Clustering of Applications with Noise – DBSCAN
DBSCAN is an unsupervised learning algorithm based on the local density of observations, capable of identifying clusters in datasets with an unknown number of groups and the presence of outliers. Its operation depends on two hyperparameters: the neighborhood radius ɛ (epsilon) and the minimum number of neighboring observations (min_samples). The ɛ neighborhood of a point xᵢ is defined as the set of observations xⱼ whose distance d(xᵢ, xⱼ) is less than or equal to ɛ, according to equation (3):
Nɛ(xᵢ) = {xⱼ ∈ X | d(xᵢ, xⱼ) ≤ ɛ}
Based on these criteria, the algorithm distinguishes core points (have at least min_samples neighbors within radius ɛ), border points (do not satisfy the density criterion but belong to the neighborhood of a core point), and noise points (do not belong to any dense region). The choice of parameter ɛ is critical and was estimated from the inflection point of the curve of the k-distance plot, a procedure known as the elbow method, where ɛ ≈ arg max (d²y / dx²). The min_samples parameter was chosen based on the dimensionality of the data, with values between 4 and 6 frequently adopted as an initial reference.
3. Results and Discussion
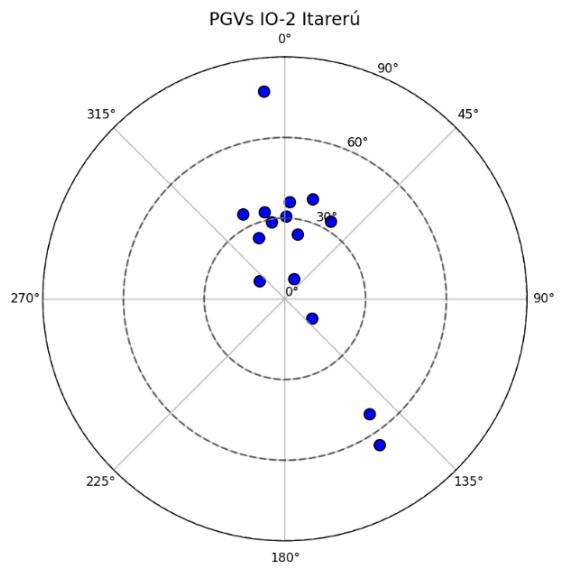
The application of clustering algorithms to the paleomagnetic data from the IO-2 site of the Itareru Tonalite allowed the identification of grouping patterns with different levels of consistency and sensitivity to the adopted parameters. The directions of the Virtual Geomagnetic Poles from the IO-2 site, Itarerú, are presented in Figure 1.
Figure 1. Directions of the Virtual Geomagnetic Poles from the IO2 site, Itarerú.
Source: Original research results.
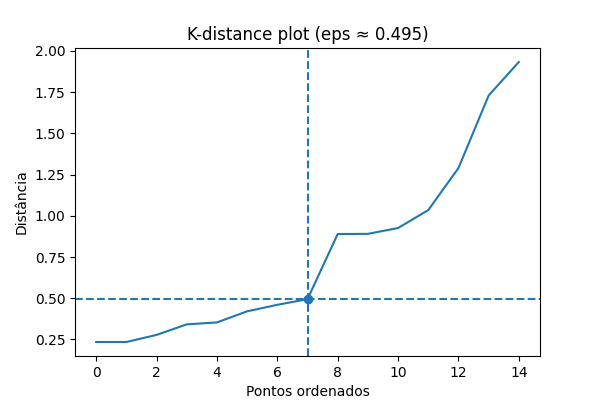
The use of DBSCAN, with the parameter ɛ estimated from the k-distance graph (Figure 2), resulted in the identification of clusters associated with regions of higher density in the attribute space. This method proved effective in separating potentially discrepant points, classified as noise, which is particularly relevant in paleomagnetic data subject to remagnetizations or experimental uncertainties. However, the amount of points classified as noise revealed sensitivity to the choice of ɛ and min_samples, reflecting the limitation imposed by the reduced number of available observations.
Figure 2. Distribution of distances to the k-th neighbor as a function of ordered points (k-distance plot), used to determine the parameter ɛ in the DBSCAN algorithm. The inflection point of the curve (elbow method), estimated by curvature analysis, indicates the transition between dense and sparse regions of the dataset.
Source: Original research results.
For K-means, the application of the elbow method (Figure 3) indicated plausible values for the number of clusters, although the inertia curve did not present a strongly defined inflection point. This suggests that the clustering structure of the data is not clearly partitioned into well-separated sets under the adopted Euclidean metric. Despite this, K-means provided an initial segmentation of the data, useful as a comparative reference, but limited by the assumption of approximately spherical clusters and the absence of explicit outlier treatment.
Figure 3. Variation of intra-cluster inertia as a function of the number of clusters (k) for the K-means algorithm. The inflection point of the curve (elbow method) indicates the estimate of the optimal number of groupings.
Source: Original research results.
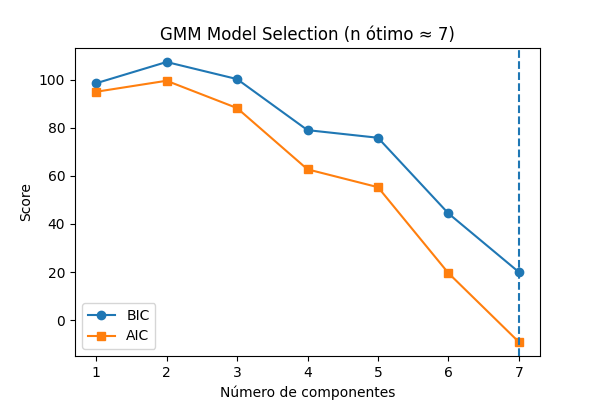
In the case of the Gaussian Mixture Model (GMM), the analysis based on the AIC and BIC criteria indicated solutions with different numbers of components (Figure 4), with BIC being more conservative in model selection. The results demonstrated the GMM’s ability to fit distributions with greater geometric flexibility, allowing the identification of clusters with distinct variances and orientations. The probabilistic assignment of cluster membership provided an additional measure of uncertainty associated with each observation. However, due to the small size of the dataset, the differences between the AIC and BIC values for different models were relatively small, which limited the robustness of the optimal number of components selection.
Figure 4. Comparison of Akaike Information Criterion (AIC) and Bayesian Information Criterion (BIC) as a function of the number of components in a Gaussian Mixture Model (GMM). The minimum of the curves indicates the most suitable model considering the trade-off between fit and complexity.
Source: Original research results.
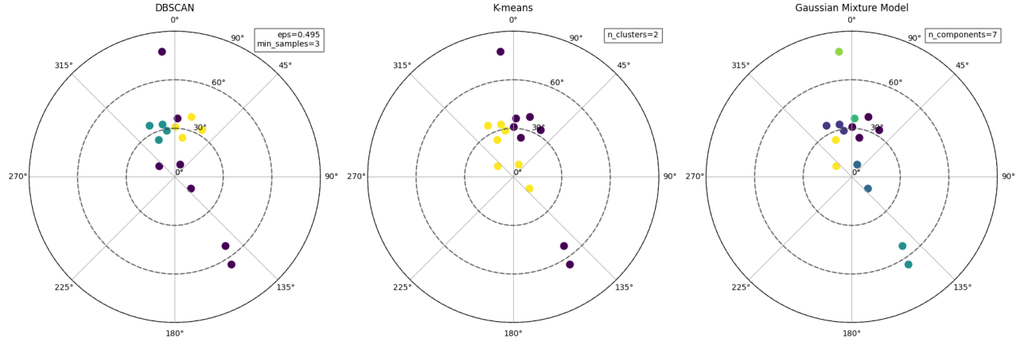
The comparative analysis of the results for the DBSCAN, K-means, and GMM algorithms, and their respective formed clusters, is presented in Figure 5. In general, the three methods presented complementary results. DBSCAN stood out in identifying dense regions and detecting potential outliers; K-means provided a simple and easily interpretable segmentation; and GMM showed a greater ability to adapt to the data structure. However, none of the methods, in isolation, was able to provide an unequivocal solution, reflecting both the complexity of the paleomagnetic data and the statistical limitations associated with the sample size.
Figure 5. Comparison of the results for the DBSCAN, K-means and GMM algorithms and respectively the formed clusters.
Source: Original research results.
The visual analysis of the stereograms proved essential for the validation of the results, allowing for the verification of the geometric coherence of the identified clusters. In several cases, it was observed that the clusters defined by the algorithms corresponded to plausible directional concentrations, albeit with partial overlap, which may indicate the presence of multiple magnetization events or natural data dispersion.
The results obtained demonstrate that the application of unsupervised machine learning techniques to paleomagnetic data constitutes a promising approach for identifying directional patterns and supporting the determination of average directions. The combined use of DBSCAN, K-means, and Gaussian Mixture Model, along with quantitative criteria such as the elbow method and AIC/BIC criteria, allowed for the exploration of different aspects of the data structure, highlighting the complementarity of these approaches.
However, the analysis also highlighted important limitations. The small size of the dataset (n ≈ 15) compromised the stability of parameter estimates and hindered the robust identification of the number of clusters or components. Additionally, the dependence of the results on the choice of hyperparameters, particularly in the case of DBSCAN, reinforces the need for careful approaches and the use of multiple validation criteria.
Another relevant aspect is the directional nature of paleomagnetic data. The use of Euclidean metrics in a transformed space constitutes an approximation that can introduce distortions in the evaluation of similarity between directions. In this sense, methods based on directional statistics, such as those based on the Fisher distribution or mixtures of spherical distributions, present greater physical consistency and should be considered in future developments.
Thus, the analyzed clustering methods are useful tools for exploratory analysis and can contribute to the identification of distinct paleomagnetic populations, especially when used in an integrated manner. However, their application must be accompanied by visual validation (through stereograms), classical statistical analysis, and geological interpretation, in order to ensure the reliability of the results. The integration between machine learning and traditional paleomagnetic statistics represents a promising path for the advancement of paleogeographic interpretations and for the improvement of paleomagnetic data analysis.
4. Conclusion
This study investigated the potential of unsupervised machine learning techniques in the analysis and interpretation of paleomagnetic data from the São Francisco Craton, focusing on the Tonalito Itarerú and Sienito Itiúba formations, aiming to improve the determination of average directions. It was found that the DBSCAN, K-means, and Gaussian Mixture Model (GMM) algorithms produced complementary results. DBSCAN stood out in identifying dense regions and detecting possible outliers, although its sensitivity to hyperparameters was noted. K-means provided an initial data segmentation, while GMM demonstrated greater flexibility and probabilistic assignment capability to clusters. Visual analysis of stereograms confirmed the geometric coherence of the identified clusters, revealing plausible directional patterns. It was concluded that the integration of machine learning, classical statistics, and geological interpretation represents a promising approach for exploratory paleomagnetic analysis, contributing to the reliability of data used in paleogeographic reconstructions.
However, the research faced significant limitations, such as the small dataset size, which compromised the stability of parameter estimates and hindered robust cluster number identification. The dependence of results on hyperparameter choice, especially in DBSCAN, reinforces the need for careful approaches and multiple validation criteria. Additionally, the use of Euclidean metrics in a transformed space for directional data may introduce distortions in similarity evaluation. For future studies, it is recommended to expand the dataset, incorporate additional validation metrics, and develop specific approaches based on directional statistics, such as those based on the Fisher distribution or mixtures of spherical distributions, for greater physical consistency. The continuous integration between machine learning and traditional paleomagnetic statistics is a promising path for advancing paleogeographic interpretations and improving paleomagnetic data analysis.
Bibliographic References
Bishop, C. M., & Nasrabadi, N. M. (2006). Pattern recognition and machine learning (Vol. 4, No. 4, p. 738). New York: springer.
Butler, R. B., 1992. Paleomagnetism: Magnetic domains to geologic terranes. http://geography.lancs.ac.uk/cemp/resources/Butler_book/contents.htm
Chadima, M. & Hrouda, F. Remasoft 3.0 Paleomagnetic Data Browser and Analyzer. https://www.agico.com/text/software/remasoft/remasoft.php. (2007).
Dallanave, Edoardo. “Assessing the reliability of paleomagnetic datasets using the R package PmagDiR.” Scientific Reports 14.1 (2024): 1666.
Donnadieu, Y., Pierrehumbert, R., Jacob, R., & Fluteau, F. (2006). Modelling the primary control of paleogeography on Cretaceous climate. Earth and Planetary Science Letters, 248(1-2), 426-437.
Ester, M., Kriegel, H. P., Sander, J., & Xu, X. (1996, August). A density-based algorithm for discovering clusters in large spatial databases with noise. In kdd (Vol. 96, No. 34, pp. 226-231).
Fisher, R. A., 1953. Dispersion on a sphere. Proceedings of the Royal Society of London, 217, 295-305
Gallo, L. C., Domeier, M., Antonio, P. Y., Sapienza, F., Rapalini, A., Font, E., … & Warren, L. (2025). Unraveling remagnetization sources using statistical learning. Earth and Planetary Science Letters, 662, 119390.
Gwirtz, K., Davis, T., Morzfeld, M., Constable, C., Fournier, A., & Hulot, G. (2022). Can machine learning reveal precursors of reversals of the geomagnetic axial dipole field?. Geophysical Journal International, 231(1), 520-535.
Hastie, T., Tibshirani, R., & Friedman, J. (2009). An introduction to statistical learning.
Herold, N., Seton, M., Müller, R. D., You, Y., & Huber, M. (2008). Middle Miocene tectonic boundary conditions for use in climate models. Geochemistry, Geophysics, Geosystems, 9(10).
Heslop, D., & Roberts, A. P. (2016). Estimation and propagation of uncertainties associated with paleomagnetic directions. Journal of Geophysical Research: Solid Earth, 121(4), 2274-2289.
Heslop, D., Scealy, J. L., Wood, A. T. A., Tauxe, L. & Roberts, A. P. A Bootstrap common mean direction test. J. Geophys. Res. Solid Earth 128, 1–12 (2023)
Hollis, C. J., Dunkley Jones, T., Anagnostou, E., Bijl, P. K., Cramwinckel, M. J., Cui, Y., … & Lunt, D. J. (2019). The DeepMIP contribution to PMIP4: Methodologies for selection, compilation and analysis of latest Paleocene and early Eocene climate proxy data, incorporating version 0.1 of the DeepMIP database. Geoscientific Model Development, 12(7), 3149-3206.
Kirschvink, J. L., 1980. The least-squares line and plane and the analysis of palaeomagnetic data. Geophysical Journal of the Royal Astronomical Society, 62, 699-718
Middlemiss, F. A. (1979). Paleobiogeography. In Paleontology (pp. 515-523). Springer, Berlin, Heidelberg.
Murphy, K. P. (2012). Machine learning: a probabilistic perspective. MIT press.
Pisarevsky, S. A., Li, Z. X., Tetley, M. G., Liu, Y., & Beardmore, J. P. (2022). An updated internet-based global paleomagnetic database. Earth-Science Reviews, 235, 104258.
Tauxe, L., & Kent, D. V. (2004). A simplified statistical model for the geomagnetic field and the detection of shallow bias in paleomagnetic inclinations: was the ancient magnetic field dipolar?.
Torsvik, T. H., Müller, R. D., Van der Voo, R., Steinberger, B., & Gaina, C. (2008). Global plate motion frames: toward a unified model. Reviews of geophysics, 46(3).
Vaes, B., Li, S., Langereis, C. G., & van Hinsbergen, D. J. (2021). Reliability of palaeomagnetic poles from sedimentary rocks. Geophysical Journal International, 225(2), 1281-1303.
Zijderveld, J. D. A., 1967. Demagnetization of rocks: Analysis of results. In D. W. Collinson, K. M. Creer, e S. K. Runcorn (Eds.), Methods in Paleomagnetism (pp. 254-286).
Article originating from the Course Conclusion Work of the Specialization in Data Science and Analytics of the MBA USP/Esalq
To learn more about the course, click here and access the MBX Academy platform