
September 15, 2026
Application of Predictive Maintenance in the Bottling of a Brewery
João Henrique Antunes Vieira; Ana Beatriz Pereira Sette
DOI: 10.22167/2675-6528-202602237
Article derived from a Final Course Work (TCC), with content based on the student’s original work and adapted to the editorial format of the Revista E&S with the support of the ResumeAI tool, an artificial intelligence solution developed by the Pecege Institute for textual synthesis and organization.
Summary
The efficiency of maintenance in filling lines is a critical factor for competitiveness in the brewing industry, directly impacting productivity and operational reliability. The study aimed to analyze the efficiency of maintenance strategies applied in two can filling lines of a brewing industry, through the evaluation of Key Performance Indicators. For this purpose, a comparative case study was conducted between two lines: one with internalized predictive maintenance and another with outsourced corrective, preventive, and predictive maintenance. The methodology involved the extraction, treatment, and modeling of operational and maintenance data, followed by the construction and analysis of performance indicators, including Line Performance, OPI NONA, Unplanned Downtime, Breakdown, and MTBF, in addition to the evaluation of the execution of time-based and condition-based maintenance orders. The results showed that the line with internalized predictive maintenance presented greater operational stability, lower incidence of unplanned stops, and better performance in the analyzed indicators. In contrast, the line with corrective and preventive maintenance showed greater variability and higher failure rates. It was concluded that the adoption of predictive maintenance contributes to increased operational reliability and improved performance in the filling process.
Keywords: Database; Data Wrangling; Indicators; Brewing Industry.
1. Introduction
Maintenance plays a crucial role in ensuring the safety and efficiency of production processes. The absence or poor execution of these activities can compromise productivity and increase risks to employees, as pointed out by Mendes (2002). Regulatory Standard NR-12 (1978), which addresses workplace safety in machinery and equipment, establishes that maintenance must be periodic, strategic, and conducted by competent professionals under safe conditions, reinforcing its legal and strategic character.
In the brewing industry, maintenance efficiency in bottling lines is a critical factor for competitiveness, directly influencing productivity and operational reliability. Brazil, in 2024, registered 1,949 breweries and a production of 15.34 billion liters, according to data from the Ministry of Agriculture and Livestock (MAPA, 2025). In this scenario, equipment reliability is essential to ensure quality and high operational performance, minimizing failures.
Studies indicate the relevance of these failures. Oke et al. (2021) observed that, in 126 days of operation, a filling line registered 664 stops due to equipment failures, with the filler, electronic bottle inspection (EBI), and labeller being the main responsible parties. Fernandes (2024) adds that a filling line can present one hundred and ninety-five thousand broken bottles in a month, with a breakdown rate of 0.92% of the time.
Among the types of maintenance, Júnior (2019) highlights corrective, preventive, and predictive maintenance. Corrective maintenance consists of the work performed to repair a failure in a machine or equipment (Bloom, 2006). Preventive maintenance, in turn, is defined by the Brazilian Standard NBR 5462 (1994) as an interval-based activity, which aims to reduce the probability of breakdowns or failures in equipment.
Predictive maintenance, also defined by NBR 5462 (1994), is distinguished by being based on the collection and analysis of data to identify anomalies in equipment operation before failures occur. Variables such as vibration, noise, temperature, and energy consumption can be monitored. This approach allows for targeted interventions, optimizing resources and reducing costs, in addition to aligning with the advances of digital transformation, which integrates intelligent sensors, real-time monitoring, and data analysis to expand its application possibilities.
In this context, the application of predictive maintenance in the bottling of breweries represents an opportunity to reduce unplanned failures, increase line availability, and strengthen the sector’s competitiveness. However, the adoption of these practices still faces challenges related to the integration of digital technologies, the necessary investment, and the training of professionals. This reality highlights the importance of investigating how digital transformation can support the implementation of predictive maintenance in bottling, contributing to safer, more efficient, and sustainable processes.
Thus, the objective of this study is to analyze the effect of internalized predictive maintenance on the efficiency and availability of a brewery’s bottling line over time through the identification and definition of relevant KPIs for the line and the evaluation of these indicators. In this way, it will be possible to determine the impact of this maintenance strategy on the operational performance of the process.
2. Material and Methods
This work was a case study that evaluated predictive maintenance and its results on the KPIs of productivity and fulfillment of maintenance orders in a brewing industry. The analysis was conducted through the comparison of two packaging lines: one based on internalized predictive maintenance; and another on preventive maintenance, however outsourced.
The company under study was a large Dutch brewery, with 13 factories in Brazil. The bottling lines studied are located in Alexânia (GO) [ALE] and Alagoinhas (BA) [ALA]. The ALE line was consolidated, with stable KPIs and a production team with advanced knowledge, while the ALA line, despite a larger investment, had unstable KPIs and a less developed team.
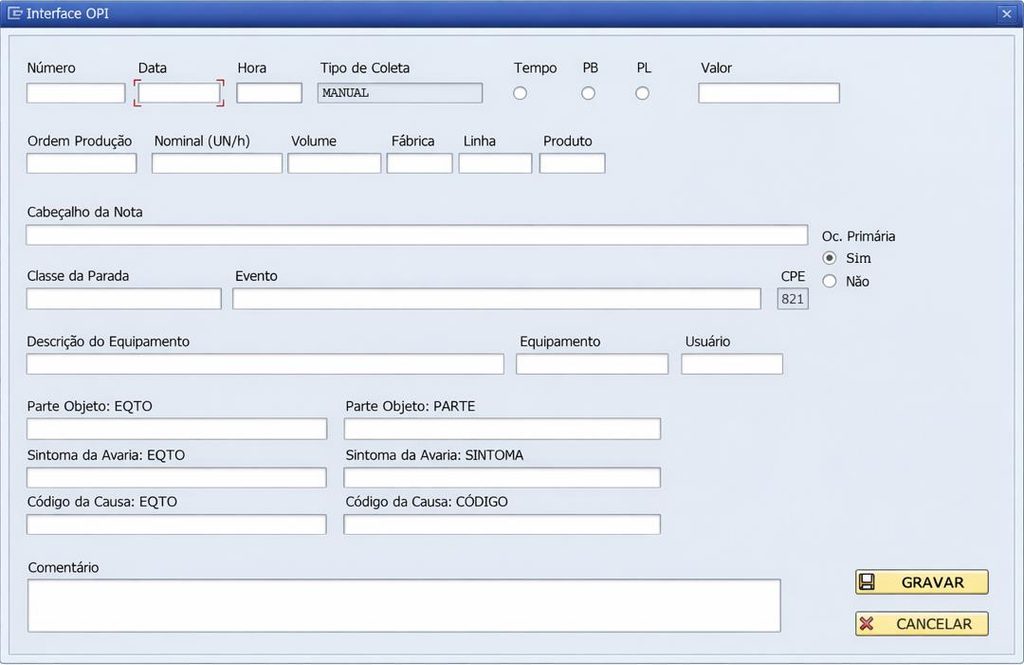
In the objects of study, all notes and orders that generated the database were manual, registered in SAP by the packaging line employees themselves. Adjustments and registrations of unplanned events were carried out in zheipack, as illustrated in Figure 1. After identifying an anomaly, the employee documented the occurrence in the system.
Figure 1. SAP zheipack stop settings and registrations
Source: Original survey data
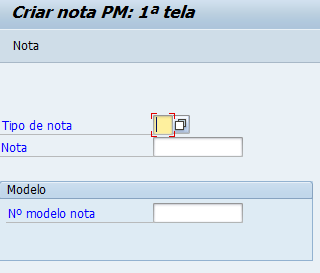
The creation of maintenance orders occurred on the creation of notes screen, as shown in Figure 2, where the employee classified the note according to the type of maintenance and detailed the failure mode.
Figure 2. Maintenance order creation
Source: Original survey data
The study phases comprised: database extraction and treatment; definition and calculation of performance indicators; data modeling and visualization for KPI monitoring; and critical analysis of the effectiveness of maintenance strategies. Data collection occurred in SAP, where production records from the ALA and ALE lines were extracted from zheipack, including downtime records and their respective times, reported whenever an interruption or event occurred in the production process. The analysis period covered the interval between 07/01/25 and 12/31/25.
After extraction, the data wrangling process was performed using Power Query. Empty entries, zero-minute times, net production entries, gross production, and inactive notes were removed to ensure a consistent and reliable database. The extraction of maintenance orders was performed through SAP transaction IW38. In data wrangling, canceled orders and orders of maintenance types other than Time-Based Maintenance [TBM] and Condition-Based Maintenance [CBM] were removed. TBM orders are based on defined time intervals and executed preventively, while CBM orders are performed based on equipment condition, triggered by the need for intervention (NBR 5462). For the integration of databases, the information was merged based on the filling lines and the filtered period, using corresponding dimension tables.
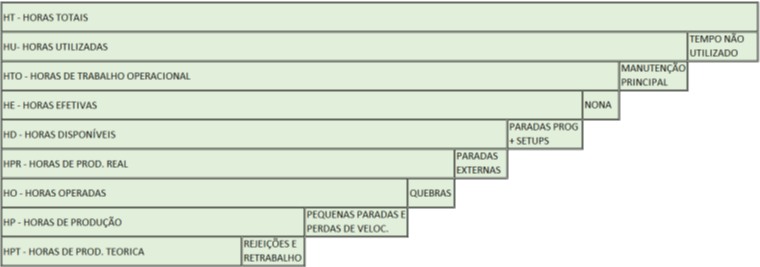
In the performance indicator construction stage, metrics were defined to evaluate the performance evolution of the selected lines. The Key Performance Indicators [KPIs] adopted in this study were defined hierarchically. The main indicator is Line Performance, followed by OPI NONA, which analyze, respectively, the performance of the production line and the impact of unplanned downtimes on operational availability. In a second level of analysis, the maintenance indicators UNPL, BKD, and MTBF were considered, used to evaluate unplanned unavailability and equipment reliability. For the analysis of maintenance order execution, orders classified as Condition-Based Maintenance [CBM] and Time-Based Maintenance [TBM] were considered, covering predictive, preventive, and corrective activities. To ensure focus on maintenance, failure analysis considered only events directly related to filling, disregarding external factors such as logistics and quality. The basic operational efficiency indicators considered are listed in Figure 3.
Figure 3. Basic operational efficiency indicators
Source: Original survey data
Line Performance is calculated by the ratio between the produced time and the expected production time, expressed in eq. (1), with its values ideally approaching 100%.
Line Performance (%) = HPT / HPR x 100 (1)
The OPI NONA represents the ratio between the time the line operated and the available time for operation, disregarding periods lost due to absence of activities, as described in eq. (2).
OPI NONA (%) = HPT / HE x 100 (2)
The UNPL is the period factor in which the line did not produce due to unplanned stops, including breakdowns and minor stops, described in eq. (3).
Unplanned Downtime (%) = HPR-HP / HE x 100 (3)
The Breakdown [BKD] corresponds to the time the line did not produce due to breakdowns, as described in eq. (4), considering events with a duration longer than five minutes.
Breakdown (%) = HPR-HP / HE x 100, if Event = “breakdown” (4)
MTBF represents the mean time between failures, calculated from the ratio between operated hours and the number of breakdowns, as described in eq. (5).
MTBF (h) = HO / ∑ Breakdowns (5)
The data modeling and visualization stage was conducted to structure and analyze the KPIs over the studied period, through the integration of databases, definition of relationships between variables, and construction of visualizations for temporal monitoring and performance comparison between the filling lines. For a critical analysis of maintenance effectiveness, a quantitative approach of a comparative and evolutionary nature was adopted, based on the temporal analysis of KPIs for ALA and ALE, allowing the identification of performance patterns and variations over time, relating them to the types of maintenance applied. The study used a structured method of applied data analysis, based on KPI-driven descriptive and diagnostic analysis, with temporal evaluation of results through historical series, aiming to organize operational data and understand indicator behavior.
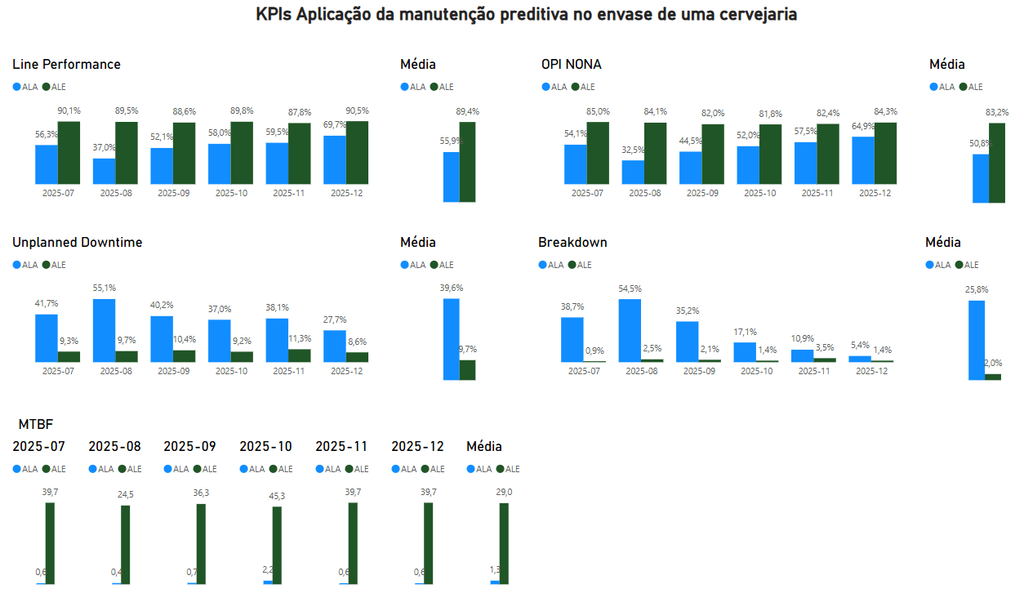
With the objective of consolidating and facilitating the visualization of results, a dashboard was developed in Microsoft Power BI software. The panel was structured to present the analyzed KPIs, including Line Performance, OPI NONA, Unplanned Downtime, Breakdown, MTBF, and execution of MBC and MBT orders, enabling comparative analysis between the ALA and ALE lines over the studied period. The dashboard was developed flexibly, allowing the incorporation of new data over time, which enables its continuous use as an operational monitoring tool. As illustrated in Figure 4, the dashboard presents an overview of the lines’ performance.
Figure 4. Maintenance order creation
Source: Original survey data
3. Results and Discussion
The analysis of performance indicators revealed distinct behaviors between the ALA and ALE filling lines. The ALA line showed greater variability and lower values of Line Performance and OPI NONA throughout the analyzed period, indicating operational instability and loss of production efficiency. In contrast, the ALE line maintained stable and superior performance, suggesting greater process control and operational maturity. The average Line Performance for ALA was 55.9%, while for ALE it was 89.4%. Similarly, ALA’s average OPI NONA was 50.8%, and ALE’s was 83.2%, with a range of 32.4% for ALA, evidencing its oscillations in operational efficiency.
Table 1. Line Performance over time
| Line | Jul/25 | Aug/25 | Sep/25 | Oct/25 | Nov/25 | 12/25 | Average |
|---|---|---|---|---|---|---|---|
| ALA | 56,3% | 37,0% | 52,1% | 58,0% | 59,5% | 69,7% | 55,9% |
| ALE | 90,1% | 89,5% | 88,6% | 89,8% | 87,8% | 90,5% | 89,4% |
Source: Original research results
Table 2. OPI Ninth over time
| Line | Jul/25 | Aug/25 | Sep/25 | Oct/25 | Nov/25 | 12/25 | Average |
|---|---|---|---|---|---|---|---|
| ALA | 54,1% | 32,5% | 44,5% | 52,0% | 57,5% | 64,9% | 50,8% |
| ALE | 85,0% | 84,1% | 82,0% | 81,8% | 82,4% | 84,3% | 83,2% |
Source: Original research results
Regarding Unplanned Downtime (UNPL), the ALE line, with internalized predictive maintenance, registered lower rates of unplanned stops, with an average of 9.7%, reflecting greater equipment reliability and effectiveness in interventions. On the other hand, the ALA line maintained high UNPL values, with an average of 39.6%, indicating recurrence of unplanned events and lower operational reliability. It was observed that part of the improvements in ALA may be related to the reduction of losses due to external factors, such as logistics and quality, and not exclusively to the maintenance strategy.
Table 3. Unplanned Downtime over time
| Line | Jul/25 | Aug/25 | Sep/25 | Oct/25 | Nov/25 | 12/25 | Average |
|---|---|---|---|---|---|---|---|
| ALA | 41,7% | 55,1% | 40,2% | 37,0% | 38,1% | 27,7% | 39,6% |
| ALE | 9,3% | 9,7% | 10,4% | 9,1% | 11,3% | 8,6% | 9,7% |
Source: Original research results
The analysis of the Breakdown (BKD) on the ALA line showed a progressive reduction, with an average of 25.8%, however, this decrease was not proportionally reflected in the UNPL values. This suggests that events classified as breakdowns may have been reclassified as minor stoppages, possibly due to the standardization of concepts and operator training. The ALE line, in turn, maintained low BKD rates, with an average of 2.0%, reinforcing its operational stability. This behavior is consistent with that observed by Fernandes (2024), who highlighted the importance of clarity on the causes of failures to avoid corrective actions.
Table 4. Breakdown over time
| Line | Jul/25 | Aug/25 | Sep/25 | Oct/25 | Nov/25 | 12/25 | Average |
|---|---|---|---|---|---|---|---|
| ALA | 38,7% | 54,5% | 35,2% | 17,1% | 10,9% | 5,4% | 25,8% |
| ALE | 0,9% | 2,5% | 2,1% | 1,4% | 3,5% | 1,4% | 2,0% |
Source: Original research results
The evaluation of equipment with the longest accumulated UNPL time revealed that the ALA line presented significantly higher values in terms of number of events and total UNPL time compared to ALE. In ALA, the ten listed equipment items summed up to 3,766 events and 61,057 minutes of UNPL, with the Filler standing out (675 events and 12,971 minutes). In ALE, the accumulated total was 2,145 events and 16,109 minutes of UNPL, with the Capper concentrating the longest time (3,181 minutes in 265 events). The accumulated UNPL time in ALA was approximately four times greater than in ALE, indicating greater operational instability in ALA, a finding that aligns with Ujam’s (2025) results on unwanted equipment downtime.
Table 5. Top 10 Equipment with the longest accumulated UNPL times in ALA
| Equipment | Events | Total time in minutes |
|---|---|---|
| Filler | 675 | 12.971 |
| Packer | 553 | 9.614 |
| Palletizer | 357 | 7.345 |
| Seaming machine | 316 | 6.583 |
| Filling Machine Transport | 593 | 6.181 |
| Can Turner Transporter | 352 | 4.262 |
| Depalletizer | 219 | 4.072 |
| Pasteurizer Transport | 276 | 3.997 |
| Pasteurizer | 283 | 3.679 |
| Packet Transport | 142 | 2.353 |
| Sum | 3.766 | 61.057 |
Source: Original research results
Table 6. Top 10 Equipment with the longest accumulated UNPL times in ALE
| Equipment | Events | Total time in minutes |
|---|---|---|
| Seaming machine | 265 | 3.181 |
| Rinser Transport | 390 | 2.260 |
| Packer | 140 | 1.933 |
| Filler | 147 | 1.528 |
| Transport Cans Filler | 296 | 1.490 |
| Depalletizer | 192 | 1.367 |
| Palletizer | 118 | 1.184 |
| Rinsing machine | 141 | 729 |
| Transport Cans Bridge | 146 | 713 |
| Sum | 2.145 | 16.109 |
Source: Original research results
The Mean Time Between Failures (MTBF) data corroborated previous analyses, indicating low reliability in ALA, with an average of 1.3 hours (approximately one failure every 1h20min). In contrast, ALE demonstrated greater process robustness, with an average of 29.0 hours, reflecting a lower incidence of failures and greater effectiveness of the maintenance strategy. ALE’s performance surpassed the average benchmark observed in studies such as Caldeiras (2024), which recorded MTBF between 2 and 23 hours.
Table 7. MTBF over time
| Line | Jul/25 | Aug/25 | Sep/25 | Oct/25 | Nov/25 | 12/25 | Average |
|---|---|---|---|---|---|---|---|
| ALA | 0,6 | 0,4 | 0,7 | 2,2 | 5,2 | 15,5 | 1,3 |
| ALE | 39,7 | 24,5 | 36,3 | 45,3 | 16,2 | 37,4 | 29,0 |
Source: Original research results
The analysis of condition-based maintenance (CBM) orders showed that, despite ALA having executed more orders (377), the line presented a high number of pending orders (69 in total, with 64 registered for months after the analyzed period), evidencing a significant backlog and inconsistency in control. In ALE, the number of pending orders was lower (7 in total), suggesting higher quality in order execution. Regarding time-based maintenance (TBM) orders, ALA executed a higher volume (856) compared to ALE (585), and both lines presented a low number of pending orders (5 for ALA and 1 for ALE), indicating good execution of planned activities.
Table 8. MBC orders over time
| Line | State | Jul/25 | Aug/25 | Sep/25 | Oct/25 | Nov/25 | 12/25 | Sum |
|---|---|---|---|---|---|---|---|---|
| ALA | Executed | 13 | 18 | 119 | 85 | 68 | 74 | 377 |
| ALA | Pending | 0 | 5 | 1 | 0 | 1 | 0 | 7 |
| ALE | Executed | 55 | 46 | 44 | 46 | 21 | 45 | 257 |
| ALE | Pending | 2 | 1 | 2 | 4 | 2 | 58 | 69 |
Source: Original research results
Table 9. MBT orders over time
| Line | State | Jul/25 | Aug/25 | Sep/25 | Oct/25 | Nov/25 | 12/25 | Sum |
|---|---|---|---|---|---|---|---|---|
| ALA | Executed | 119 | 155 | 109 | 119 | 113 | 241 | 856 |
| ALA | Pending | 0 | 5 | 0 | 0 | 0 | 0 | 5 |
| ALE | Executed | 72 | 68 | 118 | 159 | 102 | 66 | 585 |
| ALE | Pending | 0 | 0 | 0 | 0 | 0 | 1 | 1 |
Source: Original research results
Predictive maintenance orders revealed differences in maintenance maturity. ALA executed a reduced number of inspections (51), despite high UNPL rates, indicating low utilization of this strategy. In ALE, the quantity of predictive inspections executed was significant (126), even with low UNPL rates, which characterizes a proactive approach and reinforces operational discipline and maintenance strategy maturity.
Table 10. Predictive Inspections Orders over time
| Line | State | Jul/25 | Aug/25 | Sep/25 | Oct/25 | Nov/25 | 12/25 | Sum |
|---|---|---|---|---|---|---|---|---|
| ALA | Executed | 7 | 11 | 11 | 13 | 1 | 8 | 51 |
| ALA | Pending | 0 | 0 | 0 | 0 | 0 | 0 | 0 |
| ALE | Executed | 23 | 14 | 34 | 26 | 20 | 9 | 126 |
| ALE | Pending | 0 | 0 | 0 | 0 | 0 | 0 | 0 |
Source: Original research results
To consolidate and facilitate the visualization of results, a dashboard was developed in Microsoft Power BI, which presents the analyzed KPIs, including Line Performance, OPI NONA, Unplanned Downtime, Breakdown, MTBF, and execution of MBC and MBT orders. This panel allows for comparative analysis between the ALA and ALE lines over the studied period, with flexibility to incorporate new data and identify variations and critical points.
The results indicate that the ALE line presents more efficient operational performance when compared to the ALA line, evidenced by shorter UNPL time, fewer stop events, and greater stability. This performance is associated with the greater maturity of the maintenance process in ALE, characterized by internalized predictive maintenance, fewer pending maintenance orders, and greater preventive action, in addition to a more technically capable team. In contrast, the ALA line presents a higher recurrence of unplanned stops and a greater accumulation of pending orders, factors that contribute to lower operational efficiency.
4. Conclusion
This study aimed to analyze the efficiency of maintenance strategies applied in two can filling lines of a brewing industry, by evaluating Key Performance Indicators. It was found that the line with internalized predictive maintenance (ALE) demonstrated greater operational stability and superior performance in the indicators Line Performance, OPI NONA, Unplanned Downtime, Breakdown, and Mean Time Between Failures (MTBF). It was observed that the ALE line presented a lower incidence of unplanned stops and significantly greater robustness in the process, with an average MTBF of 29.0 hours, in contrast to the line with outsourced corrective, preventive, and predictive maintenance (ALA), which registered greater variability, high failure rates, and an average MTBF of 1.3 hours. The ALE line also showed greater maturity in maintenance management, with less accumulation of pending orders and proactive action in predictive inspections, while the ALA line presented a considerable backlog of condition-based maintenance orders and less use of predictive inspections. The main contribution of the study lies in demonstrating that the adoption of an internalized predictive maintenance strategy positively impacts operational reliability and the filling process performance, in addition to offering a Power BI dashboard as a practical tool for continuous monitoring of these indicators.
However, the study faced limitations related to the absence of information on the operators’ knowledge and training level, which may have influenced the quality and consistency of the manually recorded data. Additionally, the complexity of the process and the lack of variables captured by current indicators made it impossible to create an assertive predictive model for Unplanned Downtime. For future studies, it is suggested to investigate the impact of the professionals’ training and qualification level on equipment quality, as well as to integrate the analysis of human factors with operational data for a more comprehensive understanding of KPI variations.
Bibliographic References
ASSOCIAÇÃO BRASILEIRA DE NORMAS TÉCNICAS. NBR 5462:1994 — Confiabilidade e manutenção. Rio de Janeiro: ABNT, 1994.
BLOOM, N. Reliability Centered Maintenance (RCM): implementation made simple. 1. ed. New York: McGraw-Hill Professional, 2006.
BRASIL. Ministério do Trabalho e Previdência. Portaria MTP n° 4.219, de 20 de dezembro de 2022. Altera a Norma Regulamentadora nº 12 – Segurança no Trabalho em Máquinas e Equipamentos. Diário Oficial da União, Brasília, 22 dez. 2022. Seção 1. (Item 12.111 – manutenção preventiva, inspeção e ajustes).
Caldeiras, R.N. 2024. Otimização da Performance de Rotuladoras Krones em Custos e Produtividade. Monografia em Engenharia Mecânica do Programa de Graduação. Universidade Federal do Maranhão, São Luís, MA, Brasil.
Fernandes, I.S. 2024. O PDCA Aplicado em uma Linha de Envase de uma Indústria para Redução da Quebra de Garrafas. Monografia em Engenharia de Produção do Programa de Graduação. Universidade Federal de Ouro Preto, Ouro Preto, MG, Brasil.
Júnior, E.C. 2019. Sistema de manutenção: proposta de um modelo para empresa que não possua sistema integrado de manutenção. 1. Ed. Piracanjuba: Editora Conhecimento Livre, 2019.
Mendes, A.L.S. 2002. Gestão do Valor nas Operações de Manutenção. Dissertação em Engenharia de Produção do Programa de Mestrado. Universidade Federal de Santa Catarina, Florianópolis, SC, Brasil.
Ministério da Agricultura e Pecuária [MAPA]. 2025. Anuário da Cerveja 2025. Disponível em: . Acesso em: 21 ago. 2025
Oke, A.O.; Abafi, J.A.; Adewole, B.J. 2021. Failure data analysis for preventive maintenance scheduling of a bottling company production system. Journal of Industrial Engineering and Management Studies 8(1):32-44.
Ujam, C.J. 2025. An Analysis of Operations Management Practices in Packaging Industries to Enhance Production Performance: A Case Study/ international Journal of Multidisciplinary Research and Growth Evaluation 06(2):1112-1124.
Article originating from the Course Conclusion Work of the Specialization in Data Science and Analytics of the MBA USP/Esalq
To learn more about the course, click here and access the MBX Academy platform