
September 15, 2026
Predictive Analysis and Data Modeling of Domestic Violence Against Women in Curitiba: a Perspective by Territorial Units
Katleen Grani de Souza; Charles Gomes da Silva
DOI: 10.22167/2675-6528-202602250
Article derived from a Final Course Work (TCC), with content based on the student’s original work and adapted to the editorial format of the Revista E&S with the support of the ResumeAI tool, an artificial intelligence solution developed by the Pecege Institute for textual synthesis and organization.
Summary
Domestic violence against women represents a critical challenge for public safety policies, demanding methodologies that transcend traditional descriptive statistical analysis. The study aimed to analyze the geographic profile and the statistics of domestic violence occurrences against women in the municipality of Curitiba, using “Data Science” techniques and time series modeling to identify predictability patterns in the city’s main “hotspots”. The methodology consisted of processing data from the SIGESGUARDA system (2020-2026), focusing on correcting operational anomalies and applying the ARIMA (Autoregressive Integrated Moving Average) model. The results revealed distinct territorial dynamics: while the municipal average showed an autoregressive behavior of order 1 (stability with statistical memory), neighborhoods such as Cidade Industrial de Curitiba (CIC) and the Center exhibited patterns of persistence and sensitivity to shocks, respectively. In contrast, locations like Sítio Cercado and Tatuquara showed stochastic behaviors (white noise), indicating less temporal dependence. It was concluded that the application of predictive models allows the transition from reactive policing to evidence-based management, enabling the creation of a differentiated intervention matrix for each neighborhood profile, optimizing the deployment of the Maria da Penha Patrol and municipal resources.
Keywords: Data Science; Municipal Guard; ARIMA Model; Public Safety; Time Series.
1. Introduction
Violence is a social phenomenon of global reach, present in various layers and contexts of society. Its manifestation constitutes a serious violation of human rights, directly impacting the life, health, and physical and psychological integrity of individuals (Hayeck, 2015; Boris et al., 2011). In addition to its individual consequences, violence is recognized as a serious public health problem, as highlighted by the World Health Organization (WHO, 2010).
Among the multiple forms of violence, that directed at women, frequently termed gender-based violence, emerges as a central concern. Such acts are based on gender difference, resulting in psychological, physical, moral, property, and sexual damages (Franzoi et al., 2011). In this scenario, women are victims of aggression simply for being women (Saliba et al., 2007; Special Secretariat for Women’s Policies, 2008).
In the Brazilian context, domestic violence against women represents one of the most serious human rights violations. Its confrontation and prevention are regulated by important legal frameworks, such as the Maria da Penha Law (Law nº 11.340/2006), which seeks to curb and punish domestic and family violence. The state of Paraná, and specifically its capital, Curitiba, are frequently cited as regions with a high number of occurrences of violence against women. The magnitude of the problem in Curitiba is evidenced by the flow of services provided by the Maria da Penha Patrol and by the records of the Municipal Guard Management System (SIGES GUARDA).
Despite an observed decrease of 15.29% in cases of domestic violence against women in the first months of 2025, compared to the previous period (Curitiba, 2025), the need for continuous protection and effective strategies remains. Previous studies, such as Bichibichi (2018), which analyzed the period between 2014 and 2018 in Curitiba, already indicated the predominance of psychological and physical violence, with a high incidence of threats. Furthermore, a concentration of occurrences was identified after 6 PM and on weekends, with the aggressors being, for the most part, partners or ex-partners.
However, for public interventions to be truly effective, it is imperative that they be based on accurate, up-to-date data that reflect the local dynamics of the phenomenon. The SIGES GUARDA System, maintained by the Municipal Government of Curitiba, offers valuable information on the care of women victims of violence. Nevertheless, traditional descriptive statistical analysis, while fundamental, is often insufficient to identify predictive patterns and complex correlations, which limits the capacity for anticipation and strategic planning.
There is a gap in the application of predictive methods that consider the temporality of domestic violence occurrences (Hayeck, 2015). Efficiency in combating crime depends on the transformation of statistical data into strategic intelligence (Bichibichi, 2018). In this sense, the present study seeks to go beyond merely descriptive analyses, using advanced Data Science tools to identify hidden patterns and correlations between occurrences registered in SIGES GUARDA and geographical variables of the municipality.
The relevance of this work lies in the possibility of optimizing the resources of the Municipal Guard and the protection network, allowing a transition from reactive policing to evidence-based management. The application of Machine Learning algorithms and ARIMA models is justified by the ability to identify stochastic behaviors and trends that simple historical analyses do not capture (Hyndman and Athanasopoulos, 2018). That said, the present work aimed to analyze the geographic profile and the statistics of domestic violence occurrences against women in the municipality of Curitiba, using Data Science techniques and time series modeling to identify predictability patterns in the city’s main “hotspots”.
2. Material and Methods
The research adopts an exploratory quantitative approach. The “Data Wrangling” process used the Pandas library for data treatment, as per McKinney (2018). For modeling, the ARIMA (Autoregressive Integrated Moving Average) method was employed, based on the concepts of Box et al. (2015). The series was subjected to stationarity tests, and the selection of the optimal model was based on the Akaike Information Criterion [AIC], which, according to Hyndman and Athanasopoulos (2021), balances model fit with parsimony to avoid “overfitting”.
The database was composed of public information from the Municipal Government of Curitiba, extracted from the Municipal Guard Management System SIGESGUARDA. The data refers to records of occurrences attended by the Municipal Guard in the period from March 2020 to March 2026, coinciding with the implementation of the “Domestic violence against women” subcategory in the system.
The data collection process involved applying sequential filters to the raw database of municipal occurrences to reduce the volume of records to the scope of interest. The filters applied were:
- Nature Filter: Exclusive selection of the domestic violence against women subcategory.
- Geographic Filter: Limitation to confirmed occurrences within the urban perimeter of Curitiba, segregated by neighborhoods.
- Temporal Filter: Data cutoff from the 2020 systemic standardization.
This filtering resulted in a qualified time series of 3,250 occurrences. Each record in the database contained information such as the nature of the occurrence, date/time of the event, and the incidence neighborhood, allowing for monthly grouping for time series analysis.
The final preparation of the dataset used “Data Wrangling” techniques in a “Python” environment, with the Pandas library (MCKINNEY, 2018). The steps included importing 73 periodic files, standardizing characters, date formats, and neighborhood names, cleaning duplicate records, and correcting anomalies detected in 2023 and 2024. Reusable code was developed to automate quantitative grouping by temporality segmented by neighborhood. The final database presents, on a monthly basis, the volume of occurrences as the target variable for statistical trend modeling via the ARIMA method.
The consolidated and used variables for the analysis are presented in Table 1.
Table 1. List of variables available for predictive and territorial analysis.
| Variable | Description |
|---|---|
| Date of Occurrence | Exact date and time of the call registration in the system. |
| Neighborhood | Territorial unit of Curitiba where the occurrence was attended. |
| Nature of Occurrence | Specific subcategory (Domestic Violence against Women). |
| Day of the Week | Temporal derivation for incidence peak analysis (Monday to Sunday). |
| Day Shift | Hourly classification (Morning, Afternoon, Evening and Night). |
| Monthly Volume | Aggregate record count for ARIMA modeling purposes. |
With the processed data, Exploratory Data Analysis [EDA] was performed to understand the database structure, identify territorial “hotspots”, and detect temporal anomalies. The process was conducted in “Python”, using the “Spyder” development environment (integrated into the Anaconda package). For the execution of the analyses and construction of the visualizations, the following libraries were used:
- pandas: for temporal manipulation, grouping, and indexing of data.
- matplotlib.pyplot and seaborn: for building and aesthetic customization of graphs.
- numpy: for support of mathematical operations and matrix handling.
- statsmodels: for applying statistical tests of stationarity and ARIMA model decomposition.
Time series analysis comprises the study of quantitative observations ordered chronologically, at successive and regular intervals (SOUZA; CAMARGO, 2004). Time series exhibit serial dependence, where the volume of domestic violence records in a given month (X₁) is influenced by previous periods (X{t-1}, X{t-2}, …). This structure is mathematically represented by eq. (1):
Xt={X1,X2,…,Xn}, with 1≤t≤n (1)
where: X is a given month, t represents the temporal index, and n the total horizon of observations.
The central objective is to decode historical patterns to infer future values (RELVAS, 1998). According to Morettin and Toloi (2006), a time series can be decomposed into four fundamental components, detailed in Table 2.
Table 2. Description of time series components applied to the criminal context
| Component | Description |
|---|---|
| Trend (T₁) | Reflects the long-term direction of violence (growth, decline, or stability). |
| Seasonality (St) | Fluctuations that repeat in fixed periods (e.g., holidays or times of the year). |
| Cycle (Ct) | Long-term oscillations linked to external factors (e.g., changes in public policies). |
| Error/Residual (Et) | Random and unpredictable variations that do not follow a systematic pattern. |
The combination of these components can be additive, as in eq. (2), or multiplicative, as in eq. (3). The additive model is suitable when the amplitude of seasonal variations is constant, while the multiplicative one is preferred when fluctuations increase proportionally to the average of the data (RELVAS, 1998).
X=T+S+C++Et (2)
X=T*S*C*Et (3)
where: T represents Trend, S Seasonality, C Cycle, and E Error/Residual.
Predictive methodologies such as Exponential Smoothing and Box-Jenkins (ARIMA/SARIMA) were evaluated. The ARIMA model was chosen, without the seasonal extension (SARIMA), due to the principle of parsimony and the absence of deterministic seasonal patterns with fixed periodicity in the analyzed “hotspots”, prioritizing the identification of the autoregressive memory of the phenomenon (SOUZA; CAMARGO, 2004).
Simple Exponential Smoothing (SES) is a short-term forecasting method that assigns decreasing weights to past observations (SOUZA; CAMARGO, 2004). Mathematically, the model is defined by eq. (4):
X t+1 = αΧ t + (1 − α)Χ t’ (4)
where: α is the smoothing constant 0 < α < 1, Xo is the observed value in the current period and X₁, is the forecast made previously. This model was not selected due to its inertia regarding the trend and the superiority of the ARIMA model in integrating the effect of previous lags and differencing to stabilize the series variance.
The ARIMA(p, d, q) model was selected for its ability to handle time series that do not exhibit deterministic seasonality but possess short-term dependence. The general equation of the model is expressed by eq. (5):
yt’=c+$1yt-1’+…+ppyt-p’+81et−1+…+8qet-q+et (5)
where: yť’ is the differenced series to ensure stationarity; c is a constant; φ represents the autoregressive coefficients; θ represents the moving average coefficients; and et represents the random error or white noise. The model decomposes the series into three fundamental components: Autoregressive (p), Integrated (d), and Moving Average (q). The selection of parameters (p, d, q) was automated using the Stepwise Search algorithm from the pmdarima library, utilizing the Akaike Information Criterion [AIC] to seek the best fit with the lowest complexity.
3. Results and Discussion
Before applying the predictive models, an exploratory data analysis (EDA) was performed to identify the behavior of domestic violence in Curitiba from the perspective of weekly and daily periodicity. This step is fundamental, as urban crime is not uniformly distributed over time, presenting concentration cycles that reflect the city’s social routine (Silva and Santos, 2020).
Distribution by Day of the Week
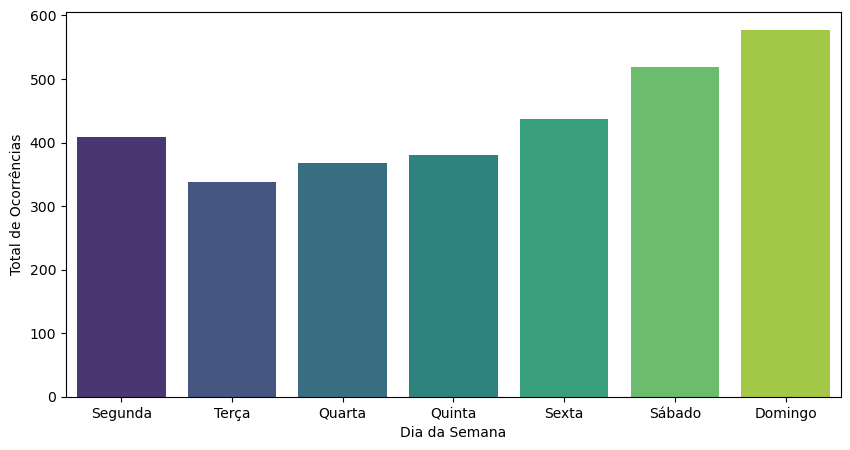
The analysis of incidence by day of the week revealed that domestic violence in Curitiba shows a significant increase during periods of work leave, with sharp peaks on Saturdays and Sundays. This pattern corroborates public safety literature, indicating that the increased time spent together by aggressor and victim, often combined with substance abuse, acts as a catalyst for conflicts. For the management of the Municipal Guard, this data is crucial for the scaling of the Maria da Penha Patrol, suggesting that the reinforcement of personnel should be prioritized on these days.
Figure 1. Domestic Violence Incidence by Day of the Week
Source: Original research results
Day Shift Concentration
Regarding the hourly distribution, the data indicated a predominant concentration in the night and early morning shifts. While the daytime period shows a distributed frequency of occurrences, the early evening marks an increase. This behavior suggests that nighttime invisibility and the return to the domestic environment after the workday influence the volume of records. This seasonality reinforces the need for rapid response strategies and efficient public lighting in the identified “hotspots”, as time is a critical factor in assisting victims.
Figure 2. Domestic Violence Incidence by Day of the Week
Source: Original research results
Temporal Evolution of Occurrences (2020-2026)
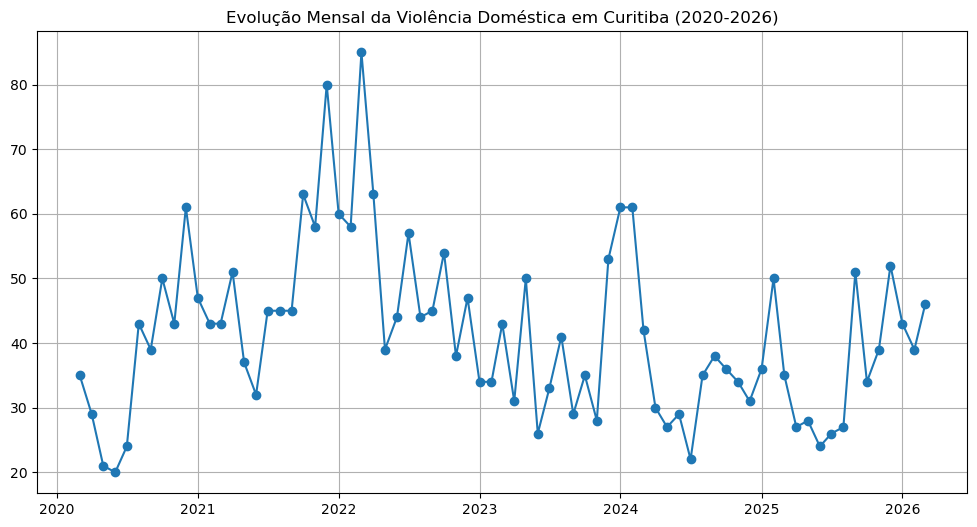
The analysis of the consolidated time series, illustrated in Figure 3, shows the monthly behavior of domestic violence occurrences in Curitiba over 73 months, starting from March 2020. After an initial period of instability, domestic violence tended towards a plateau of equilibrium. The ARIMA(1,0,0) model revealed a “short-term memory” in the municipal series, indicating that the volume of cases from the previous month influences the current one. The 12-month projection points to a maintenance of the average around 41 cases/month, suggesting that current policies contain the advance, but do not generate a sustained decrease.
Visually, the series does not exhibit strict deterministic seasonality, but fluctuates around a medium level, with isolated peaks that may be influenced by external events or variations in notification density. From 2024 onwards, greater stability in data collection was observed. Statistically, the series demonstrates stationarity characteristics after the initial period, a prerequisite for autoregressive models. The absence of an abrupt upward or downward trend suggests that domestic violence is a structural and persistent problem. This “floating stability” justifies the application of the ARIMA model to identify serial dependence and use the data as a tool for operational anticipation.
Figure 3. Monthly evolution of domestic violence occurrences in Curitiba (Mar/2020 – Mar/2026)
Source: Original research results
Predictive Modeling and Projections for the Municipality of Curitiba
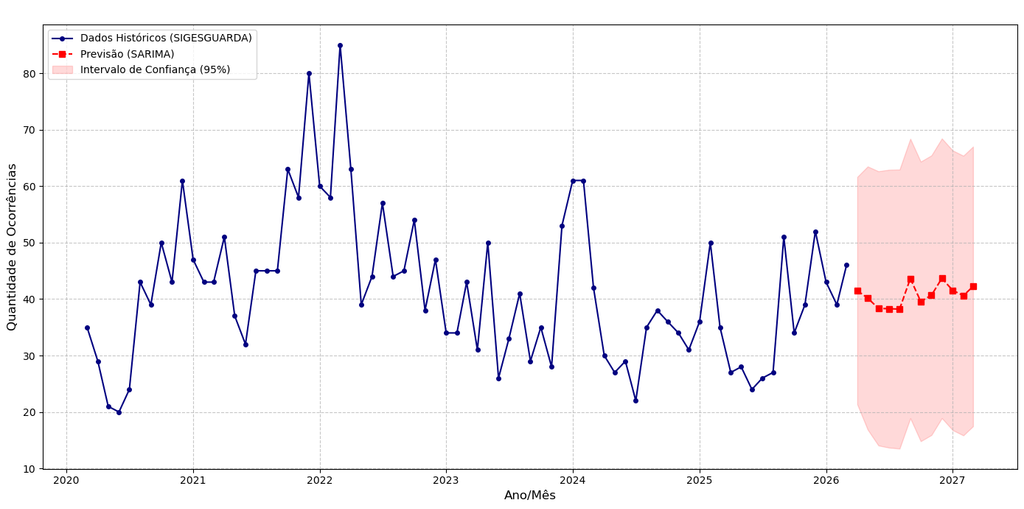
Based on historical patterns and the Box-Jenkins methodology, the official projection for the municipality was generated. The ARIMA (p, d, q) model was adjusted to capture the statistical memory of the historical series started in 2020. Figure 4 illustrates the curve of domestic violence occurrences in Curitiba, integrating historical data and predictive projections for a 12-month horizon.
Figure 4. Predictive Model: Domestic Violence Occurrences in Curitiba and Projection for the 12-month horizon
Source: Original research results
Analysis of Projections and Confidence Intervals
Figure 4 projects a trend of stability, slight growth, or decline for the next year. The Confidence Interval (shaded area), with 95% probability, is crucial for public safety management. Maintaining the projection within controlled limits suggests that the phenomenon, although persistent, has a structural behavior that allows for medium-term planning. The central forecast line serves as a “target” for public policies: occurrences above the projection may indicate an outbreak or improvement in reporting channels; below, success of preventive policies and protective measures.
The ARIMA model’s ability to fit recent data demonstrates that Curitiba’s security system has a temporal inertia, where today’s crime volume is a predictor of future volume. This validates the importance of continuous monitoring, rather than one-off actions.
Residual Diagnostics and Model Validation
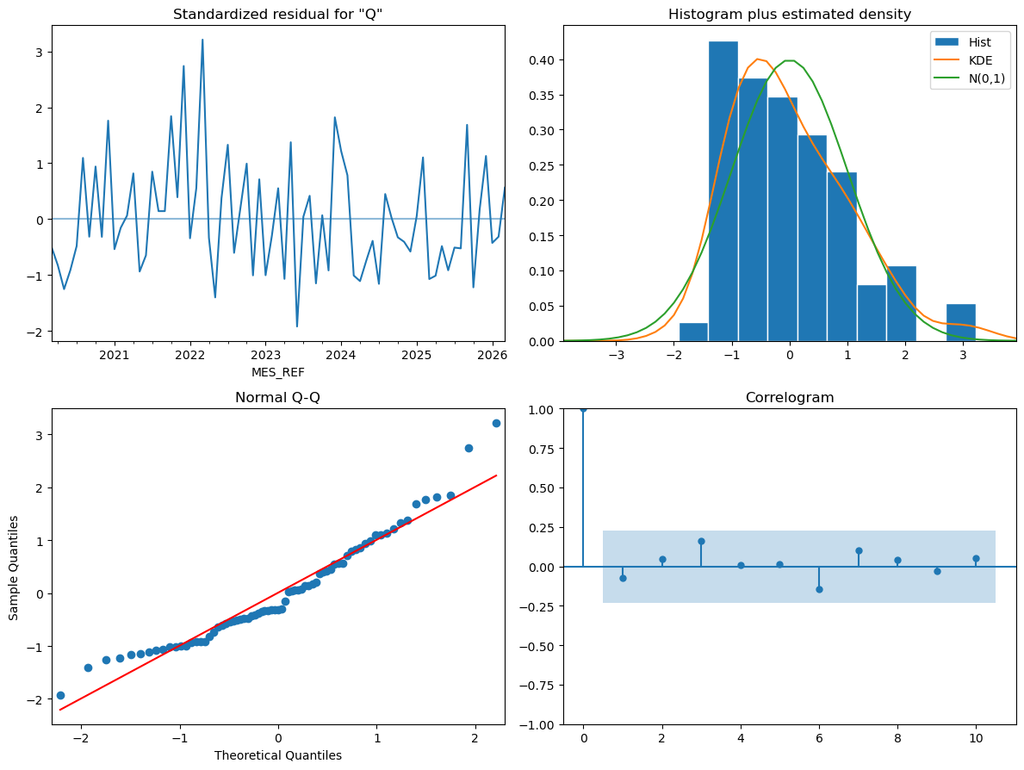
To ensure the statistical validity of the projections, the diagnosis of ARIMA model residuals was performed, according to Figure 5. The objective was to verify if the model captured the systematic structure of the data, leaving only “white noise” as residual. The interpretation of the four quadrants of Figure 5 validates the effectiveness of the modeling:
The standardized residuals fluctuated around zero, with no visible patterns, indicating the absence of remaining uncaptured trends. The residual density curve approximated the normal distribution curve, an indicator of statistical robustness. The points on the Normal Q-Q plot aligned along the diagonal line, reinforcing that the model’s errors follow a normal distribution. Finally, the Correlogram (ACF) showed that none of the lags exceeded the significance area, confirming the absence of autocorrelation in the residuals.
In summary, the diagnosis confirmed that the ARIMA model is properly adjusted, ensuring that the forecasts for the 2026 horizon are based on the real statistical memory of domestic violence in Curitiba, providing technical security for the decision-making of the Municipal Guard.
Figure 5: ARIMA Model Diagnosis – Occurrences in Curitiba
Source: Original research results
Identification and Prioritization of “Hotspots”
Although the municipality presents general stability, the disaggregated analysis by neighborhoods revealed critical disparities, according to Table 3.
Table 3. Comparative of the “TOP 5” Neighborhoods
| ATENDIMENTO_BAIRRO_NOME | OCCURRENCES |
|---|---|
| INDUSTRIAL CITY | 299 |
| FENCED SITE | 270 |
| TATUQUARA | 221 |
| CAJURU | 176 |
| CENTER | 158 |
Source: Original research results
The Industrial City (CIC) presented the highest criticality, with 299 cases, and a persistent autoregressive model, suggesting the need for constant preventive policing. Sítio Cercado and Tatuquara were identified as White Noise (ARIMA 0,0,0), characterizing crime as stochastic and requiring readiness for rapid response. Cajuru demonstrated statistical resilience, with the model predicting a return to the historical average of 2.41 cases, despite recent peaks. The Center exhibited the most complex model (ARIMA 1,0,1), being sensitive to “shocks” and rapid changes in urban flow.
Comparative Analysis of Predictability Dynamics by “Hotspot”
The decomposition of the municipal time series by territorial units revealed that the dynamics of domestic violence in Curitiba are not uniform, presenting significant variations in volume and statistical predictability. Table 4 summarizes the projections for the five main “hotspots” identified between 2020 and 2026.
Table 4. Forecast Comparison by Neighborhoods
| Neighborhood (Hotspot) | Total History | Last Recorded Month | Forecasted Average (Next 12 months) | Statistical Model |
|---|---|---|---|---|
| INDUSTRIAL CITY | 299 | 5 | 4.11 | ARIMA(1, 0, 0) |
| FENCED SITE | 270 | 2 | 3.70 | ARIMA(0, 0, 0) |
| TATUQUARA | 221 | 4 | 3.03 | ARIMA(0, 0, 0) |
| CAJURU | 176 | 8 | 2.41 | ARIMA(0, 0, 0) |
| CENTER | 158 | 2 | 2.16 | ARIMA(1, 0, 1) |
Source: Original research results
The Curitiba Industrial City (CIC) remained the region with the highest accumulated criticality, with 299 records. The ARIMA(1,0,0) model indicates an autoregressive component, suggesting that occurrences in the CIC have a short-term “memory”, with the volume of cases in one month influencing the subsequent one. With a predicted average of 4.13 monthly occurrences, the neighborhood demands continuous preventive patrolling, given the persistence of the phenomenon.
In contrast, the Sítio Cercado, Tatuquara, and Cajuru neighborhoods presented the ARIMA(0,0,0) model, characterizing the phenomenon as “white noise” around a fixed mean. In these locations, occurrences are stochastic events, with no clear temporal dependence, which implies that the effectiveness of policing depends more on rapid response to sudden events.
The Center, in turn, presented the most complex modeling (ARIMA(1,0,1)), indicating influence from both historical persistence and short-term random shocks. This complexity can be attributed to the multifaceted nature of the central region, with fluctuating population flows, requiring public policies that integrate territorial monitoring and social assistance.
It is important to note that historical volume does not always dictate future trends. While the CIC maintains a stable forecast, Cajuru, which had a recent peak of 8 occurrences, projects a return to the average of 2.41. This demonstrates the importance of using Data Science to avoid immediate reactions to isolated peaks.
In summary, the exploratory analysis results indicated that domestic violence in Curitiba is predominantly concentrated on weekends, as well as during night and early morning shifts. Predictive modeling with ARIMA(1,0,0) for the municipality revealed a “short-term memory” and a trend of stability in occurrences, with a projection of 41 cases/month for the next 12 months. The residual diagnosis validated the model’s robustness. Disaggregated analysis by “hotspots” demonstrated varied dynamics: while neighborhoods like Cidade Industrial exhibit persistent autoregressive patterns, others like Sítio Cercado, Tatuquara, and Cajuru show stochastic behaviors, requiring rapid responses. The city center presented a more complex model, influenced by historical persistence and random shocks. This differentiation underscores the importance of public safety strategies adapted to each territorial profile, using Data Science for proactive and evidence-based planning.
4. Conclusion
This study sought to analyze the geographic profile and the statistics of domestic violence occurrences against women in the municipality of Curitiba, employing Data Science techniques and time series modeling to identify predictability patterns in the city’s main “hotspots”. It was found that domestic violence in Curitiba is predominantly concentrated on weekends, as well as during the night and early morning shifts, indicating a seasonality influenced by cohabitation time and nocturnal invisibility. Predictive modeling, using the ARIMA(1,0,0) model for the municipal historical series, revealed a “short-term memory”, suggesting that the volume of cases from the previous month influences the current one, and projected a stability of around 41 monthly occurrences for the next 12 months. This stability, validated by a robust diagnosis of the model’s residuals, indicates that current policies contain the advance, but do not promote a sustained decrease.
The disaggregated analysis by neighborhoods demonstrated distinct territorial dynamics, evidencing that domestic violence is not uniformly distributed. Neighborhoods like Cidade Industrial de Curitiba (CIC) exhibited persistent autoregressive patterns, demanding continuous preventive policing. In contrast, localities such as Sítio Cercado, Tatuquara, and Cajuru presented stochastic behaviors, characterized as “white noise,” which requires readiness for rapid responses to sudden events. The Center, in turn, manifested a more complex model, influenced by both historical persistence and short-term random shocks, requiring public policies that integrate territorial monitoring and social assistance. The main contribution of this work lies in the transition from reactive policing to evidence-based management, enabling the creation of a differentiated intervention matrix for each neighborhood profile, optimizing the deployment of the Maria da Penha Patrol and municipal resources. However, the study was limited to the variables recorded in the security system. It is suggested for future research to integrate external socioeconomic variables, such as the Human Development Index (HDI) by neighborhood, unemployment rates, and population density, through more complex Machine Learning algorithms, in order to investigate the underlying causes of the identified patterns.
Bibliographic References
BICHIBICHI, E. D. 2018. Segurança pública e análise criminal: a importância das estatísticas no combate à violência. Monografia (Especialização em Gestão Pública). Universidade Federal do Paraná, Curitiba, PR, Brasil.
BORIS, G. D. J. B.; MOREIRA, V.; VENÂNCIO, N. 2011. O estigma da violência sofrida por mulheres na relação com seus parceiros íntimos. Psicologia & Sociedade 23(2): 398-406.
BOX, G. E. P.; JENKINS, G. M.; REINSEL, G. C.; LUNG, G. M. 2015. Time series analysis: forecasting and control. 5. ed. John Wiley & Sons, Hoboken, NJ, USA.
CURITIBA. 2026. Prefeitura Municipal. Dados Abertos: Siguesguarda – Sistema de Gestão da Guarda Municipal. Disponível em: https://www.curitiba.pr.gov.br/dadosabertos/. Acesso em: 15 abr. 2026.
FRANZOI, N. M.; FONSECA, R. M. G. S.; GUEDES, R. N. 2011. Violência de gênero: Concepções de profissionais das equipes de saúde da família. Revista de Saúde Pública 45(1): 1-10.
HAYECK, M. G. 2015. Análise espacial da violência doméstica contra a mulher em Curitiba. Dissertação (Mestrado em Gestão Urbana). Pontifícia Universidade Católica do Paraná, Curitiba, PR, Brasil.
HYNDMAN, R. J.; ATHANASOPOULOS, G. 2021. Forecasting: principles and practice. 3. ed. OTexts, Melbourne, VIC, Austrália. Disponível em: https://otexts.com/fpp3/. Acesso em: 10 abr. 2026.
MCKINNEY, W. 2018. Python para análise de dados: tratamento de dados com pandas, numpy e ipython. Tradução de Lúcia A. Kinoshita. Novatec, São Paulo, SP, Brasil.
MORETTIN, P. A.; TOLOI, D. A. C. 2006. Análise de séries temporais. 2. ed. Edgard Blücher, São Paulo, SP, Brasil.
ORGANIZAÇÃO MUNDIAL DA SAÚDE [OMS]. 2002. Relatório mundial sobre violência e saúde. OMS, Genebra, Suíça.
SALIBA, O.; GARBIN, C. A. S.; GARBIN, A. J. I.; DOSSI, A. P. 2007. Responsabilidade do profissional de saúde sobre a notificação de casos de violência doméstica. Revista de Saúde Pública 41(3): 472-477.
Secretaria Especial de Políticas para as Mulheres, 2008 [Referência completa não encontrada no documento original]
SILVA, L. M.; SANTOS, R. J. 2020. Ciência de dados aplicada à segurança pública: uma revisão sistemática. Revista Brasileira de Segurança Pública 14(1): 120-138.
Article originating from the Course Conclusion Work of the Specialization in Data Science and Analytics of the MBA USP/Esalq
To learn more about the course, click here and access the MBX Academy platform