
September 15, 2026
Statistical Analysis of Soil Fertility in Coffee Areas Using Data Science Tools
Gustavo Bonacina Zanguettin; Lauro Marques Vicari
DOI: 10.22167/2675-6528-202602225
Article derived from a Final Course Work (TCC), with content based on the student’s original work and adapted to the editorial format of the Revista E&S with the support of the ResumeAI tool, an artificial intelligence solution developed by the Pecege Institute for textual synthesis and organization.
Summary
A study analyzed the relationship between the chemical elements of the soil in a coffee cultivation area, seeking to understand the interaction between nutrients and their influence on data variability. For this purpose, statistical tools and exploratory analyses were used, including descriptive graphs, simple linear regression, and assumption tests, with software support. The results showed distinct behaviors among the evaluated nutrients. The relationship between calcium and magnesium showed a higher explanatory capacity, indicating a relevant association between these elements. Interactions such as phosphorus and potassium, and potassium and calcium, showed low correlation, suggesting the absence of a significant linear relationship. In some cases, violations of the model’s assumptions were identified, requiring data transformations to improve the fit. It was concluded that the dynamics of soil nutrients are complex and influenced by several factors, making it impossible to generalize relationships between all elements. This reinforced the importance of individualized soil fertility management, based on specific analyses, for greater efficiency in input use and better performance of agricultural crops.
Keywords: Statistical analysis; Soil fertility; Soil nutrients; Linear regression; Box-Cox transformation.
1. Introduction
Soil represents a primary resource in guaranteeing global food security, with its knowledge being fundamental, through the determination of its quantitative characteristics. These characteristics are modified by various agricultural activities and management practices, varying in time and space (Souza et al., 2021). One of the main aspects for agricultural sustainability is the knowledge of soil fertility, as well as its limitations, aiming for rational system manipulation. This understanding, which seeks to avoid imbalances, relies on soil chemical analysis as an essential activity (Krohling et al., 2014).
Nutrition significantly impacts the development and productivity of agricultural crops, influencing growth, stress tolerance, and overall plant health. Balancing the availability of demanded nutrients through adequate fertilization and soil management is fundamental to maximizing production yield and quality (Mancuso et al., 2020).
Precision agriculture (PA) has been expanding and consolidating in agribusiness, with the objective of valuing production chains and offering the best products, in addition to preserving natural resources through advanced technologies (Medina, 2023). PA has been constantly developing with the incorporation of sensors and embedded technologies in machinery, which has contributed to expanding its competitiveness and adoption (Bazzi et al., 2015).
PA is an agricultural practice that uses information technology, based on the principle of spatial and temporal variability. Furthermore, it aims at the detailed management of the agricultural production system as a whole (Miranda, 2006). The expansion of rural connectivity and accessible digital solutions, such as mobile applications and data-based recommendation systems, has democratized PA, offering personalized agronomic information to small producers (FAO, 2022; PNUD, 2021).
Spatial variability is a characteristic present in agricultural areas, and its detailed knowledge is of great importance for planning crop management. With this, differentiated soil treatment is sought in each portion of the land, applying what is necessary at the correct time and in the required quantities (Matiello et al., 2015). Knowledge of the variation ranges, through the collection of georeferenced data, allows the creation of maps to analyze each soil attribute (Inamasu et al., 2014).
In coffee farming, a crop of great economic and social relevance for Brazil, adequate soil management is fundamental due to the crop’s high sensitivity to nutrient availability and balance (Hernández et al., 2015). The estimated coffee production for 2025 is 55.67 million 60 kg bags, representing a 2.7% increase compared to the previous year (CONAB, 2025). The crop occupies about 2.25 million hectares, involving approximately 287 thousand producers in fifteen states, highlighting its importance for rural development (MAPA, 2018).
The analysis of soil attribute variability can indicate management alternatives for reducing its effects on crop production (Zonta et al., 2014). Understanding spatial and temporal variability increases knowledge about production systems to enhance productivity and quality, in addition to conserving resources and reducing environmental impacts (Bernardi et al., 2017). The main objective of using this system is to increase productivity and save on agricultural inputs, prioritizing environmental protection (Bernardi et al., 2014).
However, the dynamics of soil nutrients are complex and influenced by several factors, which makes it difficult to generalize the relationships between all elements. This complexity reinforces the importance of individualized soil fertility management, based on specific analyses to contribute to greater efficiency in the use of inputs and better performance of agricultural crops. In this context, the present study aimed to analyze the relationship between soil chemical elements in a coffee cultivation area, seeking to understand the interaction between nutrients and their influence on data variability.
2. Material and Methods
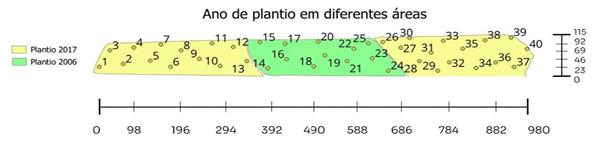
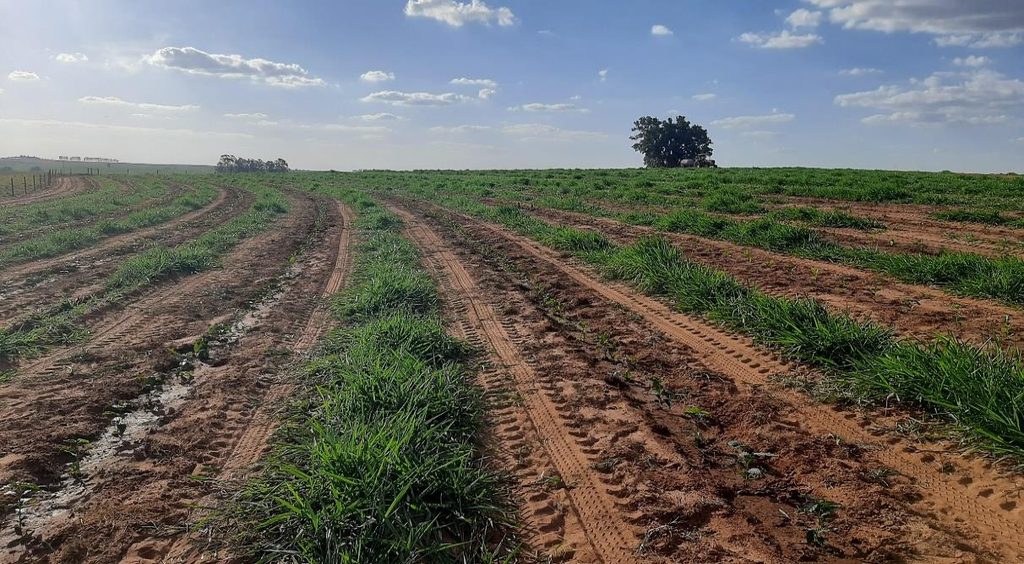
The research was conducted in the city of Pompéia, in the interior of the state of São Paulo (Latitude -22.0305° and -50.1171° longitude), in a plot with a total area of 9.742 hectares. This area is intended for the cultivation of arabica coffee, Obatã variety. For the cultivation of this variety, the ideal environment is characterized by mild temperatures (18 to 22 °C) and altitudes above 1,000 m (Alves, 2024). A sample area of the plot was chosen, characterized by plants of different planting ages, introduced in 2006 and 2017 (Figure 1). The plants have a spacing of 3.50 meters between rows and 0.65 meters between plants (Figure 2).
Figure 1: Planting age in the sample area in a coffee production area in the Pompeia region, state of São Paulo, Brazil.
Source: Original survey data
Figure 2: Spacing in a coffee production area in the Pompeia region, São Paulo state, Brazil.
Source: Original survey data
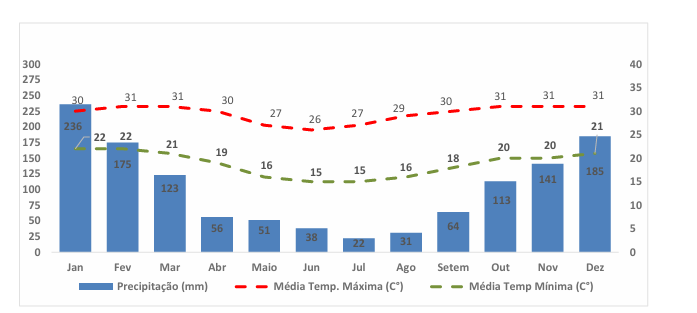
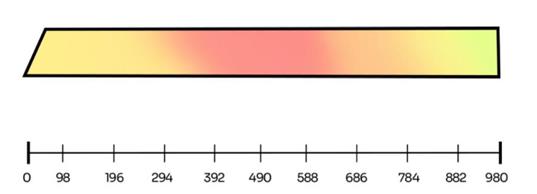
The region’s climate, according to the Koppen classification, is categorized as Cfa (Humid Subtropical Climate), with average temperatures varying throughout the year between 15° C and 31° C (Figure 3). The soil is classified as Eutrophic Red-Yellow Argissol (Brazilian Agricultural Research Corporation [EMBRAPA], 2018). The altitude of the sample area has a variation of 29 meters between its topographic extremes, with the highest point at 495 meters and the lowest at 466 meters above sea level (Figure 4).
Figure 3: Climatic conditions in the year 2021 in Pompeia, state of São Paulo, Brazil.
Source: Original survey data
Figure 4: Reliefs in a coffee production area in the Pompeia region, state of São Paulo, Brazil.
Source: Original survey data
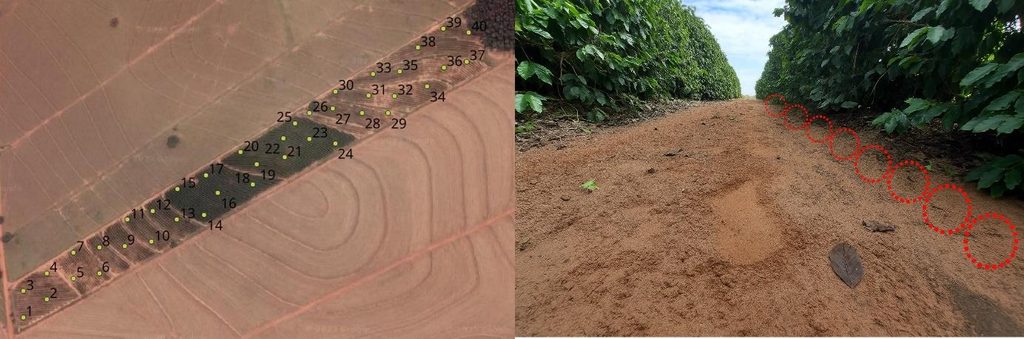
For sample collection, the QGIS software was used to create a “grid” with forty georeferenced points across the entire sampling area, with a distance of fifty meters between each point (Figure 5). At each sampling point, eight subsamples were systematically taken, at a depth of 0 to 20 centimeters, within the projection of the coffee tree canopy, using an auger. The subsamples were homogenized in a bucket to form a composite sample. The collection occurred during the vegetative rest phenological stage of the coffee plantation.
Figure 5: Sampling points in a coffee production area in the Pompeia region, São Paulo state, Brazil.
Source: Original survey data
The samples were sent to the soil and plant tissue analysis laboratory of the Shunji Nishimura Foundation for Technology. The determination of the results followed the methodology written by IAC (Agronomic Institute of Campinas), published in the book “Chemical analysis for the evaluation of tropical soil fertility” (Raij et al., 2001). Calcium and magnesium determinations were established by spectrometry, using an ammonium chloride solution. For phosphorus, a spectrophotometric equipment with a mixture of cation and anion exchange resins saturated with sodium bicarbonate was used. Potassium was determined by flame photometer, using ammonium chloride.
Based on the soil analysis results, an exploratory data analysis was performed to identify the distribution of nutrient levels, possible outliers, correlations, and trends, using the JASP software. Linear regression was employed to understand the availability of the nutrients phosphorus (P), potassium (K), calcium (Ca), and magnesium (Mg) and to statistically quantify the relationships between different variables. The simple linear regression model was used, expressed by equation (1):
Y = β₀ + β₁X + ε (1)
In this equation, Y represents the dependent variable, X the explanatory variable, β₀ the intercept, and β₁ the slope coefficient. The validation of the regression model involved checking the normality of the residuals, using the Ryan-Joiner test, and homoscedasticity, assessed by the Breusch-Pagan test and graphical analysis of the residuals. The adjustment of the models was performed using the coefficient of determination (R²), and the statistical significance of the explanatory variables was evaluated by statistical tests applied to the regression coefficients (Fávero and Belfiore, 2017).
3. Results and Discussion
Exploratory data analysis, performed with the support of JASP software, allowed for the investigation of the availability of the nutrients phosphorus (P), potassium (K), calcium (Ca), and magnesium (Mg) and their relationships, using linear regression to statistically quantify the interactions between the variables.
Descriptive analysis for Phosphorus
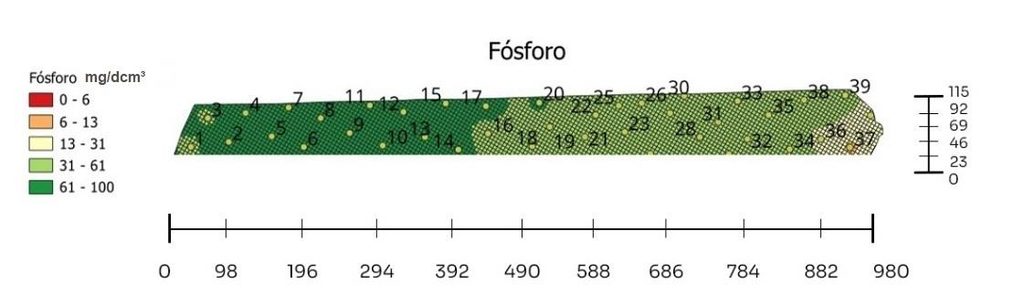
The spatial analysis of Phosphorus (P) revealed that 55% of the study area presents high levels of this element, 37.5% very high levels, and 7.5% medium levels (Figure 6). Adequate phosphorus supply is crucial for root development and plant vigor, contributing to the formation of a healthy coffee stand (Santinato et al., 2014).
Figure 6. Spatial variability of soil phosphorus availability in a coffee production area in the Pompeia region, state of São Paulo, Brazil.
Source: Original research results
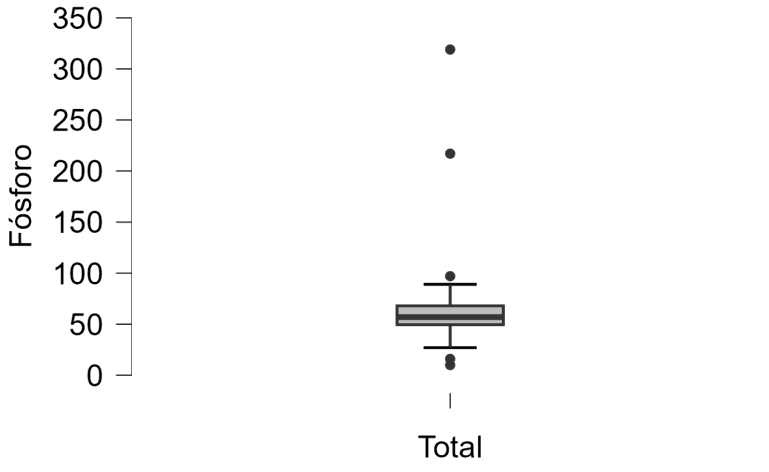
Soil phosphorus levels showed an average of 67.650 mg/dm³, with minimum values of 10 mg/dm³ and maximum values of 319 mg/dm³, indicating the presence of discrepant data (outliers). These outliers may be associated with environmental factors, soil nutritional variability, or sampling and analytical errors. The dynamics of P in the soil are complex, especially in weathered soils with iron and aluminum oxides (Fink et al., 2016).
The Boxplot (Figure 7) illustrated the dispersion and central tendency, showing that most results are concentrated between 50 (Q1) and 68 (Q2) mg/dm³. Five outliers were identified, both lower (10 to 16 mg/dm³) and upper (97 to 319 mg/dm³), signaling significant heterogeneity in the samples. The presence of extreme values may be due to the accumulation of phosphorus from nutritional repletions, or indicate deficiency in specific areas. High phosphorus levels can be attributed to the application of granular fertilizers, acidity correction, area management, and greater nutrient fixation to soil particles (Almeida, 2012).
Figure 7. Boxplot referring to the data of phosphorus availability in the soil in a coffee production area in the region of Pompeia, state of São Paulo, Brazil.
Source: Original research results
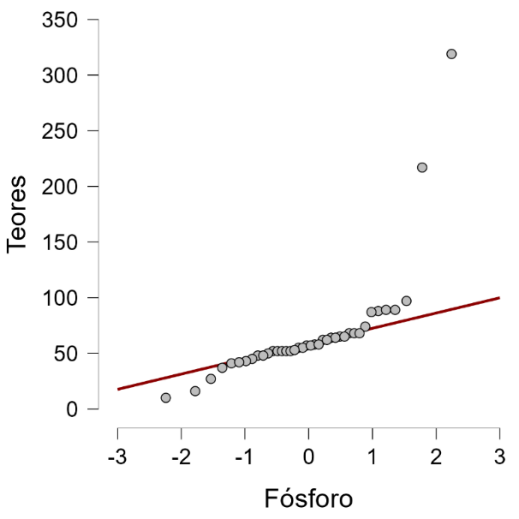
The QQ-Plot graph (Figure 8) revealed that, although most points are aligned with the reference line, the presence of outlying extremes suggests that the sample does not adhere to a normal distribution.
Figure 8: QQ-Plot graph referring to soil phosphorus availability data in a coffee production area in the Pompeia region, São Paulo state, Brazil.
Source: Original research results
Descriptive analysis for Potassium
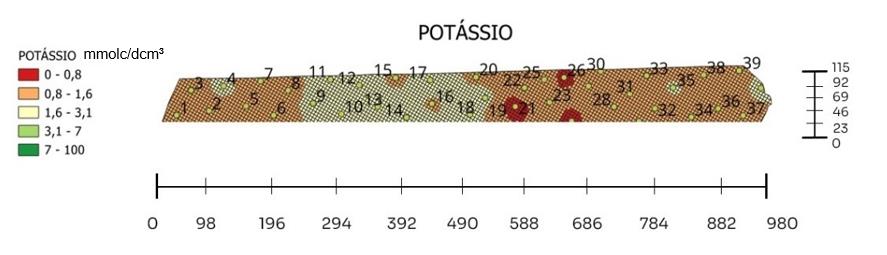
For Potassium (K), 62.5% of the area showed low levels and 7.5% very low levels (Figure 9), with an average of 1.36 mmoolc/dcm³ and a median of 1.25 mmoolc/dcm³. Potassium is essential for grain formation, translocation of photoassimilates, and plant resistance to diseases and water stress, with a need similar to nitrogen for coffee plants (Mancuso, 2014).
Figure 9: Spatial variability of soil potassium availability in a coffee production area in the Pompeia region, state of São Paulo, Brazil.
Source: Original research results
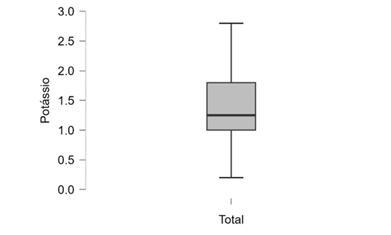
The Boxplot (Figure 10) for potassium indicated a concentrated distribution between 1.0 and 1.8 mmoolc/dcm³, without outliers, suggesting heterogeneity in the nutrient distribution in the sampled area.
Figure 10. Boxplot referring to the data of potassium availability in the soil in a coffee production area in the Pompeia region, state of São Paulo, Brazil.
Source: Original research results
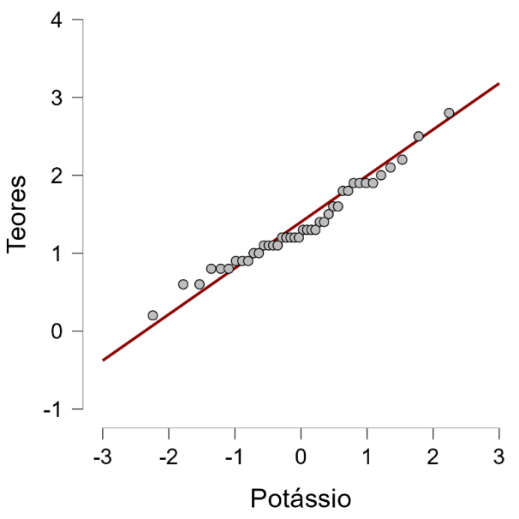
The QQ-Plot graph (Figure 11) for potassium showed that most points follow the trend line, indicating normality. Potassium levels showed greater homogeneity in the sampled area. Potassium absorption is influenced by calcium concentration (Ca²⁺) due to competitive inhibition (Duarte, 2019). Potassium availability in the soil is mainly affected by the application of agricultural amendments, and high values of acidity correctors can inhibit its absorption and contribute to leaching.
Figure 11. QQ-Plot graph referring to the data of potassium availability in the soil in a coffee production area in the Pompeia region, state of São Paulo, Brazil.
Source: Original research results.
Descriptive analysis for calcium
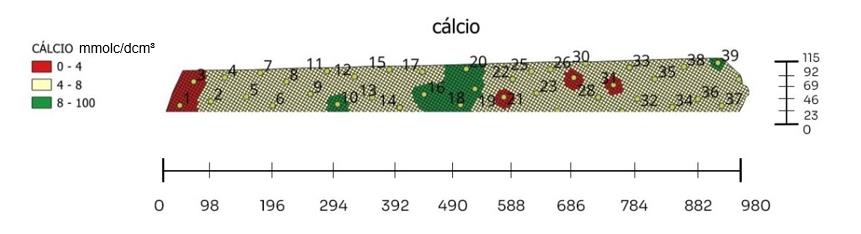
The classification of fertility maps for Calcium (Ca) indicated that 15% of the area has high levels, 72.5% medium content, and 12.5% low (Figure 12).
Figure 12. Spatial variability of calcium availability in the soil in a coffee production area in the Pompeia region, state of São Paulo, Brazil.
Source: Original research results
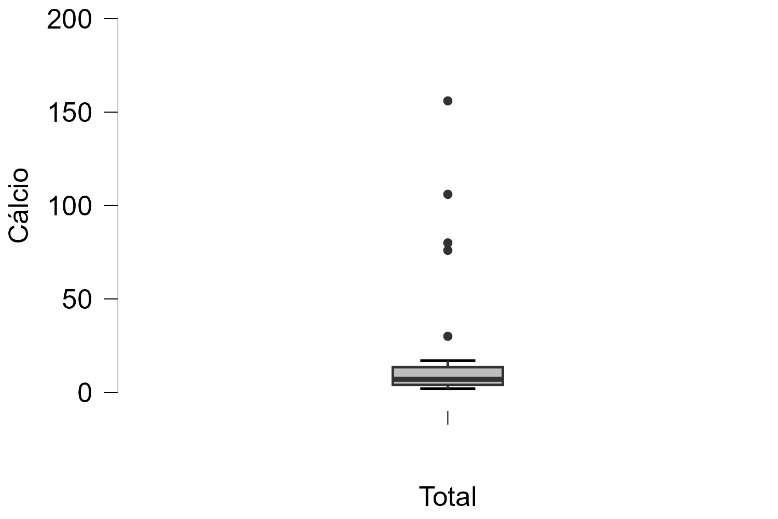
The mean for calcium was 17.75 mmolc/dcm³, and the median was 7 mmolc/dcm³, with a standard deviation of 31.49 mmolc/dcm³. This difference and the high dispersion indicate positive asymmetry and heterogeneity in the sample area, with values ranging from 2 to 156 mmolc/dcm³.
The Boxplot (Figure 13) confirmed the presence of upper outliers, with amounts above 50 mmolc/dcm³, which raise the mean and standard deviation. The positive skewness suggests that the measures of central tendency may not accurately represent the central behavior of the variable.
Figure 13. Boxplot of calcium availability data in the soil in a coffee production area in the Pompeia region, state of São Paulo, Brazil.
Source: Original research results
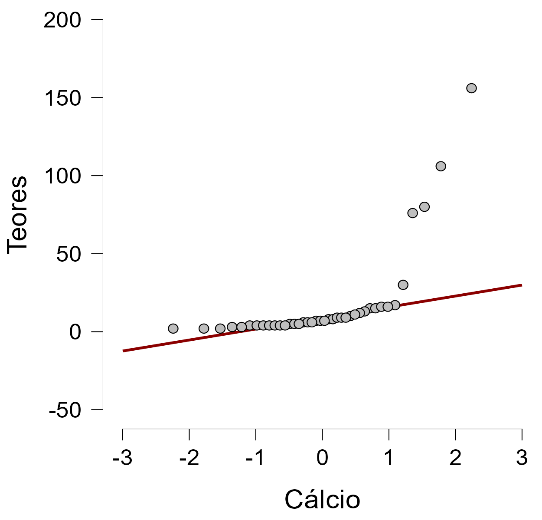
The QQ-Plot graph for calcium (Figure 14) showed that, although the points initially follow the reference line, they deviate significantly as the quantiles increase, indicating non-adherence to normality. Calcium levels are mainly influenced by area management and acidity corrections (liming).
Figure 14. QQ-Plot graph referring to the data of calcium availability in the soil in a coffee production area in the Pompeia region, state of São Paulo, Brazil.
Source: Original research results
Descriptive analysis for magnesium
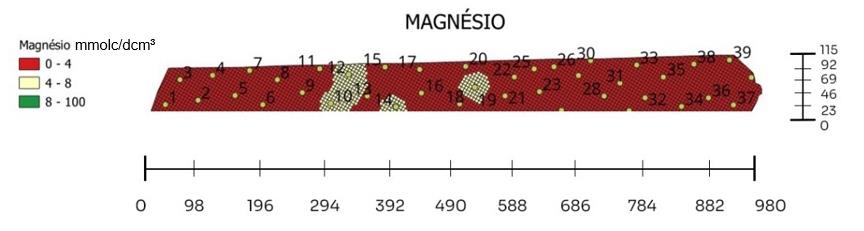
The classification of fertility maps for magnesium indicated that 10% of the area presents medium levels and 90% low levels (Figure 15).
Figure 15: Spatial variability of magnesium availability in the soil in a coffee production area in the Pompeia region, state of São Paulo, Brazil.
Source: Original research results
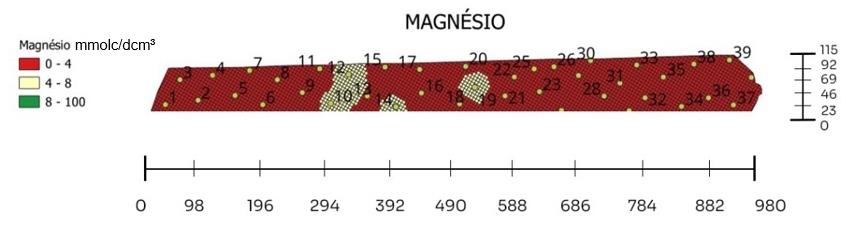
The average magnesium content was 4.05 mmolc/dcm³, with positive skewness and a standard deviation of 5.002 mmolc/dcm³, indicating high variability. The Boxplot (Figure 15) showed asymmetric behavior with the median shifted to the lower part, suggesting a higher concentration of low values.
Figure 15: Boxplot referring to magnesium availability data in the soil in a coffee production area in the Pompeia region, state of São Paulo, Brazil.
Source: Original research results
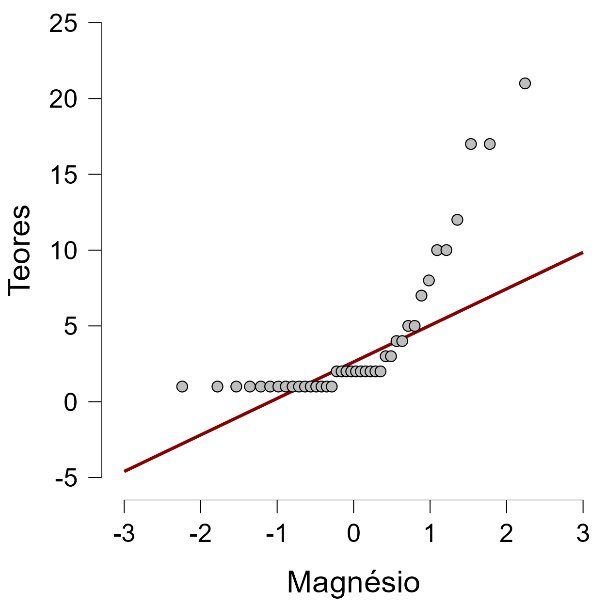
The QQ-Plot graph for magnesium (Figure 16) showed that most central points follow the reference line, indicating normality, but the upper quantiles showed a significant deviation due to outliers, reinforcing the positive asymmetry of magnesium.
Figure 16: QQ-Plot graph referring to the magnesium availability data in the soil in a coffee production area in the Pompeia region, São Paulo state, Brazil.
Source: Original research results
Interaction between nutrients
Calcium and magnesium
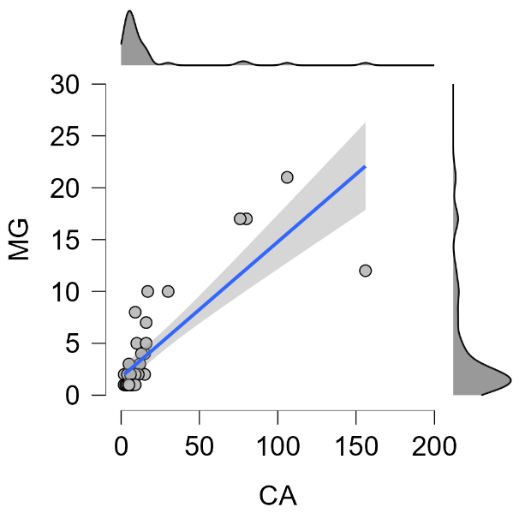
The Scatter Plot (Figure 17) revealed a strong correlation between calcium and magnesium in the soil. The increase in calcium is generally associated with the presence of magnesium, due to the application of acidity correctives (liming).
Figure 17: Scatter Plot graph referring to the interaction between calcium and magnesium present in the soil in a coffee production area in the Pompeia region, state of São Paulo, Brazil.
Source: Original research results
Simple linear regression between calcium and magnesium (Table 1) showed a coefficient of determination R²=0.674, indicating that approximately 67.4% of calcium variability is explained by magnesium content. Despite the good fit, there was a violation of the assumptions of normality of residuals and homoscedasticity of errors.
Table 1. Linear regression table between Calcium and Magnesium in a coffee production area in the Pompeia region, São Paulo state, Brazil
| Dependent variable | Independent variable | R² | Adjusted R² | RMSE |
|---|---|---|---|---|
| Calcium | Magnesium | 0,674 | 0,666 | 18,208 |
Source: Original research results.
The assessment of statistical assumptions (Table 2) for the interaction between calcium and magnesium, using original data, showed rejection of the hypothesis of normality of residuals (Ryan-Joiner test, p-value <0.01) and presence of heteroscedasticity (Breusch-Pagan test, p-value <0.05), indicating model inadequacy. The logarithmic transformation of the variables improved heteroscedasticity (Breusch-Pagan p-value 1.000), but not the normality of residuals (Ryan-Joiner p-value <0.01). The application of the Box-Cox transformation, with lambda close to zero, resulted in an unstable model, with inversion of the sign of β₁ and impossibility of calculating validation tests.
Table 2. Statistical tests between calcium and magnesium in a coffee production area in the Pompeia region, state of São Paulo, Brazil
| Model | β0 | β1 | Used test | Statistics | p-Value | Conclusion |
|---|---|---|---|---|---|---|
| No transformation | 1,421 | 0,1810 | Ryan-Joiner | RJ=0.885 | <0,01 | Non-normal residuals |
| Breusch-Pagan | R²=17.85 | <0,05 | Heteroscedasticity | |||
| Logarithmic transformation of variables X and Y | 1,1704 | 0,2957 | Ryan-Joiner | RJ=0.988 | >0,100 | Normal residuals |
| Breusch-Pagan | R2=0.00% | 1.000 | Homoscedasticity | |||
| Box Cox transformation of variables X and Y | 2,1226 | -0,975 | Ryan-Joiner | λ 0.5 | NA* | NA* |
| Breusch-Pagan | R²=75.54% | NA* | NA* |
Source: Original research results
From an agronomic point of view, the relationship between calcium and magnesium can be explained by the competitive interaction of cations in the soil, where an increase in magnesium can influence calcium availability. The results indicate the need for joint monitoring of nutrients and interventions such as correcting base saturation and adequate liming management to optimize plant uptake.
Potassium and calcium
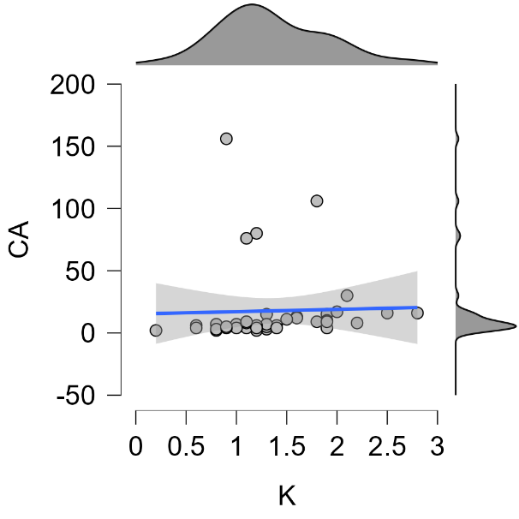
The Scatter Plot in Figure 18 suggests a low correlation between potassium and calcium in the soil. High calcium concentrations can inhibit the absorption of potassium by plants (Duarte, 2019).
Figure 18: Scatter Plot graph referring to the interaction between potassium and calcium present in the soil in a coffee production area in the Pompeia region, state of São Paulo, Brazil.
Source: Original research results.
A clear linear relationship between these variables was not observed, and a linear regression model was not applied. Agronomically, calcium levels showed a weak association with potassium variability, suggesting relatively independent behaviors. Although calcium and potassium are cations and can compete for exchange sites, this interaction was not relevant under the analyzed conditions. Individualized management of these nutrients is recommended, based on soil analysis and crop requirements, without the need for fine-tuning the relationship between them.
Potassium and magnesium
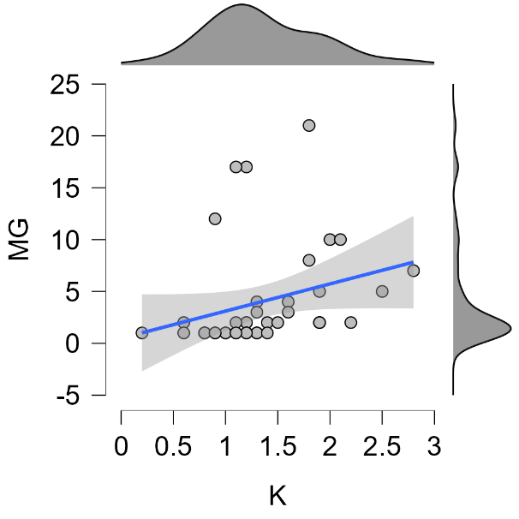
The Scatter Plot in Figure 19 indicated a pattern of linearity between potassium and magnesium concentrations, attributed to fertilizer application. However, magnesium and potassium compete for absorption, and magnesium has high mobility in the soil, making it more susceptible to leaching losses (Senbayram et al., 2015).
Figure 19: Scatter Plot graph referring to the interaction between potassium and magnesium present in the soil in a coffee production area in the Pompeia region, state of São Paulo, Brazil.
Source: Original research results
Simple linear regression between potassium and magnesium (Table 3) showed a poor fit, with R²=0.081, indicating that only 8.1% of the variability in potassium content is explained by magnesium. The adjusted R² of 0.057 reinforces the model’s reduced explanatory power, suggesting a weak linear association.
Table 3. Linear regression table between potassium and magnesium in a coffee production area in the Pompeia region, São Paulo state, Brazil
| Dependent variable | Independent variable | R² | Adjusted R² | RMSE |
|---|---|---|---|---|
| Potassium | Magnesium | 0,081 | 0,057 | 0,527 |
Source: Original research results.
The normality of the regression model residuals between potassium and magnesium (Table 4) was rejected by the Ryan-Joiner test (RJ=0.887, p-value <0,01), e a heterocedasticidade foi constatada pelo teste de Breusch-Pagan (p-valor <0,05). A aplicação da transformação logarítmica nas variáveis X e Y adequou o modelo aos pressupostos, evidenciado pela normalidade dos resíduos (p-valor >0.100) and homoscedasticity (p-value 1.000).
Table 4. Statistical tests for the interactions between Potassium and Magnesium
| Model | β0 | β1 | Used test | Statistics | p-Value | Conclusion |
|---|---|---|---|---|---|---|
| No transformation | 1,0865 | 0,01369 | Ryan-Joiner | RJ= 0.887 | <0,01 | Non-normal residuals |
| No transformation | 1,0865 | 0,01369 | Breusch-Pagan | R²= 55.97% | <0,05 | Heteroscedasticity |
| Logarithmic transformation of variables X and Y | 1,1283 | 0,0814 | Ryan-Joiner | RJ= 0.988 | >0,100 | Normal residuals |
| Logarithmic transformation of variables X and Y | 1,1283 | 0,0814 | Breusch-Pagan | R2=0.00% | 1.000 | Homoscedasticity |
Source: Original research results
Even after the logarithmic transformation, the relationship between potassium and magnesium showed low explanatory power. In the model without transformation, the angular coefficient (β₁= 0.01369) indicated a positive, albeit weak, relationship. In the model with logarithmic transformation, the coefficient (β₁ = 0.0814) also indicated a positive relationship, interpreted as elasticity, reinforcing a weak but more stable relationship on a relative scale. This behavior is attributed to the dynamics of these elements in the soil, with potassium exhibiting greater mobility and susceptibility to leaching, while magnesium tends to remain more adsorbed (Novais et al., 2007; Raij, 2011). The results suggest that management practices should consider specific strategies for each nutrient, such as potassium replenishment and magnesium monitoring, to avoid nutritional imbalances in perennial crops like coffee.
Interaction between phosphorus and other nutrients
Phosphorus and calcium
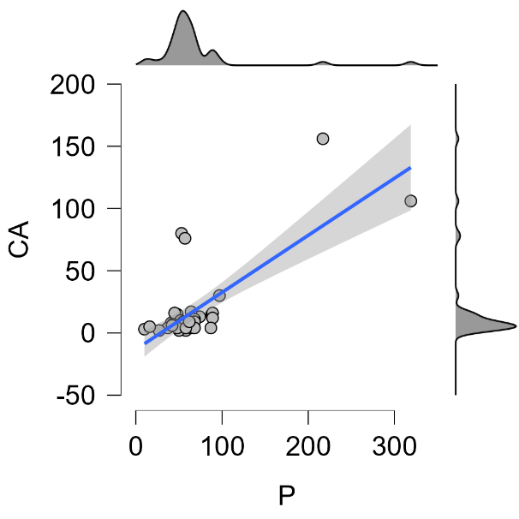
The Scatter Plot in Figure 20 indicated a small correlation between phosphorus and calcium concentrations. The dynamics of P in the soil are complex, with fixation by iron and aluminum oxides in weathered soils (Fink et al., 2016). P concentration is influenced by the application of acidity correctives and granulated fertilizers, which aid in its retention (Almeida, 2012).
Figure 20: Scatter Plot graph referring to the interaction between phosphorus and calcium present in the soil in a coffee production area in the Pompeia region, state of São Paulo, Brazil.
Source: Original research results
Simple linear regression between phosphorus and calcium (Table 5) showed a good fit, with R²= 0.557, indicating that approximately 55.7% of the variability in phosphorus content is explained by calcium content. The adjusted R² (0.545) reinforces the model’s consistency, suggesting a significant linear association.
Table 5. Linear regression table between phosphorus and calcium in a coffee production area in the Pompeia region, state of São Paulo, Brazil
| Dependent variable | Independent variable | R² | Adjusted R² | RMSE |
|---|---|---|---|---|
| Phosphorus | Calcium | 0,557 | 0,545 | 34,567 |
Source: Original research results
The normality of the residuals from the regression model between phosphorus and calcium (Table 6) was rejected by the Ryan-Joiner test (RJ = 0.704, p-value < 0,01). O teste de Breusch-Pagan indicou homocedasticidade (p-valor > 0.05). The logarithmic transformation stabilized the variance, but not the normality (p-value < 0.01). The Box-Cox transformation (λ = 0.5) was applied to reduce skewness and improve the fit.
Table 6. Statistical tests for the interactions between Phosphorus and Calcium
| Model | β₀ | β₁ | Used test | Statistics | p-Value | Conclusion |
|---|---|---|---|---|---|---|
| No transformation | 6,935 | 0,05333 | Ryan-Joiner | RJ=0.704 | <0,01 | Non-normal residuals |
| Breusch-Pagan | R²= 2.54% | >0,05 | Homoscedasticity | |||
| Logarithmic transformation of variables X and Y | 10,83 | 2,739 | Ryan-Joiner | RJ=0,871 | <0,010 | Non-normal residuals |
| Breusch-Pagan | R²=0.00% | 1.000 | Homoscedasticity | |||
| Box Cox transformation of variables X and Y | 10,83 | 2,739 | Ryan-Joiner | λ 0.5 | NA* | NA* |
| Breusch-Pagan | R²=49.66% | NA* | NA* |
Source: Original research results
In the model without transformation, the angular coefficient (β₁= 0.05333) indicated a positive relationship between phosphorus and calcium. Agronomically, this relationship may be associated with the low availability of phosphorus in tropical soils, where the nutrient interacts with calcium, forming compounds of lower solubility. Higher calcium levels can reduce phosphorus availability for plants (Novais et al., 2007; Raij, 2011). The results reinforce the importance of balanced soil fertility management, with agronomic interventions that consider the interaction between these nutrients to avoid imbalances.
Phosphorus and potassium
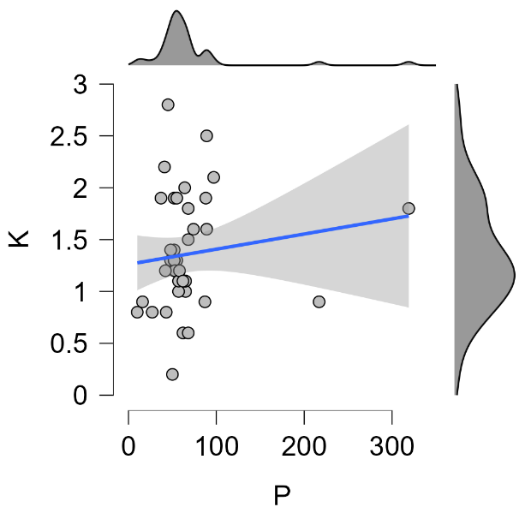
The Scatter Plot in Figure 21 indicated a small correlation between phosphorus and potassium concentrations, attributed to fertilizer application, but without a direct relationship between the nutrients.
Figure 21: Scatter Plot graph referring to the interaction between phosphorus and potassium present in the soil in a coffee production area in the Pompeia region, state of São Paulo, Brazil.
Source: Original research results
A clear linear relationship between the variables was not observed, and the linear regression model was not applied. The low association between phosphorus and potassium is attributed to the different dynamics of these nutrients in the soil: phosphorus has low mobility and is influenced by fixation and adsorption, while potassium has greater mobility and is subject to leaching (Novais et al., 2007; Raij, 2011). This difference in behavior reduces the possibility of a direct and consistent relationship between their concentrations. Individualized soil fertility management for each nutrient is recommended, prioritizing specific analyses, balanced fertilization, and frequent monitoring to avoid deficiencies or excesses.
The results presented, obtained through statistical analyses applied to soil data, allowed for a comprehensive understanding of the spatial distribution and variability of nutrients (phosphorus, potassium, calcium, and magnesium). Statistical tools, such as Boxplot and QQ-Plot, were useful for identifying asymmetries, trends, and outlier values, aiding in the interpretation and adequate management of the area. The interactions between nutrients were not uniform, with distinct behaviors among the evaluated elements. While some relationships, such as calcium and magnesium, showed a greater association, others, such as phosphorus and potassium, demonstrated low explanatory capacity, indicating the influence of external factors, such as management and soil characteristics, on their distribution. This variability highlights the importance of more specific and localized management strategies to optimize input use and nutrient uptake by crops.
4. Conclusion
This study analyzed the relationship between soil chemical elements in a coffee cultivation area, seeking to understand the interaction between nutrients and their influence on data variability. Through exploratory analyses and linear regression, it was found that the dynamics of phosphorus, potassium, calcium, and magnesium nutrients in the sampled area are complex and non-uniform. A strong correlation was observed between calcium and magnesium, with calcium variability being significantly explained by magnesium content, which was attributed to the application of acidity correctives. The relationship between phosphorus and calcium also showed a significant linear association. However, interactions such as phosphorus and potassium, and potassium and calcium, presented low correlation, indicating the absence of a direct linear relationship and the influence of external factors, such as management and intrinsic soil characteristics. In several regression models, the violation of statistical assumptions was identified, which required data transformations to improve the fit. The main contribution of the study lies in reinforcing the importance of individualized soil fertility management, based on specific analyses, to optimize input use and promote better performance of agricultural crops.
The complexity of chemical interactions in the soil, which makes it difficult to predict the behavior between certain nutrients, especially when there is no direct relationship between them, constitutes an intrinsic limitation to the study. Additionally, the number of samples and the absence of complementary variables, such as detailed physical soil characteristics and climatic factors, were identified as limitations that could enrich the analysis. For future research, the incorporation of more advanced spatial analysis techniques and the inclusion of new explanatory variables are suggested. Such approaches aim to deepen the understanding of nutrient relationships and improve soil management and fertility strategies, contributing to more effective and sustainable precision agriculture.
Bibliographic References
KROHLING, C. A.; BUSATO, L. M.; SARAIVA, U.; COSTA, A. L.; SIQUEIRA, A. P. O.; SOUZA, G.; MONTEIRO, V. 2014. Avaliação da fertilidade de solos de lavouras de café arábica em Marechal Floriano. In: Congresso Brasileiro de Pesquisas Cafeeiras, 2014, Serra Negra, SP, Brasil. Anais… Varginha, MG, Brasil: Fundação Procafé, 2014. p. 1–1.
MANCUSO, M. A. C. 2014. Efeito de fontes e doses de potássio na produção, nutrição e exportação de macronutrientes do café arábica. Revista Brasileira de Ciência do Solo 38 (5): 1448-1456.
MEDINA. s.d. O que é agricultura de precisão? Descubra! Disponível em: https://agropos.com.br/o-que-e-agricultura-de-precisao/. Acesso em: 20 jun 2025.
SOUZA, H. A.; LEITE, L. F. C.; MEDEIROS, J. C. 2021. Solos sustentáveis para a agricultura no Nordeste. EMBRAPA, Brasília, DF, Brasil.
Article originating from the Course Conclusion Work of the Specialization in Data Science and Analytics of the MBA USP/Esalq
To learn more about the course, click here and access the MBX Academy platform