
September 09, 2026
Principal Component Analysis and Clustering of Census Data in the Identification of Precarious Settlements
Carolina Horta Cattaneo; Jéssica Eloá Poletto
DOI: 10.22167/2675-6528-202602130
Article derived from a Final Course Work (TCC), with content based on the student’s original work and adapted to the editorial format of the Revista E&S with the support of the ResumeAI tool, an artificial intelligence solution developed by the Pecege Institute for textual synthesis and organization.
Summary
The identification of precarious settlements in Brazilian metropolitan areas still depends, to a large extent, on qualitative approaches and institutional classifications, which are often subjective and temporally outdated. This study evaluated the combined application of Principal Component Analysis (PCA) and the K-Means algorithm to segment urban census tracts from the 2010 Demographic Census, comparing the results with the official classification of Subnormal Agglomerates (AGSN) from the Brazilian Institute of Geography and Statistics (IBGE). Data from 33 metropolitan regions that contained AGSN were used. Four methodological configurations were tested, combining two sets of variables (one broad and one focused on vulnerability) with k=4 and k=5 clusters. The variables included urban infrastructure, sanitation, housing characteristics, and socioeconomic and racial profiles, and were subjected to Yeo-Johnson transformation and standardization. The correspondence of the clusters with the official classification was evaluated by the Adjusted Rand Index (ARI). The results revealed low correspondence in most regions, with ARI indices predominantly below 0.03. Higher performances were observed in Belém, Campinas, and Aracaju. Despite the low correspondence with the official classification, the approach demonstrated the ability to identify gradients of urban vulnerability in a systematic and replicable manner. This offers potential to support territorial prioritization in public policies, without, however, replacing established institutional classifications.
Keywords: Clustering; Unsupervised machine learning; Precarious settlements; Census tracts; Urban vulnerability.
1. Introduction
The accelerated urbanization in Brazil has generated significant challenges for territorial management, including the continuous expansion of precarious settlements in metropolitan areas. Since the 1950 Census, the Brazilian Institute of Geography and Statistics (IBGE) has been dedicated to the characterization and identification of these territories (IBGE, 2023), which show constant expansion over the last decades (IPEA, 2016). The typologies used for this classification have been revised, including in recent research (MCID, 2024), but these settlements persist with recurring characteristics, requiring strategic governmental actions to improve the living conditions of their residents. Currently, both IBGE and the Ministry of Cities (MCID) employ specific criteria to classify these areas, considering aspects such as housing conditions, access to essential services, and land regularization (MCID, 2023).
Despite institutional efforts, the identification of these settlements still faces relevant methodological challenges. Traditional approaches often rely on qualitative and institutional classifications, which are susceptible to subjectivity and temporal lag. There is a gap in the application of robust quantitative methods that can complement existing analyses, offering a more systematic and replicable view of urban vulnerability patterns.
In this context, methodologies based on multivariate statistics and unsupervised machine learning present considerable potential for improving the identification of underlying spatial and socioeconomic patterns in census data. Principal Component Analysis (PCA) is a widely used method for dimensionality reduction, which preserves the original data variability and allows the identification of latent patterns among variables (Fávero and Belfiore, 2017). This technique is crucial for synthesizing complex information from large datasets.
Clustering, in turn, with techniques such as the K-Means algorithm, demonstrates effectiveness in segmenting spatial data, grouping elements with similar characteristics (Fávero and Belfiore, 2017). The combination of PCA and K-Means has been applied in complex urban studies. Kubrusly and Saboia (2006) used multivariate statistical analysis to examine the employed population in metropolitan regions. Carvalho (2015) employed multivariate methods for urban landscape simulation. More recently, Carmo and Costa (2021) applied PCA for urban typologies, and Bortoletto et al. (2017) used PCA and clustering to assess socio-environmental vulnerability. In the field of census geospatial data, Krishnan (2023) and Rey et al. (2023) presented applications of K-Means and hierarchical clustering in socioeconomic data, evaluating performance using metrics such as Silhouette and Davies-Bouldin coefficients.
The gap in the systematic and replicable identification of precarious settlements, combined with the need for tools complementary to institutional classifications, justifies the exploration of quantitative approaches. Thus, the present study sought to evaluate the application of unsupervised machine learning algorithms, specifically PCA and K-Means, for the segmentation of urban census tracts from the 2010 Demographic Census, verifying the correspondence of the obtained groupings with the official IBGE classification for precarious settlements and exploring the potential of the approach as a territorial prioritization tool for in-depth analyses and interventions.
2. Material and Methods
The study used a quantitative approach, based on the application of unsupervised machine learning algorithms, specifically Principal Component Analysis (PCA) and K-Means, to segment urban census tracts. The research was conducted with data from the 2010 Demographic Census, comparing the obtained clusters with the official classification of Subnormal Agglomerates (AGSN) from the Brazilian Institute of Geography and Statistics (IBGE).
The dataset was built from publicly accessible secondary sources from IBGE, combining tables of results from the 2010 Demographic Census aggregated by census tract, the 2010 census tract mesh, and the 2019 AGSN (Areas of Social Interest) database. The integration of these sources was performed through spatial and tabular joins, resulting in a GeoDataFrame with socio-spatial information and the AGSN classification for each urban census tract in Brazilian metropolitan regions. The 2010 Census tables were obtained from the IBGE FTP server in thematic CSV files (Domicilio01, DomicilioRenda, Entorno01, Pessoa01, and Pessoa03). The census tract mesh was obtained from the IBGE FTP server in “shapefile” format and exported as geopackage [GPKG]. The delimitation of metropolitan regions was obtained from a “shapefile” from the Center for Metropolitan Studies [CEM/USP], converted to GPKG via QGIS. The AGSN database, in GeoJSON format, was used to mark tracts whose centroids are located within the polygons of subnormal agglomerations, generating the binary reference variable.
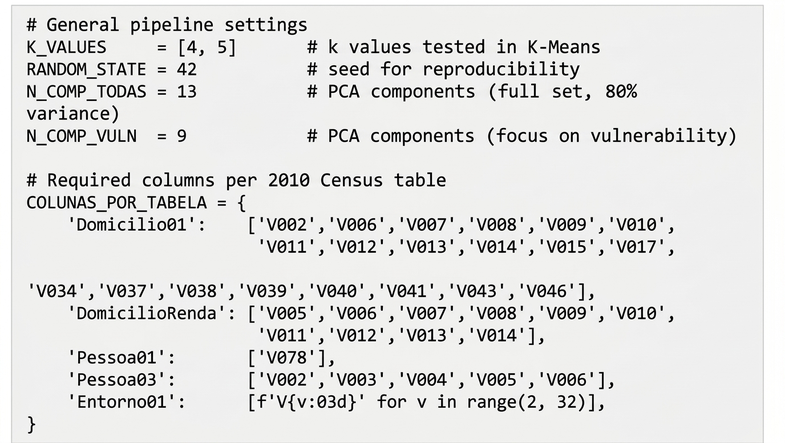
The data preparation pipeline was developed in Python, using the geopandas, pandas, numpy, and pyogrio libraries. The steps included: (1) automated download of sector “shapefiles” by UF; (2) selective extraction and reading of thematic CSVs, filtering sectors from metropolitan regions and necessary columns; (3) tabular join between “shapefile” and CSV data by sector code; and (4) spatial join between sector centroids and AGSN polygons for marking the reference variable. The result was exported in GPKG format. The general pipeline configurations and column mapping are detailed in Figure 1.
Figure 1. Code 1 – general settings and column mapping by table of the 2010 Census
Source: Original survey data
After integration, data were filtered to exclusively include urban sectors (Situacao_setor = 1) and sectors with a complete absence of surrounding information were excluded. Residual null values in household variables were replaced by zero.
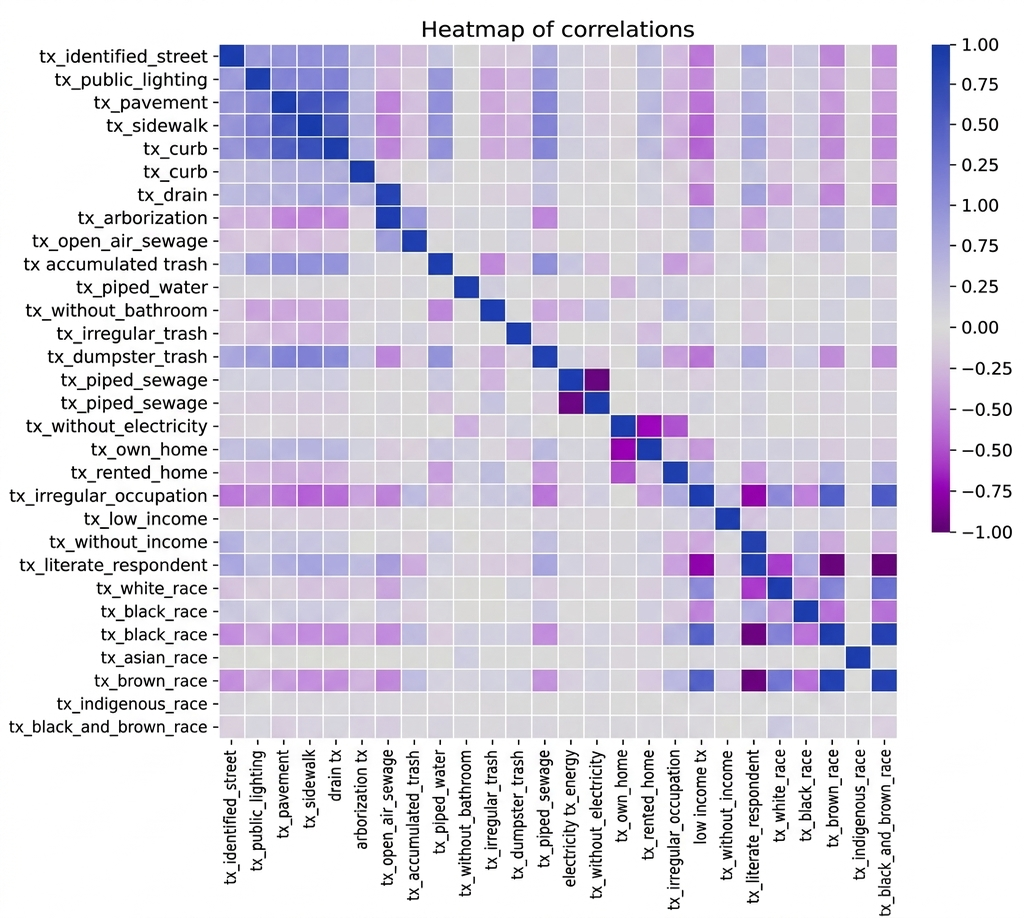
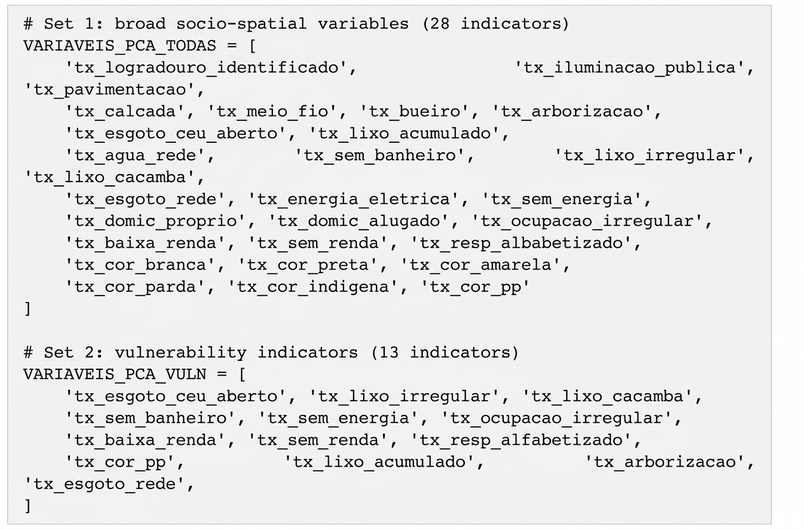
For the construction of the indicators, an exploratory correlation analysis was performed in the Metropolitan Region of São Paulo (RMSP) for methodological calibration. The correlation patterns are illustrated in Figure 2. Proportional indicators were calculated for each census tract, dividing absolute counts by totals of households, income, or people. The indicators were organized into four thematic categories: urban infrastructure, sanitation and collection, household characteristics, and socioeconomic and racial profile. Two sets of variables were defined for the PCA: the first, “all variables”, with 28 broad socio-spatial indicators; and the second, “focus on vulnerabilities”, with 13 indicators associated with housing precariousness and social exclusion. The definition of these sets is presented in Figure 3.
Figure 2. Correlation between socio-spatial indicators of the Metropolitan Region of São Paulo
Source: Original survey data
Figure 3. Code 2 – definition of the two sets of variables for PCA
Source: Original survey data
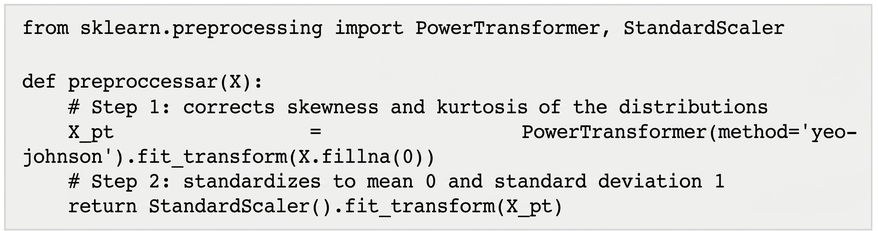
Before applying the algorithms, the data were pre-processed in two steps: (1) Yeo-Johnson transformation (PowerTransformer class from the scikit-learn library) to reduce skewness and kurtosis; and (2) standardization with StandardScaler to obtain variables with zero mean and unit standard deviation. The pre-processing function is illustrated in Figure 4.
Figure 4. Code 3 – preprocessing function: Yeo-Johnson transformation followed by standardization
Source: Original survey data
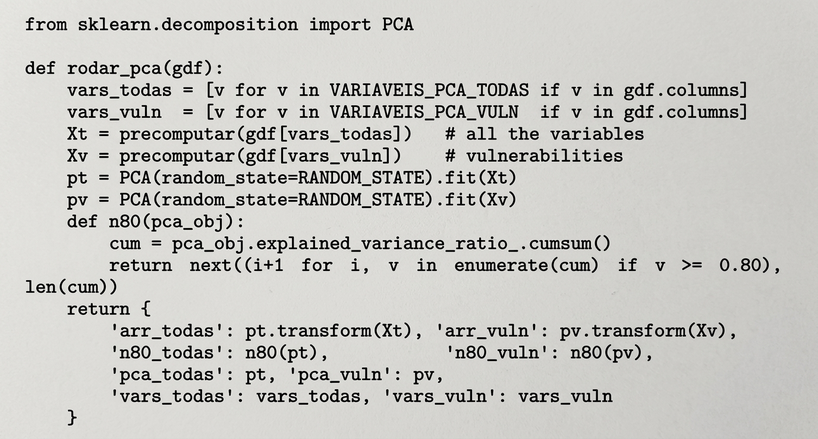
Principal Component Analysis (PCA) was applied separately for each set of variables, using the PCA class from the scikit-learn library. The number of retained components was defined by the criterion of 80% cumulative explained variance: 13 components for the complete set of variables and 9 for the set of vulnerabilities (Appendix A). The projections onto the first two principal components were exported. The application of PCA is detailed in Figure 5.
Figure 5. Code 4 – application of PCA for the two sets of variables, with a criterion of 80% accumulated variance
Source: Original survey data
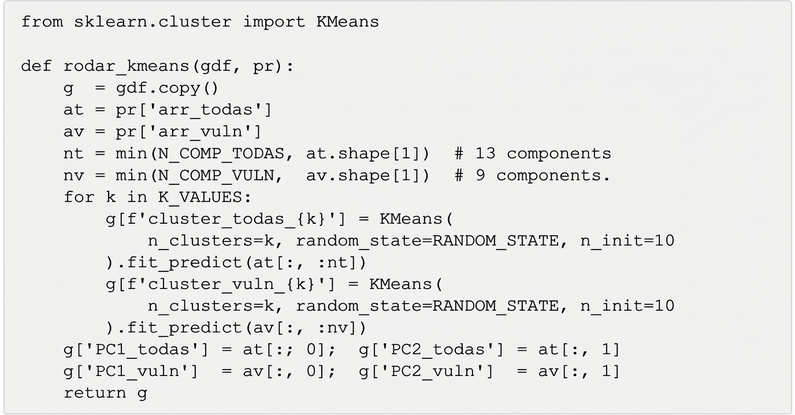
The clustering was performed with the K-Means algorithm, implemented by the scikit-learn library. Two values of k (4 and 5 clusters) were tested for each type of PCA, resulting in four configurations per metropolitan region: todas_k4, todas_k5, vuln_k4, and vuln_k5. The definition of k values was guided by the analysis of total inertia and the silhouette coefficient, applied to the RMSP. The algorithm was initialized with n_init=10 random initializations and a fixed random_state for reproducibility. The input for K-Means was the projection of the data onto the first selected principal components (13 for the complete set and 9 for the vulnerability set). The application of K-Means is shown in Figure 6.
Figure 6. Code 5 – K-Means application for the four configurations (PCA type × k)
Source: Original survey data
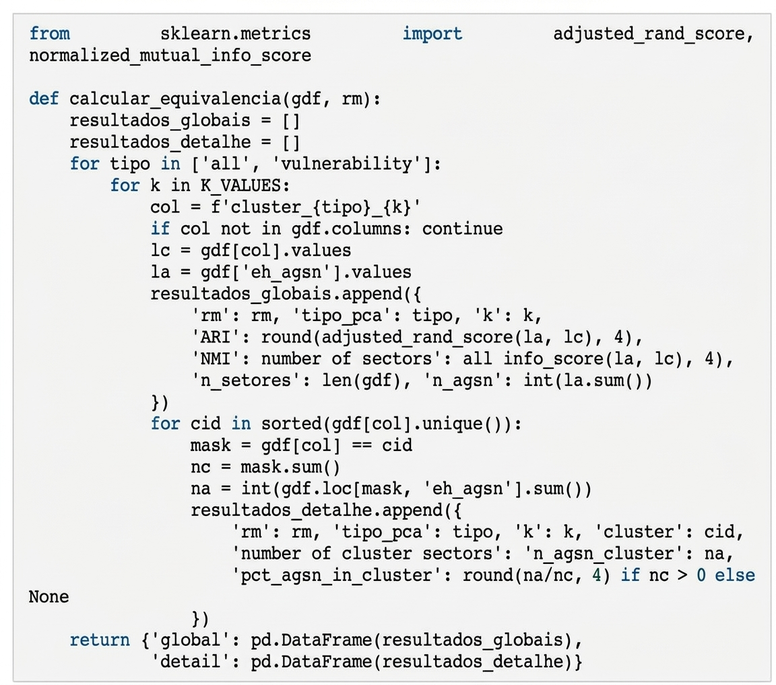
The correspondence between the generated groupings and the official AGSN classification was evaluated by the Adjusted Rand Index (ARI), implemented by the adjusted_rand_score function from the scikit-learn library. The ARI measures the similarity between two sets of discrete labels, adjusting the “Rand Index” by the expected chance. The Normalized Mutual Information (NMI) was calculated as a complementary metric. For each metropolitan region and configuration, the ARI, NMI, the total number of sectors, and the number of sectors classified as AGSN were recorded, along with the breakdown by cluster. For each metropolitan region and each
configuration, the ARI, NMI, the total number of sectors, and the number of sectors classified as AGSN were recorded, along with the breakdown by cluster with the proportion of AGSN sectors in each grouping (Figure 7).
Figure 7. Code 6 – ARI and NMI calculation by configuration, with detail by “cluster”
Source: Original survey data
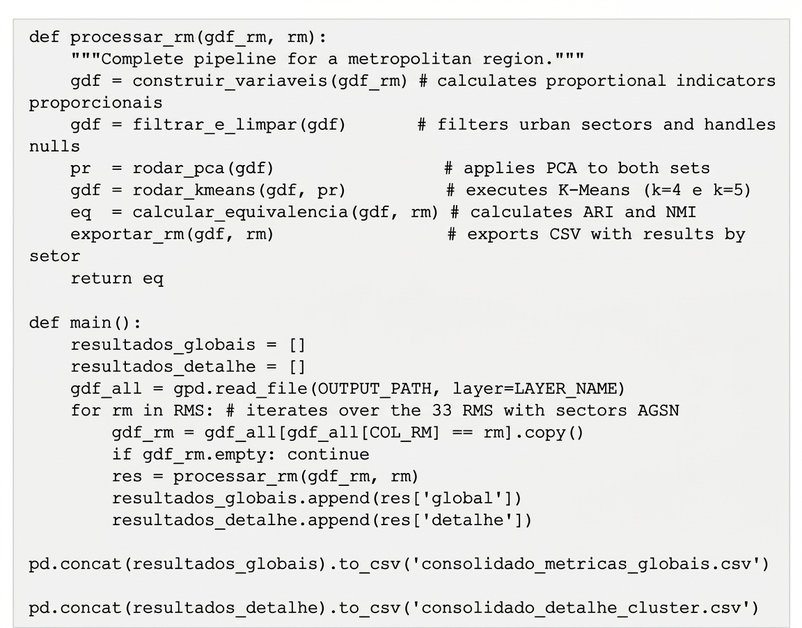
The study was initially developed and validated in the Metropolitan Region of São Paulo. In a second stage, the pipeline was expanded to all 33 Brazilian metropolitan regions with the presence of sectors classified as AGSN. To enable national-scale processing, the pipeline was structured modularly, processing each metropolitan region independently through a function that encapsulates all stages: indicator construction, data filtering and cleaning, PCA application, K-Means execution, metric calculation, and results export. The results were consolidated into CSV files. The main pipeline function is illustrated in Figure 8.
Figure 8. Code 7 – main function of the “pipeline”: modular processing by metropolitan region
Source: Original survey data
3. Results and Discussion
The analysis was conducted for all 33 Brazilian metropolitan regions that presented sectors classified as Subnormal Agglomerations (AGSN) by the 2019 IBGE database. For each region, four methodological configurations were tested, combining two types of Principal Component Analysis (PCA) – one with all socio-spatial variables and another focused on vulnerability indicators – and two values for the K-Means algorithm (k=4 and k=5). The correspondence between the generated clusters and the official IBGE classification was evaluated by the Adjusted Rand Index (ARI), a metric that ranges between -1 and 1, where values close to zero indicate agreement equivalent to chance.
In the first principal component (PC1) of the complete set of variables, indicators associated with urban precariousness and racial inequalities stood out, such as the proportion of low-income households, the proportion of black or brown people, and deficient infrastructure. These factors showed an inverse correlation with variables reflecting more consolidated infrastructure, such as paving and sidewalks, suggesting that PC1 represents a gradient of territorial inequality. The second component (PC2) reflected differences in the type of household tenure and access to infrastructure, distinguishing regular areas from informal settlements, as detailed in Appendix A of the original TCC.
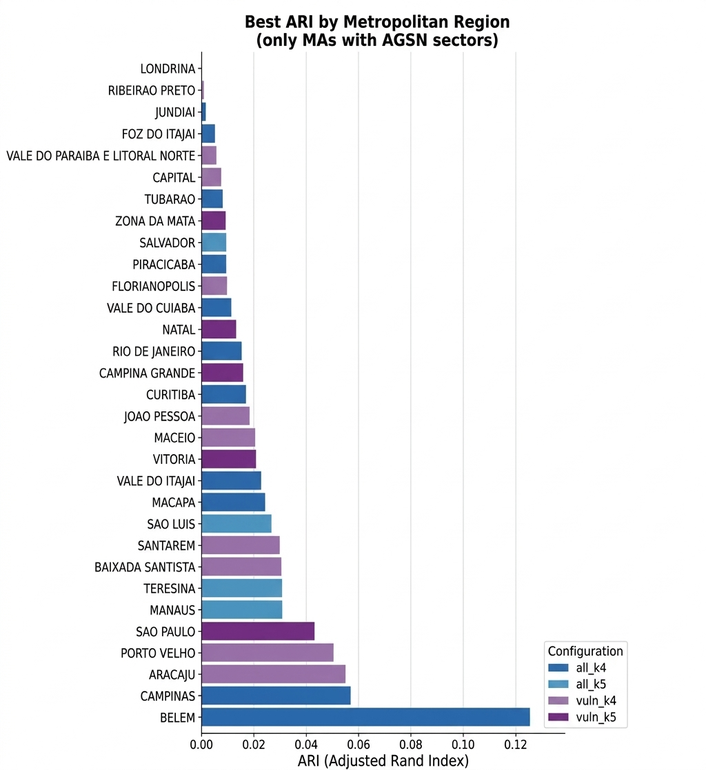
Figure 9 presents the best ARI obtained among the four configurations tested for each metropolitan region, ordered in ascending order. It is observed that the vast majority of regions concentrate values close to zero, with emphasis on Belém (ARI = 0.125), Campinas (ARI = 0.057), and Aracaju (ARI = 0.055), which showed the highest performances.
Figure 9. Best ARI by metropolitan region (only RMs with AGSN sectors)
Source: Original research results
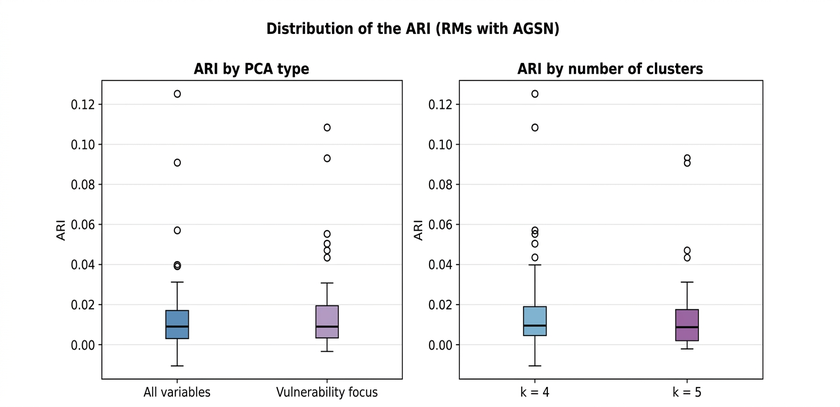
Figure 10 complements this analysis through comparative “boxplots”, displaying the distribution of the ARI separately by PCA type and by number of “clusters”. In both panels, the dispersion is reduced and the median values are close to zero, indicating that neither the choice of the variable set nor the definition of the number of groupings had a significant systematic impact on the correspondence with the official classification. The absence of relevant difference between the configurations reinforces that the model’s performance is more conditioned by the socio-spatial characteristics of each metropolitan region than by the methodological parameters adopted.
Figure 10. Distribution of ARI by PCA type and by number of clusters (RMs with AGSN)
Source: Original research results
Performance by metropolitan region and configuration
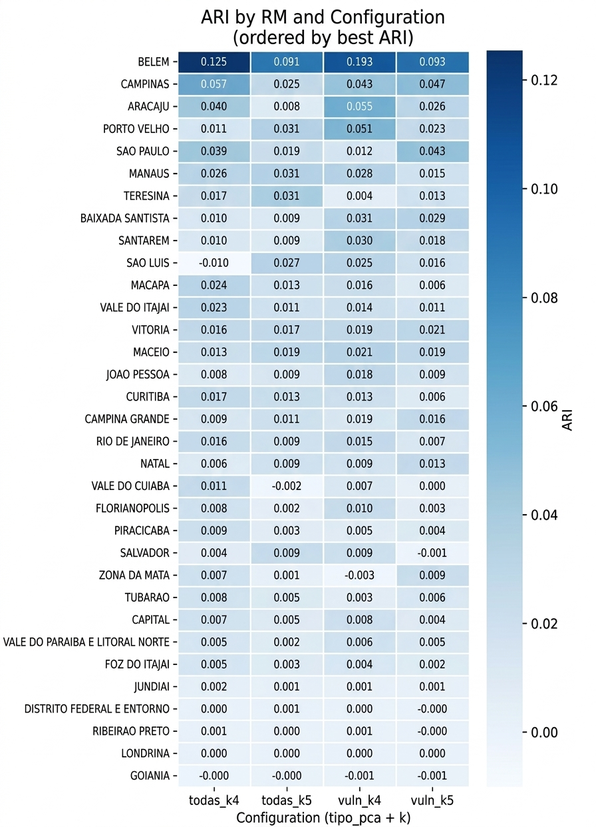
The distribution of ARI by metropolitan region revealed a clear hierarchy of performance (Figure 11). Belém presented the highest ARI value among all analyzed regions and configurations (ARI = 0.125, configuration all_k4), standing out expressively in relation to the others.
Figure 11. ARI by metropolitan region and methodological configuration (ordered by best ARI)
Source: Original research results
The analysis of the relationship between ARI and the proportion of AGSN sectors in the metropolitan region indicated a positive trend (Figure 12). Regions with a higher participation of AGSN in the set of urban sectors tended to present higher ARI values. This association suggests that, when precarious sectors represent an expressive portion of the analyzed universe, their socio-spatial characteristics generate greater systematic variability, favoring the identification of groupings by the algorithms. Belém, with about 50% of its urban sectors classified as AGSN, was the most expressive case, which helps explain its superior performance. Among the other regions, Campinas (ARI = 0.057, todas_k4) and Aracaju (ARI = 0.055, vuln_k4) stood out.
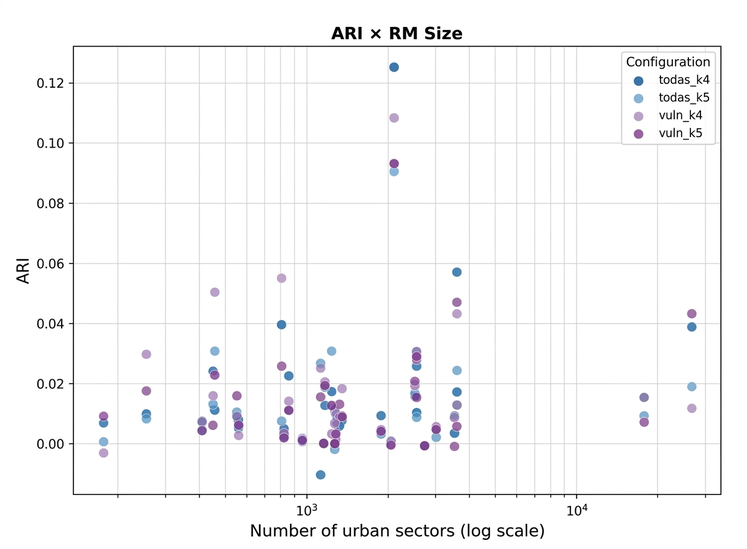
On the other hand, no clear relationship was identified between the number of urban census tracts and the model’s performance (Figure 13). This result indicates that the volume of data, in isolation, does not determine the quality of the groupings. Performance appears to be more associated with the internal structure of the socio-spatial variability of each region, especially the degree of differentiation between precarious and non-precarious sectors in the set of census variables, than with the scale of the analysis.
Figure 12. Relationship between ARI and proportion of AGSN sectors by metropolitan region
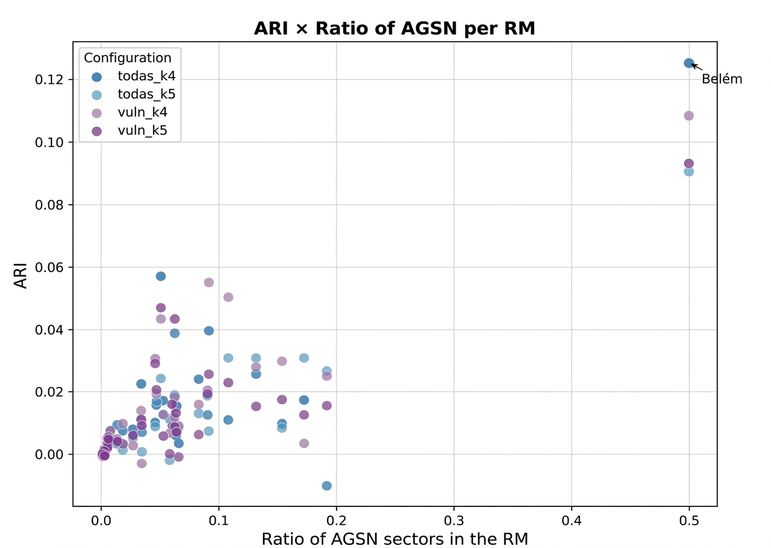
Figure 13. Relationship between ARI and number of urban census tracts in the metropolitan region (logarithmic scale)
Spatial Analysis: The Case of Belém
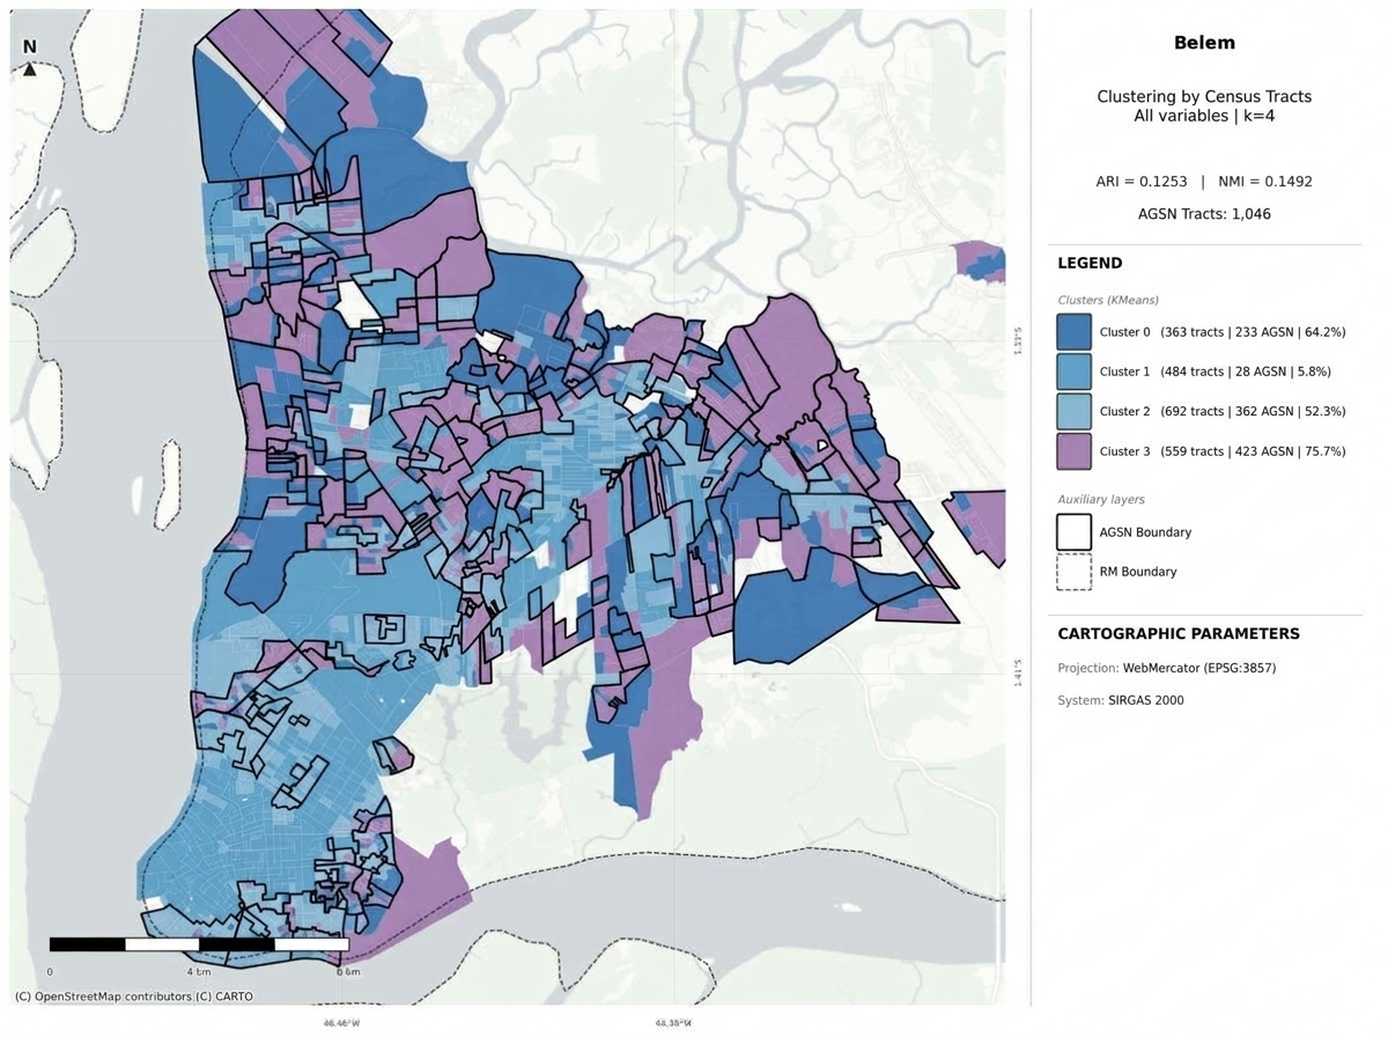
To deepen the interpretation of the results, Belém was selected for presenting the best metric performance and an urban context favorable to the application of the methodology. In the all_k4 configuration (ARI = 0.125), the territorial segmentation produced an interpretable and territorially coherent pattern. Cluster 3, composed of 559 sectors, concentrated 75.7% of its sectors in AGSN, while cluster 1, with 484 sectors, presented only 5.8% overlap with this classification. This polarization reflects the urban structure of the region, marked by the coexistence of areas with high infrastructure and sectors of intense housing precariousness.
Figure 14. Spatial distribution of “clusters” in Belém, all variables, k=4 (ARI = 0.125)
Source: Original research results; IBGE and Demographic Census (2010); IBGE and AGSN (2019)
The spatial distribution of clusters reveals a territorial structure consistent with Belém’s urbanization process, marked by the occupation of low-lying areas and riverside zones associated with housing precariousness, recurring characteristics of Amazonian cities (Castro, 2008). Cluster 3, with the highest concentration of AGSN sectors, is predominantly organized in the western and southern portions of the metropolitan region, coinciding with the low-lying areas and riverside occupations historically associated with housing precariousness. Cluster 2, with 52.3% overlap with AGSN, occupies an intermediate position and appears dispersed throughout the urban fabric, suggesting the presence of vulnerability gradients that permeate different portions of the territory.
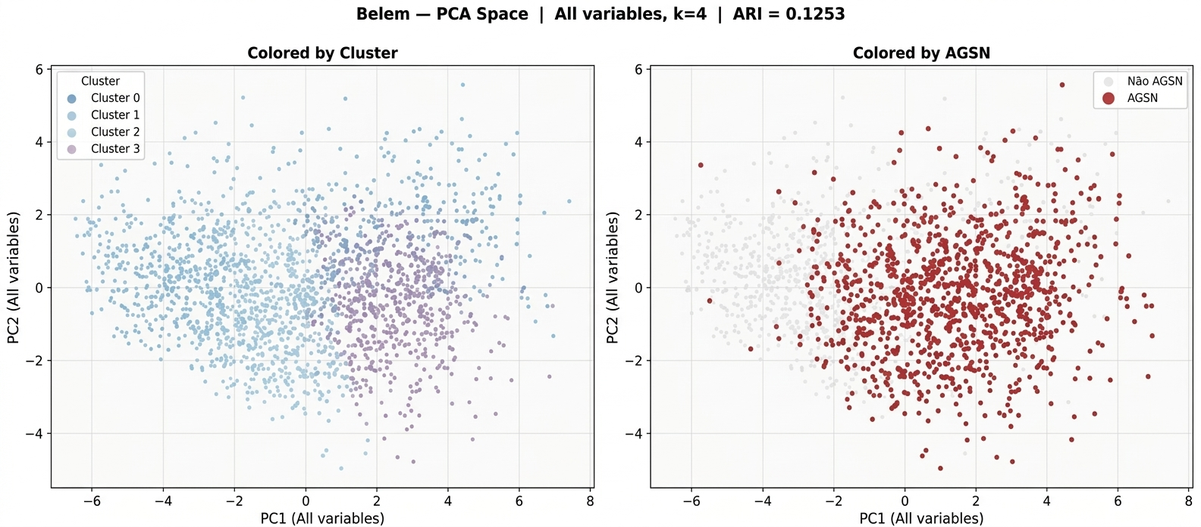
Cluster 1, with a lower proportion of AGSN, is concentrated in central areas and sectors with more consolidated infrastructure, evidencing the socio-spatial segregation pattern characteristic of Amazonian metropolises. This spatial organization reinforces the approach’s ability to capture real territorial structures, even when operating exclusively from aggregated census variables. The projection of sectors in the space of the first two principal components (PC1 and PC2) highlights the separation between groups, as shown in Figure 15.
Figure 15 Distribution of sectors in the PCA space in Belém, colored by “cluster” (left) and by AGSN classification (right)
Source: Original research results
4. Conclusion
This study evaluated the combined application of Principal Component Analysis (PCA) and the K-Means algorithm to segment urban census tracts from the 2010 Demographic Census, seeking to verify the correspondence of the obtained groupings with the official classification of Subnormal Agglomerations (AGSN) by IBGE and to explore the potential of the approach as a territorial prioritization tool. It was found that, in most of the 33 analyzed metropolitan regions, the correspondence between the generated groupings and the official classification was modest, with Adjusted Rand Index (ARI) values predominantly below 0.03. Higher performances were observed in Belém, Campinas, and Aracaju, and it was found that regions with a higher proportion of AGSN tended to present higher ARIs. Spatial Analysis demonstrated that the most vulnerable clusters, identified by the methodology, were organized coherently with the patterns of socio-spatial segregation and housing precariousness in Brazilian metropolises, with AGSN tracts concentrating in well-defined regions in the statistical space of PCA. This approach, therefore, demonstrated the capacity to identify urban vulnerability gradients systematically and replicably, offering a relevant practical contribution as a territorial screening tool at the metropolitan scale, capable of guiding the allocation of efforts for in-depth investigations and supporting public policies.
The results obtained should be interpreted considering some limitations. The AGSN classification, based on urbanistic and topological criteria, does not necessarily coincide with the socio-spatial profiles captured by census variables, which imposes an intrinsic limit on comparison and suggests that the methodology can identify vulnerable territories not yet formally recognized. Furthermore, the K-Means algorithm, sensitive to the data’s covariance structure, may not capture the internal heterogeneity of clusters in large regions, indicating that alternative methods could be explored in future studies. The 2010 Census database also presented completeness limitations in surrounding variables. To improve the research, it is suggested to replicate the methodology with the 2022 Demographic Census data, which will offer a more complete and updated base. It is also recommended to incorporate complementary variables, such as high-resolution satellite imagery data, environmental remote sensing indicators, and information on urban legislation, aiming to enrich the set of attributes and increase the model’s sensitivity in identifying urban vulnerability patterns.
Bibliographic References
Bortoletto, K.C.; Freitas, M.I.C.; Rossetti, L.A.F.G.; Freitas, A.C.; Oliveira, R.B.N. 2017. Análise da vulnerabilidade socioambiental e do uso do solo urbano da área insular de Santos – SP. Revista Brasileira de Cartografia 69(4): 769-790.
Carmo, M.B.S.; Costa, S.M.F. 2021. Tipologias urbanas para as pequenas cidades do delta do Rio Amazonas: uma proposição de categorização. Revista Política e Planejamento Regional 8(3): 440-459.
Carvalho, G.A. 2015. Comparação de métodos de análise multivariada na seleção de variáveis explicativas para modelos de simulação da paisagem urbana. Tese de Doutorado em Geografia. Universidade Federal de Minas Gerais, Belo Horizonte, MG, Brasil. Disponível em: . Acesso em: 12 mar. 2025.
Castro, E.M.R. 2008. Urbanização, Pluralidade e Singularidades das Cidades Amazônicas. 1ed. NAEA/UFPA, Belém, PA, Brasil.
Fávero, L.P.; Belfiore, P.P. 2017. Análise de componentes principais (PCA). p. 379-436. In: Fávero, L.P.; Belfiore, P.P. Manual de Análise de Dados: estatística e modelagem multivariada com Excel, SPSS e Stata. 1ed. Elsevier, Rio de Janeiro, RJ, Brasil.
Instituto Brasileiro de Geografia e Estatística [IBGE]. 2010. Dados de aglomerados subnormais e do universo do Censo Demográfico 2010. Disponível em: . Acesso em: 12 mar. 2025.
Instituto Brasileiro de Geografia e Estatística [IBGE]. 2022. Dados do Censo Demográfico 2022. Disponível em: . Acesso em: 12 mar. 2025.
Instituto Brasileiro de Geografia e Estatística [IBGE]. 2023. Favelas e comunidades urbanas: IBGE muda denominação dos aglomerados subnormais. Agência de Notícias IBGE, 13 out. 2023. Disponível em: . Acesso em: 10 mar. 2025.
Instituto de Pesquisa Econômica Aplicada [IPEA]. 2016. Caracterização e tipologia de assentamentos precários. Disponível em: . Acesso em: 09 mar. 2025.
Krishnan, R. 2023. Applied Geospatial Data Science with Python. 1ed. Packt Publishing, Birmingham, Reino Unido.
Kubrusly, L.S.; Saboia, J. 2006. Uma análise multivariada da população ocupada nas regiões metropolitanas brasileiras. Ensaios FEE 27(2): 411-436.
Ministério das Cidades [MCID]. 2023. Guia para o mapeamento e caracterização de assentamentos precários. Disponível em: . Acesso em: 05 mar. 2025.
Ministério das Cidades [MCID]. 2024. Favelas e comunidades urbanas: IBGE retoma termo histórico para censos e pesquisas. Disponível em: . Acesso em: 08 mar. 2025.
Rey, S.J.; Arribas-Bel, D.; Wolf, L.J. 2023. Geographic Data Science with Python. 1ed. Chapman and Hall/CRC, Londres, Reino Unido.
Article originating from the Course Conclusion Work of the Specialization in Data Science and Analytics of the MBA USP/Esalq
To learn more about the course, click here and access the MBX Academy platform