
September 16, 2026
The Predominance of Profitability and Nonlinear Relationships in the Valuation of Companies on B3
Nicolas Edouard Srour; José Erasmo Silva
DOI: 10.22167/2675-6528-202602299
Article derived from a Final Course Work (TCC), with content based on the student’s original work and adapted to the editorial format of the Revista E&S with the support of the ResumeAI tool, an artificial intelligence solution developed by the Pecege Institute for textual synthesis and organization.
Summary
The valuation of companies using market multiples has played a relevant role in financial analysis, especially in emerging markets, where the relationship between accounting fundamentals and market prices has not always been linear. The ability of machine learning models to explain the Price-to-Book Value (P/BV) ratio of Brazilian companies listed on B3 was investigated, using accounting, macroeconomic, and sectoral information, integrating interpretability via Shapley Additive Explanations (SHAP). For this purpose, a panel dataset was constructed with 4,646 quarterly observations from 251 companies, in the period from 2020 to 2025. Three ensemble models based on decision trees (Random Forest, LightGBM, and XGBoost) were estimated, using indicators of profitability, liquidity, leverage, operational efficiency, Selic rate, business sector, and the logarithm of total assets. The models were evaluated by temporal validation with expanding windows and out-of-sample testing. The results indicated that the boosting models outperformed Random Forest, evidencing that the relationship between accounting fundamentals and valuation was not adequately described by a purely linear structure. The variable importance analysis revealed that earnings per share, return on assets, and return on equity occupied central positions in explaining the P/BV ratio. However, earnings per share exhibited non-linear behavior and a distinct signal from immediate financial interpretation. It was concluded that machine learning, combined with interpretability techniques, contributed significantly to valuation analysis by capturing complex relationships between accounting variables and market pricing.
Keywords: Machine learning; Financial indicators; Interpretability; Stock market; Valuation.
1. Introduction
Every asset, whether financial or real, has an inherent value. The central challenge for success in investments and capital management is not just to estimate this value, but to understand and quantify its sources (Damodaran, 2012). Although the basic principles of corporate valuation are consistent, the application must be adapted to take into account the uncertainties and dynamics of specific markets. In Brazil, the stock market has developed vigorously, becoming a source of financing for companies and a channel for portfolio diversification for investors (Tavares and Silva, 2012). Given the significant role of the capital market in national economic development (Ghashami and Kamyar, 2021), an investor’s success depends on their ability to make asset allocation decisions to maximize returns (Ambrozini et al., 2019).
The traditional approach to company valuation is Fundamental Analysis, a technique that uses financial and accounting data to identify investment opportunities (Ambrozini et al., 2019). Metrics such as Price-to-Earnings and Return on Equity are widely accepted as value drivers (Fernandes et al., 2019). However, in a scenario of rapid changes and greater market openness, such conventional models may not capture the entirety of factors required by contemporary investors (Lima et al., 2011). This scenario reflects an academic debate on the notion of intrinsic value. Classical academics criticized the reliance on book value, arguing that market prices are determined primarily by purchasing power and dividends, not by accounting measures of assets (Graham et al., 1962). Other authors still advise against assuming a linear relationship between book value and economic value of equity, stating that historical accounting data provide little benefit for valuation purposes (Copeland and Weston, 1988; Brigham, 1982). Despite these theoretical limitations, the Price-to-Book (P/B) ratio remains a widely used metric. It captures the difference between the book value of equity and the market price, where a ratio above one indicates that investors are paying a premium over book value, and below one suggests a discount. Understanding why investors pay more or less than book value is fundamental, as it provides insights into which fundamental indicators justify market pricing, with Return on Equity being the most important variable justifying the P/B ratio (Damodaran, 2012).
It is observed that the relationship between market price and fundamentals is not trivial and requires cause-and-effect analysis. The classic fundamentalist approach often assumes linear and stable relationships between variables. This premise is constantly challenged by the complexity of the Brazilian stock market, which is characterized by being dynamic, non-linear, and highly sensitive to political and macroeconomic factors. Such a scenario demands constantly updated investment models (Silva et al., 2023).
This need drove the adoption of Machine Learning for building robust portfolios (Silva, 2020). Because they are capable of capturing complex non-linear relationships, these models exhibit superior predictive power for price fluctuations, aiding in risk mitigation (Ji et al., 2022; Kolani, 2022). However, most studies focused on sophisticated Machine Learning algorithms prioritize statistical accuracy over explainability, resulting in opaque “black-box” models (Ahmed, 2024). This lack of interpretability can limit analysts’ ability to validate results, increasing uncertainty and potentially leading to misguided decisions.
Given this gap, the present study seeks to integrate the predictive capability of Machine Learning with interpretability, using the P/B ratio as the target variable to investigate which indicators influence market pricing. To this end, Explainable Artificial Intelligence (XAI) methods, specifically Shapley Additive Explanations (SHAP), are applied to quantify and rank the contribution of each accounting and macroeconomic factor. In this way, the work connects the classic theoretical debate on book value to modern data science techniques, providing empirical evidence and practical guidance for valuation analysis in the Brazilian context. Thus, this study aimed to assess whether machine learning models can help explain the Price to Book Value relationship of Brazilian publicly traded companies.
2. Material and Methods
Classification and research design
The study was classified as descriptive-explanatory (Gil, 2017), following a path that began with data mapping and ended with causal interpretation. The descriptive aspect involved the systematic recording and analysis of financial indicators of companies listed on B3, based on official reports from the Securities and Exchange Commission (CVM). The core of the investigation was explanatory, focusing on identifying the variables that drive the phenomenon. For this, SHAP was used to decompose machine learning predictions, aiming to quantify how specific fundamentals, such as ROE, shape the Price/Book Value relationship in the Brazilian market.
Data Sources, Collection, and Preparation
The dataset was constructed by combining accounting and macroeconomic information from various sources. Financial statement data (Quarterly Information Form – ITR and Standardized Financial Statements – DFP) were obtained from the Securities and Exchange Commission (CVM) in CSV format. Daily stock quotes were collected separately from B3, using the historical COTAHIST files, which required a specific analysis code due to their fixed-width format. Stock liquidity information was obtained from the Fundus website, and a process of matching identifiers between Fundus, B3, and CVM was performed using the internal request of the B3 listed companies page (JSON format).
The Selic rate, from the Central Bank, was included to represent the macro-financial environment. The sample was restricted to the period from 2020 to 2025 due to the availability of data on the total number of shares in circulation starting from 2020. Companies without stock liquidity were excluded from the sample.
Data preparation involved reading and concatenating ITR and DFP files, keeping only observations from the most recent fiscal order and mandatory standard financial statements. Specific treatments were applied for accumulated values in the Income Statement (DRE) and Value Added Statement (DVA), and for the calculation of total debt. The final step consisted of aligning accounting data with market data: for indices requiring contemporaneous price, the closing price close to the statement date was used; for the P/B ratio, the average stock price in the month following disclosure was employed. After these procedures, a consolidated dataframe with 4,646 observations from 251 Brazilian companies was obtained, suitable for applying ML models.
Definition of variables and feature engineering
The feature engineering step consisted of converting raw accounting disclosures into financial indicators, as the CVM files do not provide them ready for use. The dependent variable was the Price/Book Value (P/VP) ratio, calculated by relating the average stock price in the month following the financial report’s disclosure to the company’s book value.
The explanatory variables were selected to capture dimensions of performance and financial situation, covering liquidity, profitability, leverage, operational performance, and market multiples. In addition to financial indicators, the Selic rate (macroeconomic variable) and the company’s sector of activity (to consider structural differences) were included. Most of the explanatory variables were constructed in relative form (ratios or proportional measures) to improve comparability between companies of different sizes. The natural logarithm of total assets was explicitly incorporated as a size variable. Table 1 details the financial indicators used.
Table 1. Financial indicators in the final table
| Indicator | Abbreviation | Description |
|---|---|---|
| Price to Book Value | P/VP | According to Braga (2009), the indicator provided a measure of comparison between the organization’s book value and the market value attributed to the company. |
| Current Liquidity | LC | Gitman (2010) points out that the current liquidity ratio measures the company’s ability to meet its short-term obligations. |
| Return on equity | ROE | This indicator describes the return obtained on shareholders’ investment (Gitman, 2010). |
| Net Debt to Equity | DL/PL | Klem (2022) indicates that the DL/PL demonstrates the volume of debt a company has used to finance its assets in relation to shareholders’ equity. |
| Return on Assets | ROA | This indicator measures the company’s ability to generate results from total resources under its control (CFA Institute, 2024). |
| Earnings Per Share | LPA | This indicator represents the portion of profit attributable to each outstanding ordinary share over the period (IFRS Foundation, 2023). |
| EBITDA Margin | This indicator expresses the proportion of revenue that is converted into operating income before interest, taxes, depreciation, and amortization (B3, 2025). | |
| Net Margin | This indicator demonstrates the portion of revenue that effectively converts into net profit at the end of the period (CFA Institute, 2024). | |
| Asset Turnover | This indicator measures the efficiency with which the company uses its assets to generate revenue (CFA Institute, 2024). | |
| Total Assets | This indicator corresponds to the total economic resources controlled by the entity and recognized in its balance sheet (IFRS Foundation, 2021). |
Source: Original research results
The choice of relative variables was also a methodological decision, as tree-based ensemble learning algorithms, although less sensitive to scale, benefit from indicators that focus on economically significant differences, separating the effect of company size from financial performance.
Machine Learning Models
To model the relationship between financial fundamentals and market price, machine learning techniques based on ensemble methods with decision trees were used. The algorithms Random Forest, XGBoost, and LightGBM were employed.
Random Forest, a “bagging” (bootstrap aggregating) method, trains multiple models from different samples of the original data and combines their predictions to reduce variance and increase stability (Ji et al., 2022; Kolani, 2022).
XGBoost and LightGBM are algorithms based on “boosting”, which build models sequentially, correcting the errors of previous trees to improve predictive performance (Silva and Sátiro, 2024). XGBoost is a scalable implementation of “gradient boosting” (Zhang and Gong, 2020; Mo et al., 2020). LightGBM, also based on “gradient boosting”, was designed for high efficiency, utilizing strategies such as “Gradient-based One-Side Sampling” (GOSS) and “Exclusive Feature Bundling” (EFB), and a histogram-based approach for greater speed and predictive accuracy (Ke et al., 2017; Wang et al., 2022).
The joint use of these models made it possible to compare different ways of constructing “ensemble” models and evaluate their performance based on metrics adopted in the literature (Silva and Sátiro, 2024).
Explainability technique
Due to the complexity and lack of transparency of machine learning models, Explainable Artificial Intelligence (XAI) was used to improve interpretability (Hosain et al., 2024; Meske et al., 2022). The SHapley Additive exPlanations (SHAP) method was employed, based on cooperative game theory (Shapley, 1953), to assign a contribution value to each feature, reflecting its marginal impact on the model’s prediction (Parsa et al., 2020; Mizdrakovic et al., 2024).
SHAP offers locally accurate and globally consistent explanations, allowing the decomposition of model predictions into individual feature contributions. This enabled the examination of the relative importance, direction, and magnitude of each variable’s effect on financial valuation (Mizdrakovic et al., 2024). SHAP results were visualized through variable importance plots and “beeswarm” plots, facilitating the understanding of how each variable influences the generated predictions and the main factors affecting the target variable (P/VP) (Mizdrakovic et al., 2024; Hosain et al., 2024).
3. Results and Discussion
Sample characterization and preliminary evidence
The final dataset comprised 4,646 observations from 251 Brazilian publicly traded companies, in the period from 2020 to 2025. The dependent variable was the P/B ratio, calculated using market prices observed after the disclosure of the corresponding accounting information. This temporal choice preserved the predictive nature of the exercise and reduced the possibility of contamination by future information.
The final set of characteristics combined accounting indicators, a macroeconomic control represented by the Selic rate, a variable for company size measured by the natural logarithm of total assets, and a sectoral identifier. As expected in a broad sample of companies, the data presented heterogeneity among observations, with distinct financial profiles among companies of different sectors, scales, and operational and capital structures.
Table 2 presents the financial indicators used in the study, with their respective abbreviations and descriptions, as defined in the original TCC.
Table 2. Financial indicators in the final table
| Model | R² (test) | RMSE (test) | MAE (test) | Overfitting gap |
|---|---|---|---|---|
| XGBoost | 0,644 | 1,228 | 0,669 | 0,326 |
| LightGBM | 0,574 | 1,348 | 0,742 | 0,367 |
| Random Forest | 0,427 | 1,570 | 0,848 | 0,262 |
Source: Original research results
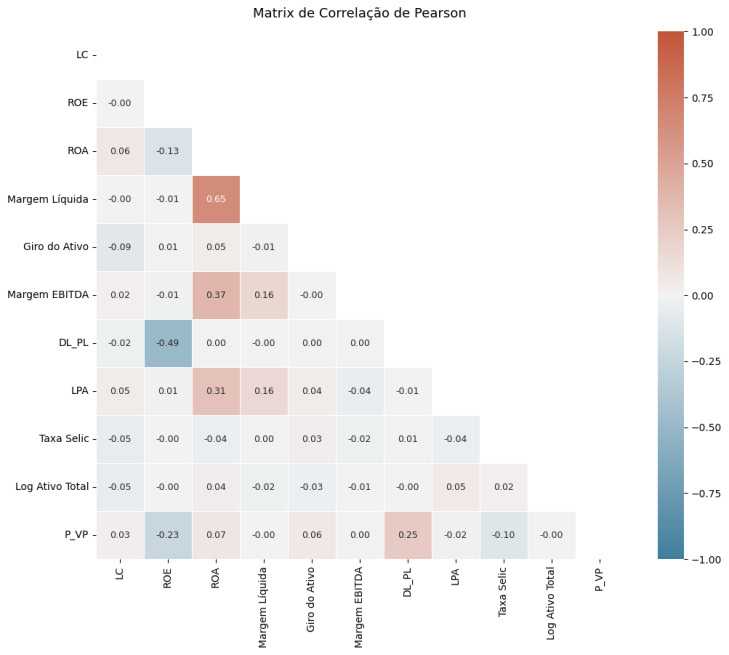
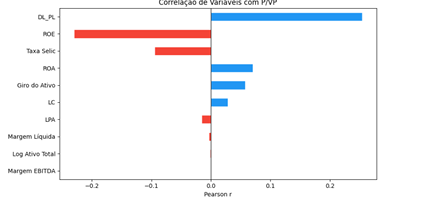
Figure 1 presents the Pearson correlation matrix for the final set of features, while Figure 2 shows the correlation between each explanatory variable and the P/VP ratio. The linear structure of the data is relatively weak. Among the explanatory variables, the Debt-to-Equity ratio (D/E) showed the strongest positive Pearson correlation with P/VP, while Return on Equity (ROE) showed the strongest negative linear association. In contrast, variables such as Earnings Per Share (EPS) and Return on Assets (ROA), which later prove central in the nonlinear analysis, did not show the highest correlation with the target variable. This difference already suggests that correlation alone may not adequately summarize the predictive relevance of the variables.
Figure 1. Pearson Correlation Matrix of the Final Feature Set
Source: Original research results
Figure 2. Pearson correlation between each characteristic and P/VP
Source: Original research results
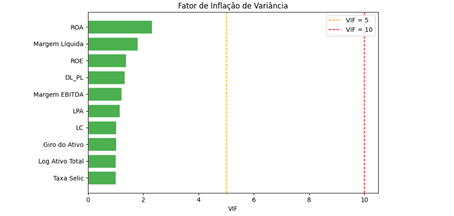
Figure 3 presents the variance inflation factor (VIF) for the final specification. All retained variables remained well below the conventional thresholds used to diagnose problematic multicollinearity. This result is important because it indicates that the final set of characteristics preserves distinct economic dimensions without linear redundancy, meaning the explanatory variables do not appear to be simple linear replicas of each other.
Figure 3. Final Feature Set Variance Inflation Factor
Source: Original research results
From a methodological point of view, these initial results are relevant because they indicate that the problem is not straightforward. If the relationship between fundamentals and market valuation were linear, pairwise correlations would likely provide a much clearer ranking of the variables. The fact that this does not happen is aligned with the literature demonstrating that machine learning methods become especially useful in finance when predictor-response relationships involve nonlinearities and interactions that standard linear tools do not represent well (Gu et al., 2020).
Predictive performance of the models
To evaluate the predictive performance, this study adopted a temporal validation strategy. The models were trained using observations up to 2024 and evaluated on the 2025 sample. Furthermore, an expanding window cross-validation procedure was used to assess out-of-sample performance over several years. This choice was made because it is closer to real forecasting conditions, as the model is always estimated using past information and tested on future observations.
Table 3 summarizes the results of the expandable window cross-validation. The results show a clear classification: XGBoost achieved the best average performance, followed by LightGBM, while Random Forest performed below both boosting-based models. This result is in line with empirical evidence pointing to the superiority of boosting methods and neural networks in asset pricing problems, especially in contexts with a large number of variables and complex relationships (Gu et al., 2020). Thus, the results of this study confirm that machine learning-based approaches offer relevant gains compared to traditional regression models.
Table 3. Cross-validation with expanding windows (average of the 4 temporal windows)
| Model | R² (training) | R² (test) | RMSE (test) | MAE (test) |
|---|---|---|---|---|
| Random Forest | 0,697 | 0,368 | 1,578 | 0,787 |
| LightGBM | 0,912 | 0,468 | 1,448 | 0,745 |
| XGBoost | 0,933 | 0,469 | 1,447 | 0,717 |
Source: Original research results
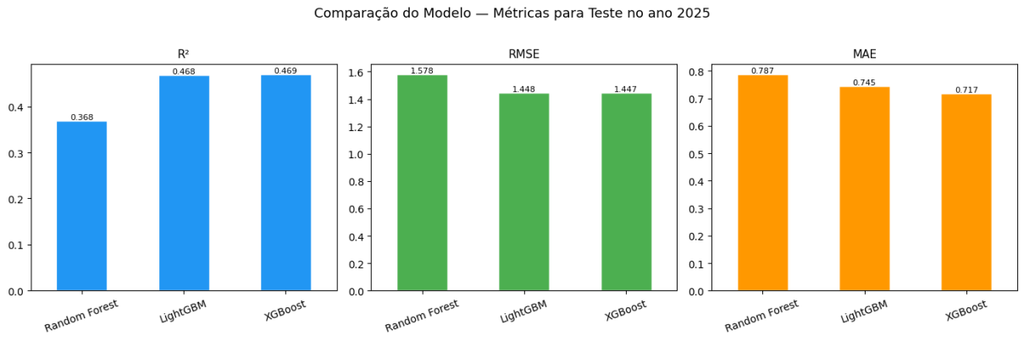
Table 4 and Figure 4 present the final cross-validation results for 2025. In this test year, XGBoost and LightGBM achieved similar predictive performance, and both outperformed Random Forest. The proximity between the two boosting models suggests that the main empirical signal was not driven by a single implementation, but rather by the general ability of boosting-based tree ensembles to model complex relationships with greater flexibility than the bagging benchmark. This result aligns with the literature, which indicates that boosting methods tend to perform better in problems with high complexity and non-linearity, as they are capable of iteratively correcting the errors of previous models and capturing more sophisticated interactions between variables (Chen and Guestrin, 2016; Ke et al., 2017).
Table 4. Final model performance (training until 2024; test = 2025)
| Position | Variable | Random Forest | LightGBM | XGBoost | Avg. pos. |
|---|---|---|---|---|---|
| 1 | LPA | 1 | 1 | 1 | 1,0 |
| 2 | ROA | 2 | 2 | 2 | 2,0 |
| 3-5 | DL/PL | 5 | 3 | 5 | 4,3 |
| 3-5 | Selic | 3 | 6 | 4 | 4,3 |
| 3-5 | ROE | 6 | 5 | 3 | 4,7 |
| 6-7 | Asset Turnover Ratio | 4 | 7 | 6 | 5,7 |
| 6-7 | Economic Activity Sector | 8 | 4 | 7 | 6,3 |
| 8 | Total Active Log | 9 | 8 | 8 | 8,3 |
| 9 | Net Margin | 7 | 9 | 10 | 8,7 |
| 10 | LC | 10 | 10 | 9 | 9,7 |
| 11 | EBITDA Margin | 11 | 11 | 11 | 11,0 |
Source: Original research results
Figure 4. ML models performance on the test set (2025)
Source: Original research results
At the same time, performance results should be interpreted with caution. The training R² of the boosting models remained significantly above the test R², suggesting some degree of overfitting even after regularization and early stopping. Furthermore, the validation year of 2025 appears to have been more difficult to predict than the average of the cross-validations. A possible explanation is that the macro-financial environment in that year made cross-sectional evaluation harder to explain with the available predictors. This interpretation is economically plausible, as valuation multiples reflect both expectations about future cash flows and the discount rates applied to them, so that changes in the interest rate environment can alter how accounting fundamentals translate into observed market prices (Campbell and Shiller, 1988).
SHAP analysis and classification of explanatory variables
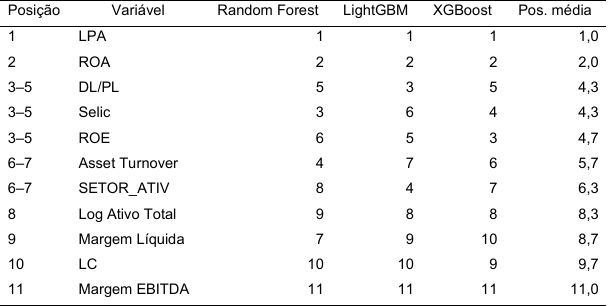
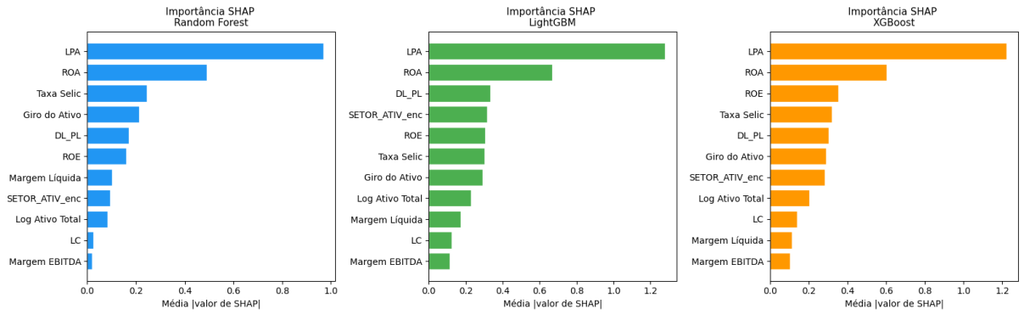
Table 5 summarizes the SHAP classification in the three models, while Figure 5 presents the corresponding average absolute SHAP values. LPA appears as the most important variable in all three algorithms, while ROA consistently holds the second position. A second layer of variables includes ROE, DL/PL, Selic, Asset Turnover, and the sector indicator, with some variation among the models. In contrast, current liquidity, net margin, and EBITDA margin show a relatively low marginal contribution when the broader set of characteristics is considered.
Table 5. Ranking of variable importance by model (SHAP)
Source: Original research results
Figure 5. Importance of SHAP characteristics
Source: Original research results
The dominance of LPA, along with the relevance of ROA and ROE, indicates that variables related to profitability constitute the main explanatory dimension of the P/B ratio. This result is aligned with the classic asset pricing literature, which assigns a central role to profitability in explaining market returns and multiples (Fama and French, 2015). However, the present study advances by demonstrating that this relationship does not manifest in a strictly linear way, being better captured by models based on machine learning.
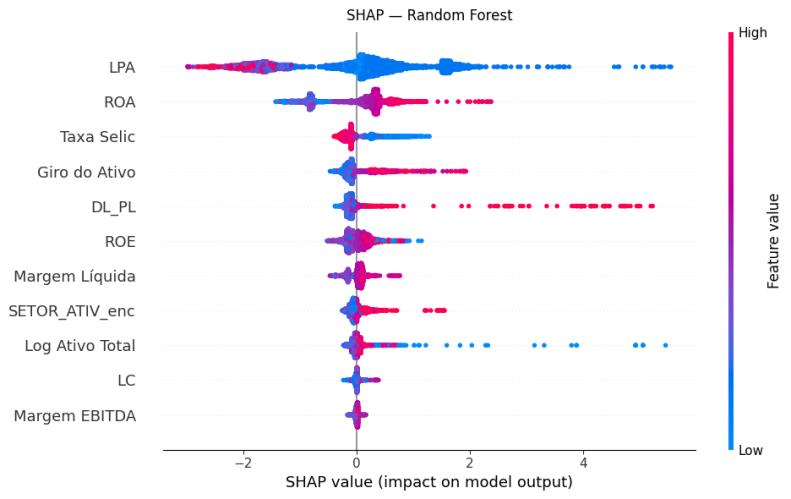
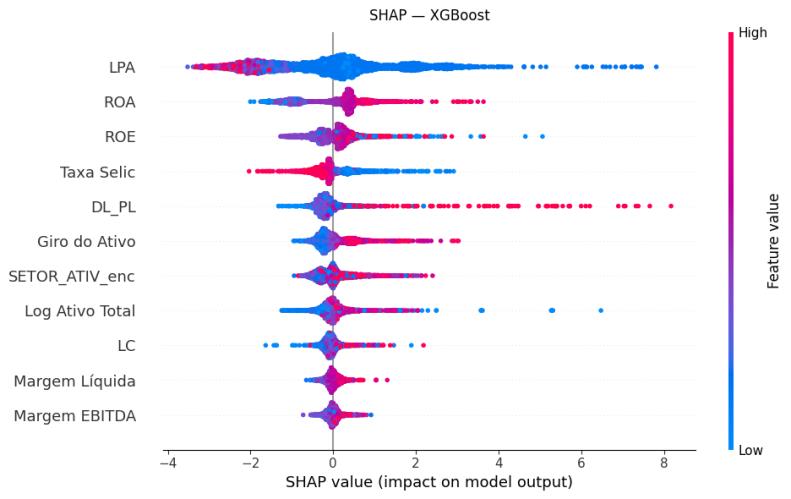
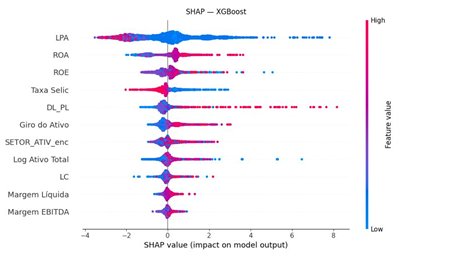
Figure 6, Figure 7, and Figure 8 provide additional information through SHAP scatter plots. These figures show that the main features do not act in a purely linear fashion. In the case of LPA, the contribution to the model outcome is strong and widely dispersed across observations, but its directional pattern is different from what is expected. Lower LPA values tend to be associated with positive SHAP values, while higher values tend to be associated with negative SHAP values. In other words, within the framework learned by the models, lower earnings per share are associated with an increase in the predicted P/B ratio, while higher earnings per share are associated with a decrease in the predicted P/B ratio. This result contrasts with the traditional interpretation of fundamental analysis, in which higher earnings per share would be directly associated with higher valuation multiples. However, the literature suggests that market prices reflect future expectations and not just current results, which may explain this nonlinear behavior (Kelly and Xiu, 2023).
Figure 6. SHAP scatter plot for Random Forest
Source: Original research results
Figure 7. SHAP scatter plot for LightGBM
Source: Original research results
Figure 8. SHAP scatter plot for XGBoost
Source: Original research results
The ROA and ROE patterns also suggest nonlinearity and contextual dependence. Their SHAP distributions are asymmetric and non-uniform, indicating that their contribution depends not only on their level but also on the broader configuration of the company’s characteristics. The crucial point is that the models are not simply learning that “more profitability is always better” in a linear and uniform sense. Instead, they are learning a more complex valuation structure, in which the marginal effect of each variable depends on the context in which it appears. This result is aligned with the literature, which shows that machine learning models capture interactions and nonlinear relationships between variables (Gu et al., 2020). Furthermore, the SHAP structure itself highlights conditional contributions, dependent on the context of each observation (Lundberg and Lee, 2017).
Linear correlation versus non-linear importance
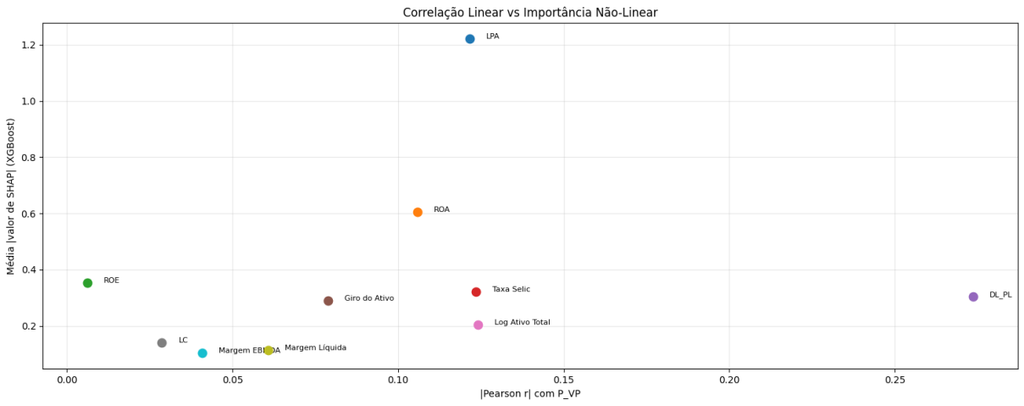
One of the study’s findings is the contrast between linear correlation and nonlinear importance. Figure 9 directly compares the absolute Pearson correlation of each feature with the mean SHAP value obtained by XGBoost.
Figure 9. Linear Correlation vs. Non-Linear Importance
Source: Original research results
From a pairwise linear perspective, DL/PL appears as the most strongly associated variable, while LPA does not stand out in its relationship with the target. However, the SHAP analysis produces the opposite result: LPA is the dominant predictor, while ROA and ROE also gain importance relative to their linear ranking. This finding is consistent with the study by Gu et al. (2020), which demonstrates that nonlinear models capture complex interactions between variables that are ignored by traditional linear approaches. The study shows that the predictive gains of these models stem precisely from the ability to model nonlinear relationships and interactions between predictors, which reinforces the results found in this work. Nonlinear models, therefore, contribute not only by improving predictive performance but also by refining the substantive interpretation of which company characteristics are most important for market valuation. This conclusion aligns with the literature arguing that the gains of machine learning in finance largely stem from its ability to accommodate nonlinear predictive interactions that are ignored by conventional models (Gu et al., 2020; Ye et al., 2024).
Economic interpretation of the main determinants
Empirical results indicate that the variation in the P/E ratio is mainly explained by profitability-related information, although not always in the direction suggested by simple financial intuition. The leading position of earnings per share, followed by return on assets and then by a second layer composed of leverage/equity, Selic rate, and return on equity, shows that the valuation process captured by the models primarily depends on measures related to earnings generation, capital structure, and companies’ macroeconomic financial conditions. Fama and French (2015) show that profitability is one of the main determinants of asset pricing, which is consistent with the predominance of earnings generation-related variables observed in this study.
This distinction is important. Variables such as ROA and ROE summarize economic performance in proportional terms, while EPS captures profits at the stock level. However, in the present case, the role of EPS cannot be interpreted as a simple positive evaluation signal. Although it is the most important predictor in all three models, the SHAP diagrams indicate an inverse directional pattern: lower EPS values tend to be associated with positive contributions to the prediction of the P/B relationship, while higher values tend to be associated with negative contributions. This suggests that the information contained in EPS is not limited to the strength of current profits. Instead, it appears to capture a broader distinction between companies with stronger current profits and companies trading at higher accounting multiples due to other attributes such as growth expectations, sector positioning, business maturity, or intangible value components not fully reflected in current accounting profitability. Campbell and Shiller (1988) demonstrate that market prices reflect expectations about future cash flows, while Damodaran (2012) argues that valuation multiples incorporate expected growth and risk, which helps explain the nonlinear behavior of EPS observed in this study.
The role of ROA is more direct. As the second most important variable in all models, ROA suggests that the market assigns weight to the company’s ability to generate profits from its asset base. In this sense, ROA appears to capture a dimension of efficiency that remains relevant even after controlling for earnings per share, leverage, and macroeconomic conditions. Penman (2013) associates return on assets with economic efficiency and value generation, reinforcing the interpretation of ROA as one of the main explanatory factors of the P/B relationship.
The contribution of ROE is also relevant, although less stable in the ranking than EPS and ROA. Its position among the three intermediate variables suggests that return on equity still matters for valuation, but in a more conditional and model-dependent way. This is in line with the idea that the market does not price ROE uniformly across companies, as the same level of ROE can reflect very different underlying combinations of profitability, leverage, and business structure. Damodaran (2012) highlights that ROE can reflect different combinations of profitability, risk, and capital structure, which helps explain why its effect is not manifested uniformly across companies.
The role of leverage, measured by the DL/PL ratio, is also more complex than linear correlation alone suggests. Although DL/PL showed the strongest correlation with the P/VP ratio, its SHAP ranking remained below that of the main profitability-related variables. This indicates that leverage is relevant, but not in a simple unidirectional sense. Instead, its contribution appears to depend on the broader configuration of firm characteristics, including profitability, size, and industry, meaning leverage seems to matter more as part of a joint valuation structure than as an isolated explanatory factor. Modigliani and Miller (1958) show that capital structure influences firm value under certain conditions, while Myers (1984) argues that leverage interacts with risk and investment opportunities, which is consistent with the conditional behavior observed in this study.
This result is aligned with asset pricing theory, according to which prices reflect discounted expectations of future cash flows, being sensitive to interest rates (Kelly and Xiu, 2023). In this sense, the relevance of the Selic in the SHAP ranking reinforces the idea that market valuation is shaped not only by company-specific accounting information but also by the macro-financial environment in which companies are priced.
Finally, the Asset Turnover appears in an intermediate position, below the main profitability, leverage, and macroeconomic variables, but still with a non-negligible contribution. This suggests that operational efficiency in asset utilization contains additional information to explain the P/B ratio, although its role is clearly secondary in relation to the main predictor variables.
Together, these results suggest that the models are learning a valuation structure in which profitability-related variables dominate, but their effects are not purely linear or uniform. The case of LPA is especially important in this regard: it is the most relevant predictor, but its directional contribution indicates that the market relationship captured by the models reflects more than a simple premium for higher current earnings. Instead, the models appear to incorporate a broader distinction between firms with strong current earnings and firms that command higher valuation multiples due to other characteristics that the market values.
Discussion of results based on literature
Firstly, the results reinforce the idea that variables related to profitability occupy a central position in explaining market valuation, although not always in the direction suggested by the most immediate financial intuition. The consistent relevance of EPS, ROA, and ROE indicates that companies’ ability to generate results remains a fundamental dimension for explaining the variation between market value and book value. However, the results also show that this relationship is neither purely linear nor uniform. In particular, the behavior of EPS in the SHAP graphs suggests that its contribution to the prediction of P/B depends on a more complex valuation structure, possibly associated with the interaction between current profitability, growth expectations, firm maturity, and sectoral characteristics. Nevertheless, in aggregate terms, the centrality of these variables remains compatible with the literature that highlights profitability as an important dimension of market pricing (Fama and French, 2015).
Secondly, the results strengthen the methodological argumentation for nonlinear modeling in the analysis of financial statements. The discrepancy between Pearson correlation and SHAP importance indicates that a large part of the economically significant signal operates through nonlinear forms and interactions. This is in line with the literature demonstrating that machine learning methods in finance generate gains when they can capture structures that linear models do not represent well (Gu et al., 2020).
Third, the evidence confirms that the firm’s fundamentals and macro-financial conditions jointly shape valuation multiples. The role of Selic demonstrates that accounting information alone is not sufficient to explain market valuation; the broader discount rate environment is also relevant. This result is consistent with standard valuation theory and with the empirical literature on pricing relationships between firm characteristics and market outcomes (Fama and French, 2015).
Limitations of the results
A first limitation refers to the temporal scope of the sample, which covers the period from 2020 to 2025. Although this interval includes relevant macroeconomic variations, such as changes in interest rates and different market conditions, it still represents a relatively short horizon for a study of a structural nature on valuation. Furthermore, this period is marked by atypical events, such as the effects of the COVID-19 pandemic, which may limit the generalization of the results to other historical contexts.
A second limitation is related to the construction of the database. The integration between different sources required steps of processing, filtering, and identifier matching, which may introduce residual errors or information loss. Furthermore, the exclusion of companies with low liquidity or incomplete data may generate selection bias, favoring larger, more consolidated companies with greater market coverage, which may affect the representativeness of the sample.
Another important limitation concerns the nature of the accounting data used. Financial statements reflect historical information and are subject to different accounting practices, revisions, and possible distortions. Although treatments have been carried out to ensure consistency, the indicators derived from this information may not fully capture broader economic aspects, such as governance quality, intangible assets, competitive positioning, or future growth expectations, which are often relevant for market pricing (Penman, 2013).
Additionally, the choice of explanatory variables, although based on literature and data availability, is not exhaustive. Potentially relevant variables, such as market metrics, corporate governance indicators, analyst coverage, ownership structure, and growth expectations, were not included. Consequently, part of the observed variation in the P/B ratio may be associated with factors not captured by the model.
From a methodological point of view, the models used present high predictive capacity, but also a risk of overfitting, especially in contexts with multiple variables and complex interactions (Hastie et al., 2009). Although strategies such as temporal validation and out-of-sample testing have been adopted, the results indicate relevant differences between training and testing performance, suggesting that part of the learned pattern may not generalize completely to new data.
Another important limitation is related to the interpretation of results via SHAP. Although the method allows decomposing predictions into individual contributions of variables, these contributions are associative in nature and not causal (Lundberg and Lee, 2017). In other words, the results indicate which variables are relevant for the model’s prediction, but they do not allow us to state that changes in these variables would cause direct changes in market valuation. This distinction is particularly important in financial contexts, where multiple factors interact simultaneously.
Furthermore, the adopted approach treats observations primarily as independent instances for predictive purposes, without explicitly exploring the panel data structure. Unlike traditional econometric models, which allow for controlling fixed effects and unobserved heterogeneity across firms and over time, the machine learning models used do not directly incorporate these structures, which may limit the interpretation of results in terms of temporal dynamics or structural differences between firms.
Finally, the dependent variable used (P/E) represents only one of the possible valuation metrics. Although widely used, it has known limitations, especially in sectors intensive in intangible assets or in companies with specific accounting structures. Damodaran (2012) highlights that multiples based on book value may not adequately capture the economic value of companies with a strong presence of intangible assets, which can affect the interpretation of the results. Therefore, the results should be interpreted as valid within the context of this specific metric, not necessarily generalizable to other market multiples.
In summary, the results of this study indicated that machine learning models, particularly those based on boosting, showed superior performance in explaining the Price-to-Book Value relationship of Brazilian companies, outperforming Random Forest. It was observed that the relationship between accounting fundamentals and market valuation is not strictly linear, being better captured by complex interactions. Profitability variables, such as earnings per share, return on assets, and return on equity, emerged as the main explanatory factors, although their effects proved to be contextual and not uniform, as evidenced by the non-linear behavior of earnings per share. SHAP analysis revealed a hierarchy of variable importance distinct from linear correlation, reinforcing the ability of non-linear models to capture more sophisticated patterns. Additionally, the Selic rate and the sector of activity also contributed to understanding pricing, suggesting that the macrofinancial environment and sectoral characteristics are relevant. These findings demonstrate the potential of machine learning, combined with interpretability techniques, to offer more transparent insights into valuation dynamics in the Brazilian stock market.
4. Conclusion
This study aimed to evaluate the ability of machine learning models to explain the Price-to-Book Value (P/BV) ratio of Brazilian companies listed on B3. It was found that ensemble models based on boosting, such as XGBoost and LightGBM, showed superior performance in explaining P/BV compared to Random Forest, indicating that the relationship between accounting fundamentals and market valuation does not manifest in a strictly linear fashion. Interpretability analysis via Shapley Additive Explanations (SHAP) revealed that profitability variables, such as earnings per share (EPS), return on assets (ROA), and return on equity (ROE), occupied central positions in explaining P/BV. However, it was observed that EPS exhibited a nonlinear and directional behavior distinct from traditional financial interpretation, suggesting that the market incorporates a more complex valuation structure that goes beyond current earnings. Additionally, the Selic rate and the industry sector also contributed significantly to understanding pricing. The study’s main contribution lies in demonstrating that machine learning, combined with interpretability techniques, offers more transparent and in-depth insights into the valuation dynamics in the Brazilian stock market, by capturing complex and nonlinear relationships that traditional approaches often overlook.
Despite the relevant findings, the study has limitations that deserve consideration. The temporal scope of the sample (2020-2025), marked by atypical events such as the COVID-19 pandemic, and the exclusion of companies with low liquidity, may affect the generalization of the results. The historical nature of accounting data and the non-inclusion of variables such as market metrics or corporate governance indicators represent other restrictions. From a methodological standpoint, although the models exhibit high predictive capacity, a risk of overfitting was noted, and the SHAP contributions are associative in nature, not causal, in addition to not explicitly exploring the panel data structure. The P/B ratio, although widely used, has limitations in sectors with many intangible assets. For future studies, it is suggested to expand the temporal horizon of the sample, include a more comprehensive set of explanatory variables, such as intangible assets and growth expectations, and explore models that explicitly incorporate the panel data structure. It is also recommended to apply this methodology to other valuation metrics to verify the robustness of the results and deepen the understanding of asset pricing in different contexts.
Bibliographic References
Damodaran, A. 2012. Investment Valuation: Tools and Techniques for Determining the Value of Any Asset. 3ed. John Wiley & Sons, Hoboken, NJ, USA.
Ghashami, F.; Kamyar, K. 2021. Performance evaluation of ANFIS and GA-ANFIS for predicting stock market indices. International Journal of Economics and Finance 13(7): 1-6.
Jacques, K.S.; Cunha, M.F.; Fernandes, V.D.C.; Queiroz, L.M. 2021. Qual é o valor da empresa? O caso de valuation da empresa Magazine Luiza. Revista Ambiente Contábil 13(1): 359-377.
Lima, M.V.A.; Lima, M.A.; Pereira, M.F. 2011.
Moutinho, R.A.; Ambrozini, M.A.; Magnani, V.M. 2019. Análise do impacto do fluxo de caixa livre sobre o retorno acionário das companhias de capital aberto no mercado acionário brasileiro. Revista Mineira de Contabilidade 20(2): 55-69.
Tavares, A.L.; Silva, C.A.T. 2012. A análise financeira fundamentalista na previsão de melhores e piores alternativas de investimento. Revista Universo Contábil 8(1): 37-52.
Article originating from the Course Conclusion Work of the Specialization in Data Science and Analytics of the MBA USP/Esalq
To learn more about the course, click here and access the MBX Academy platform