
Strategy
Business Management
Innovation
August 07, 2023
The importance of economic viability in the performance of “startups”
DOI: 10.22167/2675-6528-20230032
E&S 2023,4: e20230032
Thays Alessandra Barreto; Andréa Ferraz de Arruda Fernandez
This has been the century of “startups”, companies that deliver something new — like a technology or an application — under conditions of uncertainty generated by their respective business models[1]. Examples include the offering of a disruptive technology for an existing market (like iFood and “delivery”); a new way of doing something common (like Uber for urban mobility), or even an initiative that requires the creation of a new market (like space tourism “startups”).
According to data from the “StartupBase” platform, there are more than 14,000 active “startups” from various sectors in Brazil[2]. In a period of global pandemic crisis, “startup” entrepreneurs showed how it is possible to adapt and prosper in times of even greater uncertainty, attracting, in 2021 alone, enough attention to accumulate US$ 10 billion in “venture capital” investments. As a result, the sector’s development resulted in a 42.83% growth in investments over the last four years[3].
With some time (and money) these companies grow, acquire stability, and cease to be “startups”. In the middle of the road are the unicorns, “startups” that have reached a market value exceeding US$ 1 billion. Brazil is the tenth country in number of unicorns, with companies such as QuintoAndar, C6 Bank, Loggi, and Movile (owner of iFood)[4].
However, to become a unicorn or achieve stability, entrepreneurs need to overcome a series of obstacles and avoid what can be called the “valley of death”, a moment when the “startup” needs to spend more than it has in revenue to develop and test its product until it finds the ideal model for the market[1]. In this early stage of life, business models are still very flexible and need to be adjusted according to market response to each test.
The scarce market adoption data, which may even be new, make projections difficult, leaving many decisions to entrepreneurs’ intuition; and the founders’ limited knowledge of finance, who are usually technical professionals and specialists in the product itself, hinders an evaluation of the business model’s viability, as well as its healthy maintenance. These obstacles could be mitigated, were it not for the absence of a standardized financial analysis model that could serve as a reference for these companies’ finances, which, unlike traditional small businesses, deal with more variables than data[5].
Poor financial planning, from pricing to cash flow, is one of the main causes of startup failure. According to a CBInsights survey, 38% of startups that fail do so for financial reasons[6]; according to Skynova, the cause of failure for 44% of startups that closed in 2022 was burning through all available cash[7].
To try to reduce such risks, a case study was conducted on a “startup” in the aerospace sector, in the “new space” model[8], which would use the sector’s existing ecosystem to offer aerial imagery to clients nationwide. The objective of the study was to analyze the financial viability of the business model according to research and estimates presented by the founders and, with this, create a prototype that they could adapt according to market dynamics, allowing them to always have updated data and projections on the company’s financial performance at hand.
The study was conducted based on documentary research and on information and quotes made and provided by the founders themselves. It was also considered that the company would be registered as a Simple Innovation Company (Inova Simples), a new category defined to boost the development of innovation companies across the country, with a simplified tax and administrative regime.
It would be necessary to inject approximately R$ 3,000.00 by the founders for the company’s opening, and another R$ 400,000.00 from an angel investor, in both cases, under a minimum attractiveness rate (TMA) of 20% per year. With this information, financial projections were produced for six years of operation, in three scenarios: optimistic, moderate, and pessimistic. The situations were defined based on the founders’ expectations regarding the volume of services each year.
All costs and expenses were mapped and, based on them, pricing and profit were defined by the entrepreneurs. These values were recorded as “inputs” for the model used in the development of this analysis, which took into account nominal values adjusted by the Broad Consumer Price Index (IPCA).
Based on expert analyses[5],[9], the performance evaluation was carried out according to seven indicators: “breakeven”; economic breakeven point (EBE); simple “payback”; discounted “payback”; net present value (NPV); internal rate of return (IRR); and modified internal rate of return (MIRR). The defined viability conditions were: that the “breakeven”, the EBE, the simple “payback” and the discounted “payback” occurred within the evaluated period (six years); that the NPV at the end of the period was positive; and that the IRR and MIRR assumed values greater than the MARR at the end of the period.
The net profit projection over the period, presented in Figure 1, allowed us to observe the effect of the scenarios on the startup’s “breakeven”. Although the company was able to reach “breakeven” within the stipulated six-year timeframe in all scenarios, the sooner it occurred, the more attractive the company would become to investors and, therefore, the faster it would gain autonomy, with positive cash flow from the services offered. This means that, although the pessimistic scenario still passed in this indicator, the optimistic and moderate scenarios proved more attractive.

Figure 1. “Breakeven” forecast: fourth year in the optimistic scenario, fourth year in the moderate scenario, and fifth year in the pessimistic scenario
Source: Original research results.
The J-shaped curve format is common to “startups”. It is due to the “valley of death”, as, in the early life of a “startup”, expenses are limited by restricted cash, and investments are directed towards proof of concepts (POCs) and minimum viable products (MVPs). After the business model is defined, investment in customer acquisition and growth intensifies, resulting in larger negative balances. Finally, in a third phase, there is accelerated growth, with increasingly larger positive numbers, consistent with the exponential growth of technology companies[5]. Thus, it is possible to observe that the value of “startups” lies in the long term, as they are exponential growth companies, with very low returns at the beginning of their life, but with the potential to gain traction and result in great returns for investors. This causes such losses to be significant in the early years, followed by expressive gains and exponential growth.
Achieving profits after “breakeven” indicates that the company has growth potential and that, at some point, it will be possible to recover the invested money. With the results obtained in each scenario, it would be possible to recover the invested money (simple “payback”) in the fourth year in the optimistic and moderate scenarios, and in the fifth year in the pessimistic scenario. On the other hand, considering the variation in the time value of money (discounted “payback”), the investment would still be recovered in the fourth year in the optimistic scenario and would start to be recovered in the fifth year in the moderate scenario, while, in the pessimistic scenario, its recovery would be unfeasible. In this indicator, only the optimistic and moderate scenarios proved viable.
Additionally, besides recovering the investments made within the deadline, it would be necessary for the company to generate sufficient revenue to guarantee the 20% annual return agreed upon between the founders and the investor through the IRR, meaning it would need to reach the PEE. Comparing the variation of the PEE over the period to the gross revenues of the three scenarios, whose variations are shown in Figure 2, it was possible to observe that the PEE would be reached in the third year in the optimistic and moderate scenarios, and in the fourth year in the pessimistic scenario, within the stipulated deadline—which, although it does not invalidate it, makes it the worst of the options.

Figure 2. Economic Break-even Point
Source: Original research results.
With this, based on the company’s result at the end of the sixth year, it would be possible to return to the investor the investment made plus the accumulated return of 20% per year in the optimistic and moderate scenarios only. This is what the operating cash flow result at the end of the period showed, presented in Table 1, which allowed us to observe that the money remaining in cash at the end of the period for the optimistic and moderate scenarios would be sufficient to reimburse the investments and still maintain some value to continue with the company’s operations. On the other hand, the pessimistic scenario would make such a movement unfeasible, resulting in losses for the company, which again made it an unfavorable scenario.
Table 1. Operating cash flow results as of period end
| Scenario | Value (BRL) | ||||||||
| Optimistic | 4.514.868,63 | ||||||||
| Moderate | 1.480.996,10 | ||||||||
| Pessimist | 225.377,54 |
Presented in Figure 3, the cash flow analysis, which accounts for all inflows and outflows, indicated satisfactory performance in the optimistic and moderate scenarios, with a positive balance throughout the period. On the other hand, in the pessimistic scenario, the flow would become negative for a brief period.
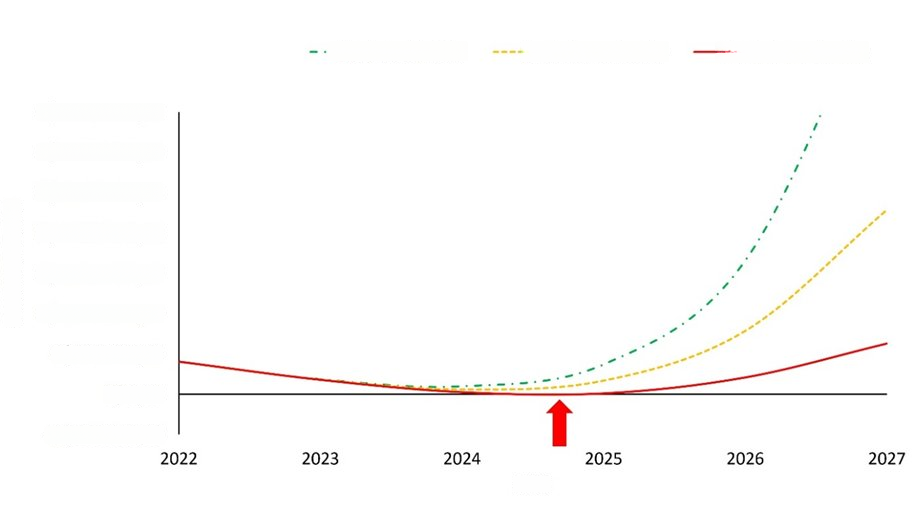
Figure 3. Cash flow over the period
Source: Original research results.
Note: The red arrow highlights the negative cash flow period of the pessimistic scenario
When analyzing the operating cash flow in the absence of investment, presented in Figure 4, it was possible to visualize another J-curve, now with a much longer period of negative balance. Comparing it with the performance of cash flow with investment, it was noted that the latter would be essential for reducing the company’s debts during the period. The investment would also be essential for financing mechanisms that would enable the company to gain market share, increasing the volume of services performed in the magnitude of projections, such as hiring and marketing investment.
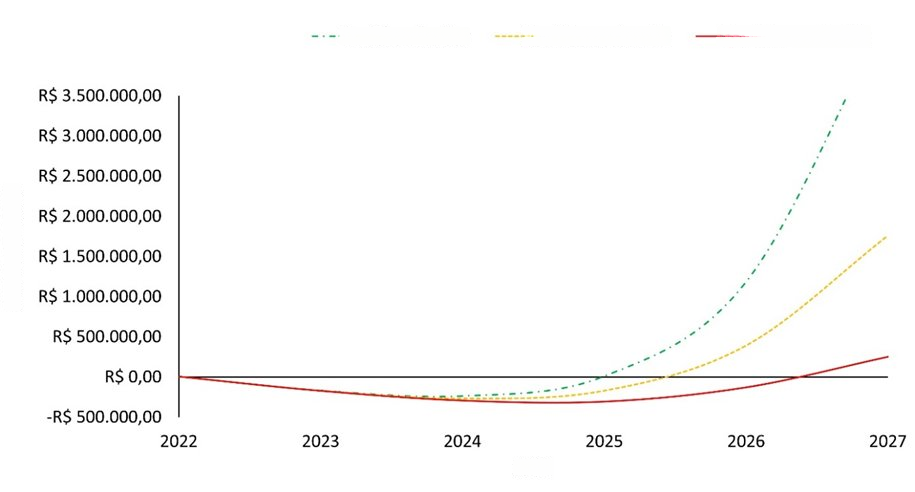
Figure 4. Cash flow without investment
Source: Original research results.
Finally, regarding the NPV, IRR, and MIRR indicators, whose obtained results are shown in Table 2, it was possible to observe the maintenance of the behaviors observed in the other indicators. The optimistic and moderate scenarios presented good operating conditions, while the pessimistic scenario proved inadequate and should be avoided by entrepreneurs.
Table 2. Values obtained for the other indicators
| Scenario | NPV (BRL) | Internal Rate of Return (IRR) (%) | IRR (%) |
| Optimistic | 1.271.732,04 | 140,28 | 79,07 |
| Moderate | 176.690,94 | 79,18 | 47,54 |
| Pessimist | -434.253,44 | 15,17 | 10,92 |
From the analyses performed, summarized in Table 3, it was concluded that the proposed business model for the “startup” would be viable, provided that the commercial goals involved the volume of services necessary to maintain, at a minimum, the moderate scenario. The entrepreneurs should avoid the pessimistic scenario at all costs, making the necessary adjustments to the business model or cost structure so that at least the moderate scenario is achieved.
Table 3. Summary of the results obtained
| Indicator | Optimistic scenario | Moderate scenario | Pessimistic scenario |
| “Breakeven” (years) | 4 | 4 | 5 |
| PEE (years) | 3 | 3 | 4 |
| Simple “Payback” (years) | 4 | 4 | 5 |
| “Payback” discounted (years) | 4 | 5 | >6 |
| NPV (BRL) | 1.272.732,04 | 176.690,94 | -434.253,44 |
| IRR (%) | 140,28 | 79,18 | 15,17 |
| MIRR (%) | 79,07 | 47,54 | 10,92 |
The proposed angel investment would be essential to give the company momentum and help it gain market share to seek the necessary volume of services. The prices, costs, and contribution margins from the study would allow the “startup” to operate, and improvements in these values would positively affect its performance, resulting in more profit, as well as earlier breakeven and payback. The entrepreneurs could update the projection made so that it became increasingly faithful to reality, providing more precise information to support strategic decisions.
Similar studies had already been conducted for startups operating in different sectors, such as education[10], law[11], civil construction[12], software development[13], and agriculture[14], indicating that, although the conditions of each sector and business model are different, indicators such as NPV, IRR, ROI, MIRR, and payback are well-established ways to support economic-financial feasibility studies, even in startups. However, the complexity of business models and the inherent uncertainties in each company’s specific market create a scenario where the development of a customized projection model is necessary, the challenge of which lies in defining the premises and projecting revenue.
Once the projection and analysis model is developed, the “startup” management has a valuable source of information at hand for project alignment, as well as an analysis of investments and the company’s sensitivity to various market factors, such as suppliers, customers, and taxes[10],[11],[14]. The information provided by the methodology used in this study is valuable for “startups” at any stage, as it allows founders to assess the impact of variables on company performance, ensuring greater basis for pricing and for bargaining with suppliers and customers, in the search for scenarios that are even more adequate and strategic than those presented here.
References
[1] Ries E. A startup enxuta: como os empreendedores atuais utilizam a inovação contínua para criar empresas extremamente bem-sucedidas. 1ed. São Paulo (SP): Lua de Papel. 2012.
[2] AbStartups. 2023. Disponível em: <https://abstartups.com.br/>.
[3] Distrito. Retrospectiva do ecossistema de inovação 2022. 2023. Disponível em: <https://distrito.me/blog/retrospectiva-do-ecossistema-de-inovacao-2022-distrito/>.
[4] Lima M. Unicórnios brasileiros: saiba quais são e o que fazem. Forbes Brasil. 2022. Disponível em: <https://forbes.com.br/forbes-money/2022/07/unicornios-brasileiros-saiba-quais-sao-e-o-que-fazem/>.
[5] Losada B. Finanças para Startups: O essencial para empreender, liderar e investir em startups. 1ed. São Paulo (SP): Editora Saint Paul. 2020.
[6] CB Insights. Why Startups Fail: Top 12 Reasons. CB Insights Research Report. 2021. Disponível em: <https://www.cbinsights.com/research/report/startup-failure-reasons-top/>.
[7] Skynova. Top Reasons Startups Failed in 2022. 2023. Disponível em: <https://www.skynova.com/blog/top-reasons-startups-fail>.
[8] Vellasco F.M.M. O desenvolvimento da indústria espacial brasileira: uma abordagem institucional [Dissertação de mestrado]. Brasília (DF): Escola Nacional de Administração Pública (ENAP); 2019.
[9] Silva Junior R.G. (org.). Empreendedorismo tecnológico. 1ed. Curitiba (PR): Instituto de Engenharia do Paraná. 2009.
[10] Andrade L.C.; Rodrigues M.V.; Lima I.A.; Melo K.S.; Lima N.G.F. Análise da viabilidade econômico-financeira de uma startup atuante no mercado de educação. In: Anais do XXXIX Encontro Nacional de Engenharia de Produção; 2019; Santos, SP, Brasil.
[11] Arruda B.V.M. Geração do modelo de negócio, validação e análise de viabilidade econômico-financeira de uma startup no setor lawtech [Trabalho de conclusão de curso]. Fortaleza (CE): Universidade Federal do Ceará; 2017.
[12] Longen J.V.P.; Pereira G.H.; Ryba A.; Silva Junior R.G. Viabilidade de uma startup baseada em economia colaborativa. Revista Gestão & Conexões. 2019; 8(1): 24-42. DOI: 10.13071/regec.2317-5087.2014.8.1.21887.24-42.
[13] Massari J.A. Viabilidade mercadológica e econômico-financeira: implementação de uma startup no ramo de softwares para academias de ginástica [Trabalho de conclusão de curso]. Medianeira (PR): Universidade Tecnológica Federal do Paraná; 2016.
[14] Valdo N.N.; Gonzaga V.H.; Lemes L.; Carrer C.C. Viabilidade econômica de uma startup agtech. In: Anais do Fórum Internacional On-line de Empreendedorismo e Inovação no Agro; 2020.
Como citar
Barreto T.A.; Fernandez A.F.A. A importância da viabilidade econômica no desempenho de startups. Revista E&S. 2023; 4: e20230032.
Sobre os autores
Thays Alessandra Barreto, Universidade de São Paulo – Departamento de Engenharia de Materiais
Andréa Ferraz de Arruda Fernandez, Professora Orientadora, Pecege – Rua Cezira Giovanoni Moretti, 580, Bairro Santa Rosa, Piracicaba, SP – 13.414-157.
Link para download: https://cms.revistaes.com.br/wp-content/uploads/2023/08/ES_23032.pdf