
November 29, 2024
Application of a machine learning model to predict school dropout
DOI: 10.22167/2675-6528-20240030
E&S 2024, 5: e202400030
Tibério Morais Silva Júnior e José Erasmo Silva
In an ideal academic training model, all students enrolled in educational institutions would achieve the goal of completing the course within the established timeframe. However, in reality, several interferences arise in the educational process, such as dropout and withdrawal. Such phenomena are frequently categorized by researchers as evasion[1].
Despite this association, some scholars on the subject, such as Tinto[2], state that there is a misalignment regarding what could actually be defined as evasion, suggesting that: 1) there is no consensus on the definition of the term evasion; 2) that this definition may even be altered depending on the individual, institutional, or state contexts.
According to Silva et al.[1], school dropout has negative consequences for both the student and the educational institution. From the student’s perspective, dropout not only postpones their education but also results in financial and time losses, resources that could be directed to other activities. For the institution, dropout compromises its efficiency, as the vacancy and resources — both physical and technological — previously allocated for a certain number of students become underutilized.
Glavam and Cruz[3] highlight that dropout brings significant disturbances to students, educational institutions, and companies seeking specialized labor. For educational institutions, dropout directly impacts financial health, as, when planning a course, associated costs are projected based on the number of enrollments.
Dropout results in a decrease in projected revenue, potentially culminating in financial deficits at the end of the course. In the business context, dropout increases the shortage of qualified professionals, raising costs and delivery times for products. Furthermore, dropout compromises students’ quality of life, reflecting in precarious jobs and reduced salaries, and reverberates in families, which often rely on this income to meet their monthly expenses.
Dropout in vocational education courses is a topic that, despite its relevance, presents a notable scarcity of published works. This modality of teaching, with its peculiar characteristics, often involves students who are simultaneously enrolled in other educational institutions or have work commitments, thus limiting their dedication to the vocational course. Such particularities reinforce the importance of this work and the choice of the institution defined as the object of study, an entity that is a reference in apprentice training and professional qualification. The institution is private, but non-profit, and was founded in 1947 in Bahia and, subsequently, in Vitória da Conquista.
To deepen the understanding of the causes of dropout, many researchers resort to advanced machine learning techniques, which aim to identify the most influential variables in the dropout phenomenon, thus enabling the implementation of prevention measures. For example, Primão[4] and Chung and Lee[5] investigated, respectively, dropout in different educational contexts using techniques such as Decision Trees, Artificial Neural Networks, and XGBoost. Silva et al.[1], in turn, focused on distance undergraduate courses in Brazil, employing the Binary Logistic Regression model.
Thus, the combination of an in-depth analysis of the characteristics of vocational courses with advanced data analysis techniques can offer important insights into dropout rates and potential mitigation strategies.
Given the context, the objective of this study is to apply a machine learning model, specifically Binary Logistic Regression, to predict school dropout. This will make it possible not only to anticipate actions to minimize dropout but also to analyze the factors associated with it in the professional education courses offered by the institution studied, in Vitória da Conquista (BA). The sample used in this study was provided by the institution’s Information Technology management. The database provided is in .xlsx format, containing 2,599 observations and 21 variables. Students’ personal data, such as CPF, name, affiliation, among others, were omitted. The database consists of information collected during the enrollment process in the face-to-face professional education courses offered by the entity between 2019 and 2023. The variables that make up this database are presented in Table 1.
Table 1. Variables used in the study
| Variable | Description |
| DateOfBirth | Date of birth (date) |
| HasDisability | Binary indicator of deficiency (categorical) |
| NameDisability | Name of the deficiency, if applicable (categorical) |
| FamilyPosition | Family position (dependent or not) |
| NumberOfPeopleInTheFamilyGroup | Number of people in the family (numeric) |
| GrossFamilyIncome | Family gross income (numerical) |
| PerCapitaIncome | Per capita income (numerical) |
| HasEmploymentRelationship | Binary indicator of employment relationship (categorical) |
| WhyDoesntItWork | Reason for not working (8 categories) |
| Economic Activity | Economic activity in which one works (46 categories) |
| LinkType | Type of bond (7 categories) |
| ElementarySchoolInstitutionType | Public or private type (categorical) |
| HighSchoolEducationInstitutionType | Public or private type (categorical) |
| EnrolledInBasicEducation | Binary enrollment indicator (categorical) |
| AlumnusInLearningProgram | Alumnus yes or no (categorical) |
| Graduate in Basic Education | Alumnus yes or no (categorical) |
| EnrollmentStatus | Dependent variable (initially 8 categories) |
| City | City (34 categories) |
| Scholarship | Education level (categorical) |
| Class Name | Class name / course (categorical) |
| ClassPeriodInMonths | Course duration in months (numeric) |
When initially analyzing the “enrollment status” variable, eight categories are identified that describe the student’s situation in relation to the course. These are: approved, dropout, in process, dropout, canceled enrollment, enrolled, failed, and internal transfer of the same title. The “approved” status is assigned to the student who attended the course with an absence percentage less than or equal to 25% of the total classes and passed the skills and competencies assessments. “Dropout” and “canceled enrollment” refer to students who enrolled but did not attend any classes. The term “dropout” is used when a student enrolls, attends at least one class, but does not continue the course. “Failed” is the status for those who did not pass the assessments or had an absence rate higher than 25% of the total classes. The statuses “enrolled” and “in process” indicate that the student still has an active enrollment in the course or has already completed it, being in the administrative closing phase. Finally, “internal transfer of the same title” is the category for students who requested a change to another class of the same course.
Despite the lack of consensus in the literature on the exact definition of the term dropout, for this work, following the guidelines of the management of the institution studied, a student who registered at least one attendance during the course and, for some reason, interrupted their attendance was considered a dropout. Thus, any student with the status “dropout” in the variable “enrollment status” is understood as a dropout. To analyze the database and estimate the probability of dropout, the Binary Logistic Regression Model was used, included in the set of generalized linear models in which the dependent variable is qualitative binary, with at most two categories. According to Fávero and Belfiore[6], in this model the dependent variable (dropout) follows a Bernoulli distribution, whose probability of occurrence of an event is , and the probability of occurrence of a non-event is . This aims to estimate the probability of occurrence of an event defined by Y, which is shown in a dichotomous qualitative form, where Y = 1 represents the occurrence of the event, and Y = 0, the occurrence of the non-event. The vector of explanatory variables of this model can be defined according to eq.(1):

where Z is denoted as logit, α is a constant, βj (1, 2, …, k) are the estimated parameters of the explanatory variable Xj (metrics or dummy variables) and the subscript i represents each observation in the database. In the same context, the author describes that the estimated probability of a certain event occurring can be defined by eq.(2).

When analyzing the dependent variable (dichotomous) in a binary logistic regression model, it becomes evident that the estimation of the probability equation parameters cannot be performed in the same way as in conventional linear regression techniques, as the latter estimate their parameters by the Ordinary Least Squares (OLS) method. The difference arises because, when studying the probability of an event occurring with a qualitative response variable, the model cannot calculate the mean or variance. Thus, it cannot minimize the sum of error terms without arbitrary weighting. Therefore, to estimate the parameters of a probability equation in the logistic regression model, the logarithm of the log likelihood function is used. For this function, values approaching zero indicate a greater model accuracy[6].
Through Table 2, it is possible to observe that the category “approved” represented a large portion of the total occurrences.
Table 2. Frequency of the categories of the Enrollment Status variable
| EEnrollment Status | Observations | Percentage (%) |
| Approved | 1450 | 55,79 |
| Enrollment canceled | 112 | 4,31 |
| Failed | 202 | 7,77 |
| In process | 397 | 15,28 |
| Enrolled | 92 | 3,54 |
| Quitter | 99 | 3,81 |
| Evaded | 215 | 8,27 |
| Internal transfer same title | 32 | 1,23 |
| Sum | 2599 | 100 |
When added to the other categories representing the occurrence of the non-event (students who did not drop out) and compared with the total occurrences of the event (dropout), it is possible to note that these data are unbalanced. Although unbalanced data are not a problem for binary logistic regression, it is necessary to take this into consideration when interpreting the results. Analyzing the type of professional link, it is possible to perceive that the majority of students who completed the enrollment did not provide data related to this variable. Among those who chose a category, the information “employed with a formal contract” stands out (Table 3).
Table 3. Frequency of categories of the variable “type of link”
| Link type | Observations | Percentage (%) |
| Autonomous | 150 | 5,77 |
| Salaried employee | 798 | 30,70 |
| Employee without a signed work card | 120 | 4,62 |
| Public servant | 32 | 1,23 |
| Not informed | 1404 | 54,02 |
| Others | 93 | 3,58 |
| Liberal professional | 2 | 0,08 |
| Total sales (vendas)/ Invoicing (emissão de doc) | 2599 | 100 |
When analyzing the students’ educational level, it is understood that many had not yet completed higher education, it being a sample formed mostly by students who had completed or were still attending high school (Table 4).
Table 4. Frequency of the categories of the variable “educational attainment”
| Schooling | Observations | Percentage (%) |
| Complete elementary education | 92 | 3,54 |
| Elementary school in progress | 66 | 2,54 |
| Incomplete elementary education | 62 | 2,39 |
| Completed high school | 1302 | 50,10 |
| High school student | 617 | 23,74 |
| Incomplete high school education | 149 | 5,73 |
| Completed undergraduate degree | 97 | 3,73 |
| Undergraduate degree in progress | 64 | 2,46 |
| Incomplete undergraduate degree | 27 | 1,04 |
| Completed technical secondary education | 18 | 0,69 |
| Mid-level technician pursuing | 43 | 1,65 |
| Incomplete technical secondary education | 6 | 0,23 |
| Not filled | 56 | 2,15 |
| Total sales (vendas)/ Invoicing (emissão de doc) | 2599 | 100 |
Professional learning courses, often referred to as the Young Apprentice Program, predominate in terms of enrollment numbers, standing out as the main attractions for students (Table 5). Notably, the Administrative Assistant and Eyebrow Design courses are exceptions, being the only ones in this category to present a high number of enrollments.
Table 5. Frequency of the categories of the variable NomeTurma
| ClassName (course) | Observations | Percentage (%) |
| Small business administration | 10 | 0,38 |
| Database administrator | 19 | 0,73 |
| Women’s tailoring | 6 | 0,23 |
| Professional commercial training in Administrative services | 226 | 8,70 |
| Professional commercial training in supermarket services | 63 | 2,42 |
| Professional qualification training in administrative services | 595 | 22,89 |
| Professional qualification training in supermarket services | 219 | 8,43 |
| Administrative assistant | 291 | 11,20 |
| Cut and brush update | 11 | 0,42 |
| Professional update for housekeeper | 1 | 0,04 |
| Kitchen assistant | 16 | 0,62 |
| Artistic cakes | 48 | 1,85 |
| Hairdresser | 8 | 0,31 |
| Coloring, bleaching, highlights and streaks | 10 | 0,38 |
| Tourism driver – culture, ecotourism and itineraries | 30 | 1,15 |
| Confectioner | 11 | 0,42 |
| Seamster | 110 | 4,23 |
| Cook | 3 | 0,12 |
| Elderly caregiver | 61 | 2,35 |
| Leadership Development | 21 | 0,81 |
| Eyebrow design | 246 | 9,47 |
| Selling price formation | 16 | 0,62 |
| Financial management for microenterprise | 15 | 0,58 |
| Manicure and pedicure | 148 | 5,69 |
| Makeup artist | 14 | 0,54 |
| Digital Marketing | 47 | 1,81 |
| Basic Modeling for Apparel | 2 | 0,08 |
| Modeling and making of children’s clothing | 6 | 0,23 |
| Preparation of traditional cakes | 12 | 0,46 |
| Snack maker | 82 | 3,16 |
| Arrangement techniques for housing units on commemorative dates | 6 | 0,23 |
| Sewing and finishing techniques | 19 | 0,73 |
| Hair removal techniques | 25 | 0,96 |
| Computer Graphics Technician | 18 | 0,69 |
| Aesthetic Technician | 29 | 1,12 |
| Event technician | 31 | 1,19 |
| Logistics Technician | 31 | 1,19 |
| Massotherapy Technician | 23 | 0,88 |
| Podiatry Technician | 16 | 0,62 |
| Hairstyle trends | 12 | 0,46 |
| Fiber nails | 22 | 0,85 |
| Gel nails | 16 | 0,62 |
| 3D decorated nails | 4 | 0,15 |
| Sum | 2599 | 100 |
In a more detailed analysis of the geographical origins of students enrolled in the institution’s courses, the presence of students from 34 different cities was identified. The Southwest region of Bahia stood out, especially the city of Vitória da Conquista, which alone accounted for 1,417 of these enrollments.
Table 6. Frequency of the categories of the variable City
| City | Observations | Percentage (%) |
| Anagé | 5 | 0,19 |
| Aracatu | 108 | 4,1 |
| Barra da Estiva | 14 | 0,54 |
| Barra do Choça | 3 | 0,12 |
| Beautiful Field | 66 | 2,54 |
| Brumado | 238 | 9,16 |
| Caatiba | 1 | 0,04 |
| Candiba | 183 | 7,04 |
| Ceraima | 1 | 0,04 |
| Cruz das Almas | 1 | 0,04 |
| Érico Cardoso | 3 | 0,12 |
| Forestry | 1 | 0,04 |
| Gongogi | 24 | 0,92 |
| Guanambi | 210 | 8,08 |
| Ibicoara | 1 | 0,04 |
| Igaporã | 75 | 2,89 |
| Iguá | 6 | 0,23 |
| Ituaçu | 13 | 0,50 |
| Jaicós | 2 | 0,08 |
| Jequié | 198 | 7,62 |
| Macaúbas | 5 | 0,19 |
| Raw material | 2 | 0,08 |
| Palmas de Monte Alto | 2 | 0,08 |
| Paramirim | 1 | 0,04 |
| Pestles | 3 | 0,12 |
| Pindaí | 1 | 0,04 |
| Planalto | 2 | 0,08 |
| Pradoso President Jânio Quadros | 7 | 0,27 |
| Salvador | 3 | 0,12 |
| Sebastião Laranjeiras | 1 | 0,04 |
| Tanhaçu | 1 | 0,04 |
| Taperoá | 1 | 0,04 |
| Vitória da Conquista | 1417 | 54,52 |
| Total sales (vendas)/ Invoicing (emissão de doc) | 2599 | 100 |
To represent the occurrence or not of the event, the dichotomous dependent variable “evasion” was created, containing “Y” to represent the existence of the event and “N” for the non-event (Table 7).
Table 7. Dependent variable “dropout ‘N’ (no) or ‘Y’ (yes)”
| N | Y |
| 2384 (91,72%) | 215 (8,27%) |
After analyzing the database, 155 observations were found to be missing complete data for modeling and, therefore, were excluded, leaving 2,444. Furthermore, it should be noted that all categorical variables were transformed into dummy variables. According to Fávero and Belfiore[6], to avoid the error of arbitrary weighting with qualitative variables in binary logistic regression models, the dummy variable technique should be used.
The model named “modelo_evasao” was developed to represent the Logistic Regression implemented using the glm function in RStudio – a free integrated development environment for the R programming language. In this model, “evasão” was determined as the response variable, also specifying the “family” parameter as “binomial”. Table 8 presents the results of this model, highlighting the estimated parameters (“Estimate”) and the statistical significance of the variables after the “stepwise” procedure.
Table 8. GLM model results for prediction and analysis of factors associated with school dropout
| Variables | Assessment | Std. Error | z-value | Pr(>|z|) | Signature |
| (Constant term) | -3,0847 | 0,2814 | -10,961 | <0,00002 | *** |
| economic_activity_not_informed | -0,7009 | 0,2156 | -3,251 | 0,001149 | ** |
| economic_activity_combined_services_writing | 1,2985 | 0,3721 | 3,489 | 0,000484 | *** |
| professional_qualification_learning_in_administrative_services | 1,6137 | 0,2456 | 6,57 | 5.02E-11 | *** |
| professional qualification learning in supermarket services | 1,3105 | 0,3241 | 4,044 | 5.26E-05 | *** |
| administrative_assistant | 1,2894 | 0,2998 | 4,301 | 1.70E-05 | *** |
| elderly caregiver | 1,7612 | 0,4499 | 3,915 | 9.05E-05 | *** |
| Makeup artist | 2,4863 | 0,6818 | 3,646 | 0,000266 | *** |
| event_technician | 2,5269 | 0,475 | 5,32 | 1.04E-07 | *** |
| logistics technician | 2,5535 | 0,4745 | 5,381 | 7.41E-08 | *** |
| massotherapy technician | 2,2275 | 0,5859 | 3,802 | 0,000144 | *** |
Note: *** Significant at the 0.001 level; ** significant at the 0.01 level, * significant at the 0.05 level
After statistical modeling using binary logistic regression, it was observed that the variables “atividadeeconomica_nao_informado” and “atividadeeconomica_servicos_combinados_de_escrito” are statistically significant (Table 8). The variable “atividadeeconomica_nao_informado”, with a negative coefficient, indicates a lower probability of dropout compared to the reference category “atividadeeconomica_atividade_medica_ambulatorial”. In contrast, the variable “atividadeeconomica_servicos_combinados_de_escrito”, with a positive coefficient, suggests a higher probability of dropout among students who engage in this economic activity.
Furthermore, the other significant variables are related to the course name. For example, the category “tecnico_em_logistica” presents a 2.5535 times greater probability of dropout compared to the “administração_de_pequenas_empresas” course, which was used as a reference. This indicates that the type of course chosen by the student can be a determining factor in their probability of dropping out.
Variables that did not show statistical significance were excluded, following the “stepwise” procedure. This decision was made to focus on the variables that truly influence the prediction of school dropout, aligning with the study’s predictive objective. However, it is relevant to mention that the inclusion of non-significant variables, although not predictive, can provide a more comprehensive view of potential influences on the dropout phenomenon, depending on the purpose of the analysis[6].
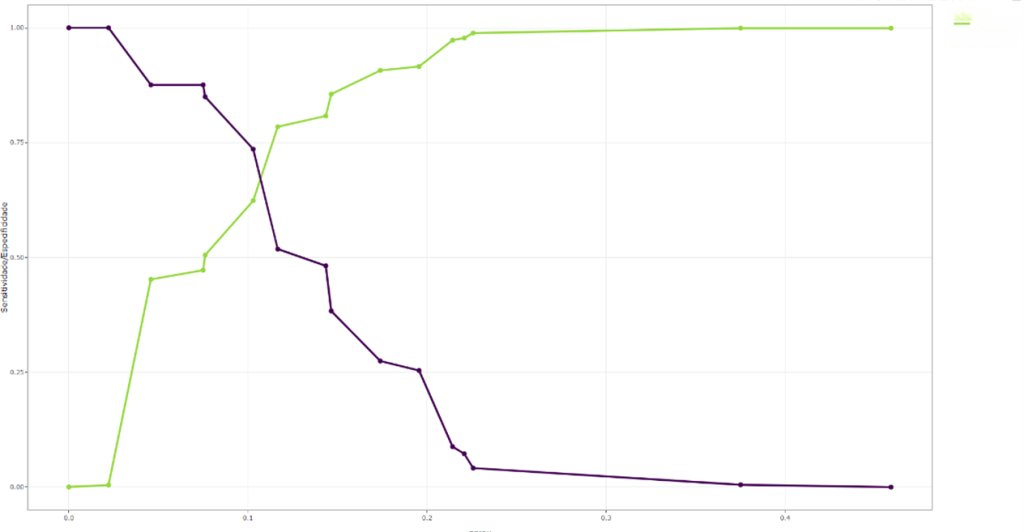
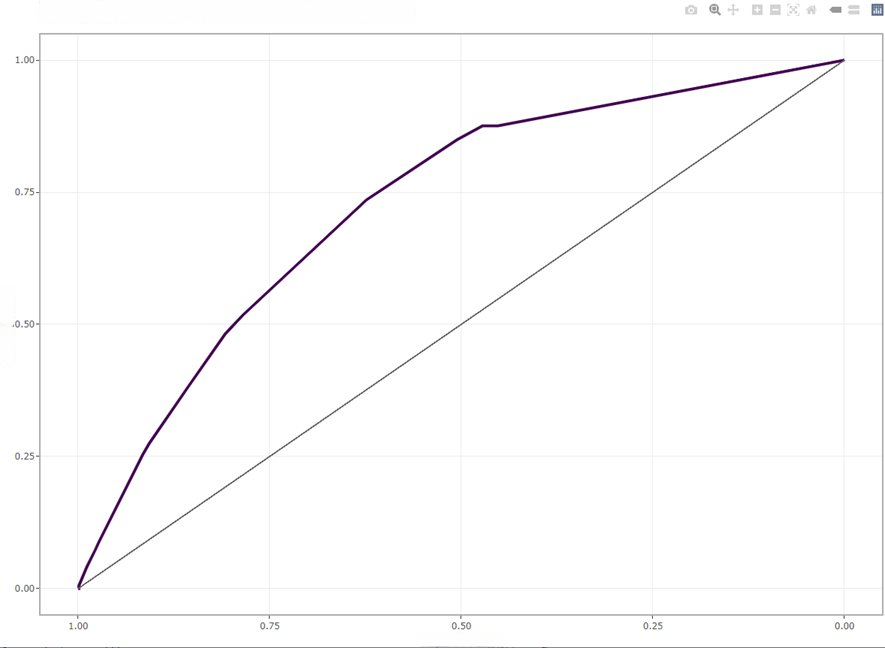
After analyzing the coefficients, it is important to analyze the metrics that validate the predictive power of the model. This analysis was performed using the receiver operating characteristic [ROC] curve, the sensitivity curve, and the specificity curve, in addition to the classification matrix.
When calculating sensitivity and specificity, it is essential to determine the cutoff point, or cutoff, that will be used to classify observations based on the calculation of their probabilities. This is particularly relevant when introducing a new observation into the sample and wanting to predict the probability of that observation being classified as an event or not. Classification occurs when comparing the estimated probability value pi of the new observation with the cutoff value. If pi is greater than the cutoff, the observation will be categorized as an event; if pi is less than the cutoff, it will be categorized as a non-event. The cutoff allows for evaluating the model’s accuracy with the sample observations, ensuring that this accuracy is maintained when predicting the occurrence of an event in new observations.
From Figure 1, it is possible to analyze the sensitivity and specificity curves. Their analysis reveals an optimal cutoff point approximately equal to 0.12, which represents a balance between sensitivity and specificity. It is noteworthy that the specificity curve shows a high hit rate for almost all cutoff values, while the sensitivity curve exhibits the opposite behavior, with the hit rate decreasing significantly for cutoff points above 0.15. It is also observed that the model is well-calibrated to predict the non-event (non-evasion). However, its effectiveness in predicting evasion is less consistent. This suggests that for higher cutoff values, the model tends to make more errors in predicting evasion. This behavior can negatively impact the overall efficiency of the model. Thus, to enhance the model’s ability to predict evasion, it may be beneficial to consider the inclusion of new explanatory variables, as well as using a larger sample.
Source: Original research results.
To visualize and gain a better understanding of this model’s predictive behavior, a classification matrix was generated for a cutoff equal to 0.10. Once again, the predictive capacity of this model in relation to the prediction of the non-event is perceived, with 1,404 correct predictions and only 847 errors. However, the matrix confirms the need to adjust this model when the main objective of its use is to evaluate the occurrence of the event, evasion.
Table 9. Confusion Matrix
| Alternative | True | False |
| True | 142 | 847 |
| False | 51 | 1.404 |
The sensitivity, specificity, and accuracy (overall hit rate of the model) can be obtained from the classification matrix information, in RStudio (Table 10).
Table 10. Confusion Matrix Statistics
| Accuracy | McNemar test P-value | sensitivity | Specificity |
| 0.6326 | < 2 and – 16 | 0.73575 | 0.62372 |
Finally, Figure 2 shows the ROC curve plot. It represents the value of sensitivity against 1-specificity for the model used in this work. Observing the value of the area under the curve equal to 0.728, it is perceived that this model performed reasonably when considering all cutoffs. Thus, for a better performance of this model in relation to the ability to predict the occurrence of the evasion event, the inclusion of new explanatory variables in the model and the prediction of evasion using a multilevel model can be suggested.
Source: Original research results.
This study used data referring to students’ enrollment situations and their respective characteristics. A binary logistic regression model was employed to assess the statistical significance of these variables and the predictive capacity of the model. It was observed that certain variables, both related to the type of economic activity carried out by the student and to the course itself, have a negative or positive correlation with dropout. This suggests that internal policies can be strategically directed at these specific factors.
To evaluate the model’s predictive capacity, metrics such as sensitivity, specificity, sensitivity curve, specificity curve, and ROC curve were used. With a cutoff adjustment at 0.10, the model achieved an accuracy of 0.6326, sensitivity of 0.73575, specificity of 0.62372, and an area under the ROC curve of 0.72. The model proved effective in predicting non-events but less precise in predicting evasion. This behavior is partly due to the imbalance in the dataset. The diversity of categories in the “EstadoMatrícula” variable and the ambiguity of some of them presented challenges in the analysis. In a scenario with a clearer organization of this variable, it is possible that a more robust statistical result could be obtained. Furthermore, the limited number of observations may have negatively impacted the model’s evaluation.
The results presented indicate that economic activities and course types are critical factors in determining school dropout. This knowledge allows the managers of the investigated institution to develop targeted strategies, such as offering additional support to students enrolled in courses with a higher risk of dropout, or creating guidance programs for students whose economic activities indicate a higher probability of abandonment.
Variables such as date of birth, employment status, education level, family income, among others, which did not show statistical significance in the final model, can be investigated in future studies using a larger sample. With a more robust dataset, it is possible that the influence of these variables on school dropout may become more evident, providing additional insights into the factors affecting students’ decisions to continue or abandon their courses.
This study demonstrated that the application of a binary logistic regression model can not only predict school dropout with reasonable accuracy but also identify the main factors contributing to this phenomenon in the professional education courses offered by the institution that was the target of the research. By anticipating these trends, the institution has the opportunity to implement specific preventive actions, potentially reducing the dropout rate and improving educational outcomes.
For future research, it is suggested to conduct a comparative study between the binary logistic regression model, the multinomial logistic model, and XGBoost, in order to evaluate which approach offers better performance in predicting school dropout.
References
[1]Silva, F.C.; Cabral, T.L.O.; Pacheco, A.S.V. 2020. Dropout or permanence? Predictive models for higher education management. Education Policy Analysis Archives 28(149). <https://doi.org/10.14507/epaa.28.5387>.
[2]Tinto, V. 1989. Definir la desercion: Una cuestion de perspectiva. Revista de la Educación Superior. Disponível em: <http://publicaciones.anuies.mx/pdfs/revista/Revista71_S1A3ES.pdf>. Acesso em: 06 jan. 2023.
[3]Glavam, R.B.; Cruz, H.A. 2013. Estudo da Evasão Escolar dos Cursos Profissionalizantes em uma Unidade do Serviço Nacional de Aprendizagem Industrial de Santa Catarina-SENAI. X Simpósio de Excelência em Gestão e Tecnologia. Disponível em:
<https://www.aedb.br/seget/arquivos/artigos13/31818288.pdf>. Acesso em: 06 jan. 2023.
[4]Primão, A.P. 2022. Uso de algoritmos de machine learning para prever a evasão escolar no ensino superior: um estudo no Instituto Federal de Santa Catarina. Dissertação (mestrado profissional) – Universidade Federal de Santa Catarina, Centro Sócio-Econômico, Programa de Pós-Graduação em Administração Universitária, Florianópolis. Disponível em:<https://repositorio.ufsc.br/handle/123456789/238320>. Acesso em: 06 jan. 2023.
[5]Chung, J.Y.; Lee, S. 2019. The Machine Learning-Based Dropout Early Warning System for Improving the Performance of Dropout Prediction. Appl. Sci 9(15) <https://doi.org/10.3390/app9153093>.
[6]Fávero, L.P.; Belfiore, P. 2022. Data analysis manual. LTC, Rio de Janeiro, RJ, Brazil.
How to cite
Silva Júnior T.M.; Silva J.E.; Application of a machine learning model to predict school dropout. Revista E&S. 2024; 5: e20240030.
About the authors
Tibério Morais Silva Júnior – Specialist in Data Science and Analytics. Rua Bruno Bacelar, 261, Alto Maron, Postal Code: 45005-306 – Vitória da Conquista/BA, Brazil
 José Erasmo Silva – Advisor Professor MBA Data Science and Analytics – Federal University of Bahia – Postgraduate Program in Accounting – PPGCONT– Avenida Reitor Miguel Calmon, s/n Canela – CEP: 40231-300 – Salvador/BA, Brazil