
Agribusiness
Challenges
Companies
People Management
Turnover
June 05, 2024
Professional turnover in agribusiness companies: the challenges of people management in the countryside
DOI: 10.22167/2675-6528-20240005
E&S 2024, 5: e20240005
Hilarina Dias de Souza; Alexandre Barreto de Almeida
Given the current and significant professional turnover, known as turnover, which permeates all sectors of the Brazilian economy, especially among young talents[1], companies have been directing their focus towards strategic people management, aiming to attract and retain specialized professionals[2]. Turnover reflects the movement of separations and hirings to replace the workforce, entailing significant costs for organizations, which include expenses with recruitment, selection, training, and the separation costs themselves. Understanding this phenomenon reveals that turnover is influenced by variables external and internal to the company.
Among the external variables are, for example, market supply and demand, economic conditions, and job opportunities. Among the internal variables, organizational structure and climate stand out, factors that determine the dynamics of turnover[2]. Assertive people management is vital in the business world, and the field is no different. Faced with the imminent global demand for greater food production, advances in technology, science, research, and development in the field have been noted. Consequently, the need to find and attract specialized talents has increased. This is a major challenge, accentuated by factors such as rural-urban migration and family succession. Retaining talent in the field becomes even more challenging, especially when it comes to young talents[3].
Just 12 years after reaching the 7 billion inhabitants mark on the planet, and already facing several issues with direct impact on food security, the world population reached the 8 billion mark in 2022. The United Nations (UN) estimates a population of almost 10 billion by 2050 and predicts that global food production will have to increase by 70% to meet this demand[4]. In other words, the demand for agribusiness production still tends to grow considerably.
In a recent study by the Food and Agriculture Organization of the United Nations (FAO), it was concluded that more than half of the world’s population lives in households linked to agri-food systems. The system employs 1.2 billion people worldwide, considering the entire production chain[5]. In Brazil, the agribusiness workforce represented 19.35% of the employed population (EP) in 2022, the highest since 2015. This means that, out of 98.04 million people in the Brazilian labor market, 18.07 million were linked to agribusiness[6].
Brazil has a privileged location and a territory adapted to various types of agriculture, which favors the significant participation of agribusiness in the Brazilian economy, accounting for one-third of the country’s total economic production. In 2021, the sector contributed 27.5% to the Gross Domestic Product (GDP)[7], and 24.8% in 2022[8], in addition to being the most internationalized sector of the economy, responsible for almost half of the country’s total exports[9]. Historically, the country has maintained a prominent position in feeding the world’s population. However, for Brazil to remain among the major global agribusiness players and further expand its market performance, it needs much more than technological evolution and innovation in the field. A major bottleneck lies in people management, especially in the professionalization process of agribusiness, and in greater improvement to deal with innovations in the rural environment.
The present study aimed to investigate the current scenario of turnover in the field and the impact of strategies employed to attract and retain talent. Employing qualitative and quantitative research, companies from the five regions of Brazil responded to a questionnaire with variables known to directly impact turnover in diverse economic sectors. Data collection was conducted based on the variables described in Table 1.
Table 1. The variables investigated by the questionnaire
| Variable | Type |
| Country region | Qualitative |
| Distance from the city representing a major center | Quantitative |
| Company lifespan | Quantitative |
| Agribusiness subsector | Qualitative |
| Annual invoicing | Quantitative |
| People management scenario: personnel department and HR | Qualitative |
| Total number of employees | Quantitative |
| Employment contract practices | Qualitative |
| Benefits for the employee and dependents | Qualitative/ Quantitative |
| Internal training and development or employee professionalization actions | Qualitative |
| Engagement and motivation actions: actions for employee well-being | Qualitative |
| Engagement and motivation actions: transparency with the sharing of goals and results | Qualitative |
| Engagement and motivation actions: incentive to innovation | Qualitative |
| Turnover index | Quantitative |
| Awards and bonuses | Qualitative |
| Organizational climate management | Qualitative |
To investigate each variable, 22 questions were formulated, which are described in Table 2. Some of them were open-ended, offering space for respondents to write their answers directly. Others were presented as multiple choice or checkboxes, creating filters and limiting response options. Furthermore, questions based on the Likert psychometric scale[10] were included to measure the degree of respondents’ agreement with specific statements, consulting their empirical knowledge through personal observations and experiences.
In question 17, in particular, a model turnover scale was developed based on official data from Brazil[11] and on the perception of the negative impact that professional turnover can cause to companies[2],[12]. This scale seeks to assess the level of employee turnover and its relationship with the losses faced by organizations resulting from this phenomenon. For example, companies that do not have turnover run the risk of stagnation[2],[12]. An index of 5% to 10% per year is considered ideal for the company’s health, as it allows for staff renewal, attracting and retaining high-performance professionals for the team.[12],[13].
Some sectors naturally present higher turnover than others, as is the case with commerce and retail, which reach an acceptable turnover rate of 35% per year. However, Brazil is currently considered the country with the highest turnover rate in the world, reaching an average of 46.59% in 2022 and experiencing an increase of 56% in 2023[11],[13]. Thus, in question 17, the scale was defined with five percentage levels of annual replacements: very low (up to 10%), low (10% to 20%), medium (20% to 35%), high (35% to 60%), and very high (above 60%).
Table 2. Summary of the applied questionnaire composition
| Question | Answers |
| 1. Company location (city/state) | Open |
| 2. Nearest city or large center | Open |
| 3. Company lifetime (in years) | < 5 | 6-10 | 11-25 | 26-50 | > 50 |
| 4. Agribusiness subsector(s) | Primary | Secondary | Tertiary |
| 5. Select the alternatives that correspond to the current reality of the people management structure in the company | Outsourced personnel department | Outsourced human resources | Professionals who internally assume the personnel department | Professionals who internally assume human resources | Salary and position policy | Career plan | Onboarding for new employees | Clear and formal presentation of general company information, best practice guidelines, code of ethics, rights and duties, values, mission, and the like |
| 6. Total number of employees | < 25 | 26-50 | 51-100 | 101-200 | > 200 |
| 7. Annual revenue | Open/optional |
| 8. What types of employment contracts are practiced in your company? | CLT indefinite term | CLT temporary | Informal temporary contract | Outsourcing contract | Others |
| 9. Select the types of benefits the company provides to employees. | None | Conventional transportation voucher | Extra mobility assistance | Housing allowance | Food voucher | Meal voucher | Flexible voucher | Company meals | Basic food basket | Life insurance | Medical insurance | Dental insurance | Sports incentive voucher | Continuing education incentive voucher (courses, undergraduate and postgraduate etc.) | Cultural incentives | Discounts on company products | Others |
| 10. Select the types of benefits that the company also extends to employees’ dependents? | None | Medical insurance | Dental insurance | School/daycare assistance | Discounts on company products | Others |
| 11. Frequent promotion of training and development | Likert Scale |
| 12. Promotion of actions for well-being or festivities | Likert Scale |
| 13. Internal disclosure of the results of the established goals | Likert Scale |
| 14. Incentive and openness to innovation of products, services and processes | Likert Scale |
| 15. Awards or bonuses for performance, innovation, tenure, or referrals of new clients or professionals | Likert Scale |
| 16. Organizational climate management / Periodic climate survey | Likert Scale |
| 17. In 2022, do you consider that in your company this annual turnover (in percentage of replacements) was: | Very High > 60% | High 35-60% | |
| 18. In 2022, did the company create jobs? If yes, for which hierarchical position? | Average 20-35% | Low 10-20% | Very Low < 10% |
| 19. At which of the three hierarchical levels is it most difficult to find good professionals in the market? | Managers/leaders | Specialized technicians | Operational/rural | Did not create positions |
| 20. At which of the three hierarchical levels is it most difficult to retain or maintain talent in the company? | Managers/leaders | Specialized technicians | Operational/rural |
| 21. Considering only managers/leaders or specialized technicians, what are the main reasons for voluntary departures (resignations)? | Managers/leaders | Specialized technicians | Operational/rural |
| 22. Considering only operational or rural professionals, what are the main reasons for voluntary departures (resignations)? | Distance from major centers | Expectation for a better quality of life in the company’s region | Salary | Lack of Career Plan | Uninnovative environment | Expectation for more benefits | Lack of Personal Motivation | Other |
After collecting the responses using the Likert psychometric scale, the favorability index (FI) was calculated as an additional metric to summarize participant responses. The responses to the Likert scale-based questions were then categorized according to this FI, as shown in Table 3.
Table 3. Categorization of the favorability index (IF)
| Favorability index | Favorability |
| 0% to 20% | Extremely low |
| 21% to 40% | Very low |
| 41% to 60% | Low |
| 61% to 80% | High |
| 81% to 100% | Extremely high |
The overall IF was calculated for the responses to each of the questions presented on a Likert psychometric scale, ranging from question number 11 to 16. The scale, both qualitative and quantitative, was elaborated with a range of 1 to 5: (5) totally agree; (4) tend to agree; (3) I don’t know how to answer; (2) tend to disagree; and (1) totally disagree. The IF calculation was obtained by summing the weights of each response multiplied by the frequency of responses in each alternative, and the result was divided by the maximum possible result[14].
To synthesize the fundamental characteristics of the sample dataset, such as central tendency and variability, and to assess agreement among respondents, mean, median, and standard deviation were calculated. On the Likert scale, the mean represents the average value of the responses. The median is the central value when the data are arranged in ascending order. The standard deviation indicates the dispersion or variability of responses regarding a specific question. The midpoint of the scale has a value of 2.5.
Initially, 75 companies were invited to participate, with 15 target companies for each region, covering micro, small, medium, and large enterprises, representing the three agribusiness subsectors: primary (rural producers, farmers, and ranchers); secondary (agribusinesses and input manufacturers); and tertiary (transport companies, distributors, and agricultural product retailers). Invitations were sent to entrepreneurs, directors, or heads of the HR sector, between January and March 2023, ensuring total confidentiality. Participation occurred through an electronic form or interviews via voice or video calls. Responses were categorized and grouped by the proposed research variables.
Of the invited companies, 27 responded, covering all regions of Brazil. However, there was a significant imbalance in the collected samples, as evidenced in Figure 1. Thus, the discussion of the results was based on a descriptive and graphical approach, aiming to draw conclusions about the characteristics of agribusiness companies in relation to the current scenario of turnover in the field, correlating strategic HR topics with the factors of this rotation.
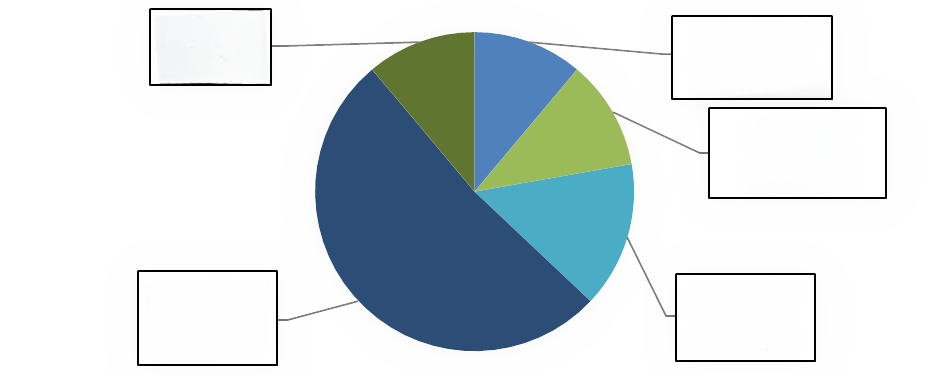
Source: Original survey results.
Figure 2 shows that the dataset was predominantly composed of large companies, i.e., those with more than 200 employees, which represented 56% of the total. Similarly, in Figure 3, it is observed that 66% of the participating companies were more than 25 years old, indicating a consolidated presence in the market.
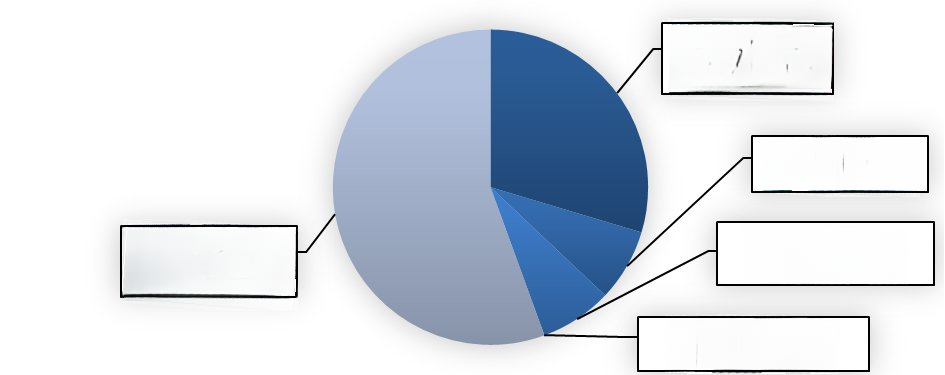
Source: Original survey results.
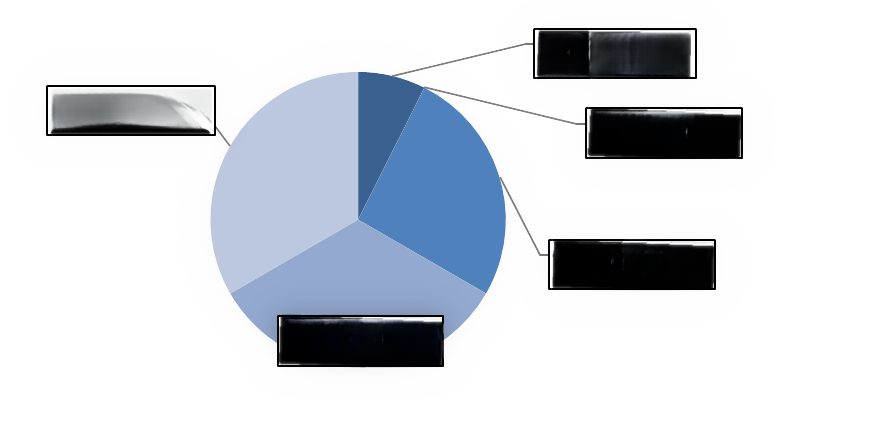
Source: Original survey results.
When analyzing Figure 4 and categorizing companies by the reported turnover rate for 2022, it is noted that those with very high annual turnover (> 60%) had a smaller representation in this survey. In contrast, companies that reported very low turnover (< 10%) had a more expressive participation.
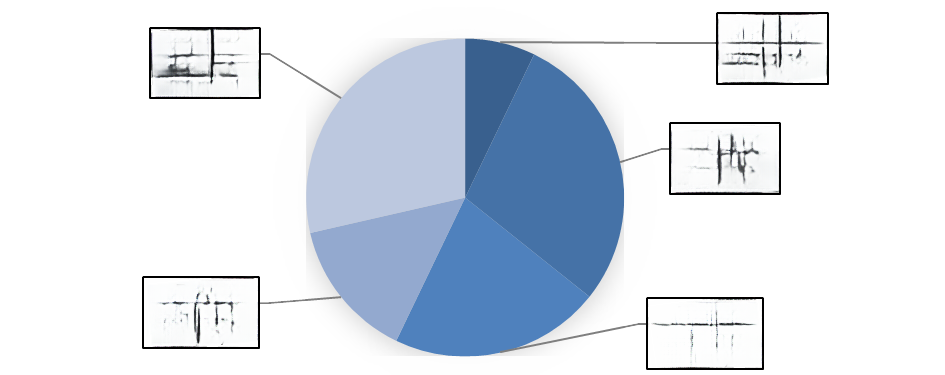
Source: Original survey results.
In the investigation variables related to strategic HR (Table 4), the IF of the questions was considered high, except for the IF of question 15, which involved awards and bonuses. Although most participants gave a favorable response (57.04%) to the question, the overall average (2.85) — slightly below the midpoint of the scale — and the median (3.00) — indicating the neutral point of the Likert scale — suggested a slightly negative or neutral inclination in the responses overall. The high standard deviation (1.63) indicated that the responses were dispersed, suggesting significant divergences in participants’ perceptions regarding this question.
Table 4. Favorability Index (FI) and overall favorability of questions 11 to 16
| Question | IF | General favorability | Average | Median | Standard deviation |
| 11. The company frequently promotes training and development for its employees, including actions for human development and professionalization. | 65,93% | High | 3,30 | 4,00 | 1,44 |
| 12. Throughout the year, the company promotes actions for employee well-being, or festivities among employees. | 79,26% | High | 3,96 | 4,00 | 1,13 |
| 13. The company shares with employees the monitoring of the results of the established goals. | 64,44% | High | 3,22 | 4,00 | 1,31 |
| 14. The company encourages employees to bring ideas for innovation of products, services, and processes. | 74,07% | High | 3,70 | 4,00 | 1,30 |
| 15. Does the company have awards or bonuses for performance, innovation, tenure, or referrals of new clients or professionals. | 57,04% | Low | 2,85 | 3,00 | 1,63 |
| 16. The company manages the organizational climate, including periodically applying a climate survey. | 66,67% | High | 3,33 | 4,00 | 1,52 |
The highest IF (79.26%), situated at the boundary between high and extremely high favorability, was observed in question 12, indicating a strong favorable inclination on the part of the participants regarding the existence of frequent actions related to the well-being of the employees of the interviewed companies. The majority assigned a high score, indicated by the mean (3.96), significantly higher than the midpoint of the scale, and by the median (4.00), which suggests that a substantial portion of the participants gave the maximum score. Furthermore, the low standard deviation (1.13) indicated high agreement among the responses, suggesting that the positive response was consistent among the participants. Question 12 therefore proved to be highly favorable in the survey, receiving an almost unanimous positive response among the participants.
Questions 11, 13, 14, and 16 showed a significantly high level of favorability, with percentages ranging from 64.44% to 74.07%. This suggested that the substantial majority of participants had positive perceptions regarding issues related to training and development opportunities (question 11), monitoring of established goal results (question 13), present innovation culture (question 14), and organizational climate management (question 16).
The means of these four questions ranged between 3.22 and 3.70, that is, above the midpoint of the scale. The means found indicated a general trend of favorability, while the medians of 4.00 indicated that a significant portion of participants assigned the highest scores. However, it should be noted that, despite the general favorability, there was still some variation in the responses, as indicated by the standard deviations. The results between 1.30 and 1.52 were relatively low, which suggested a general agreement in the participants’ opinions regarding these questions. Only question 16 — related to organizational climate management — showed greater dispersion compared to the other three questions. The results were represented in graphs, in which the frequency of favorability was segmented by: (a) region; (b) company tenure; (c) number of employees; (d) turnover; and (e) job creation. These data were evaluated in the context of the year 2022.
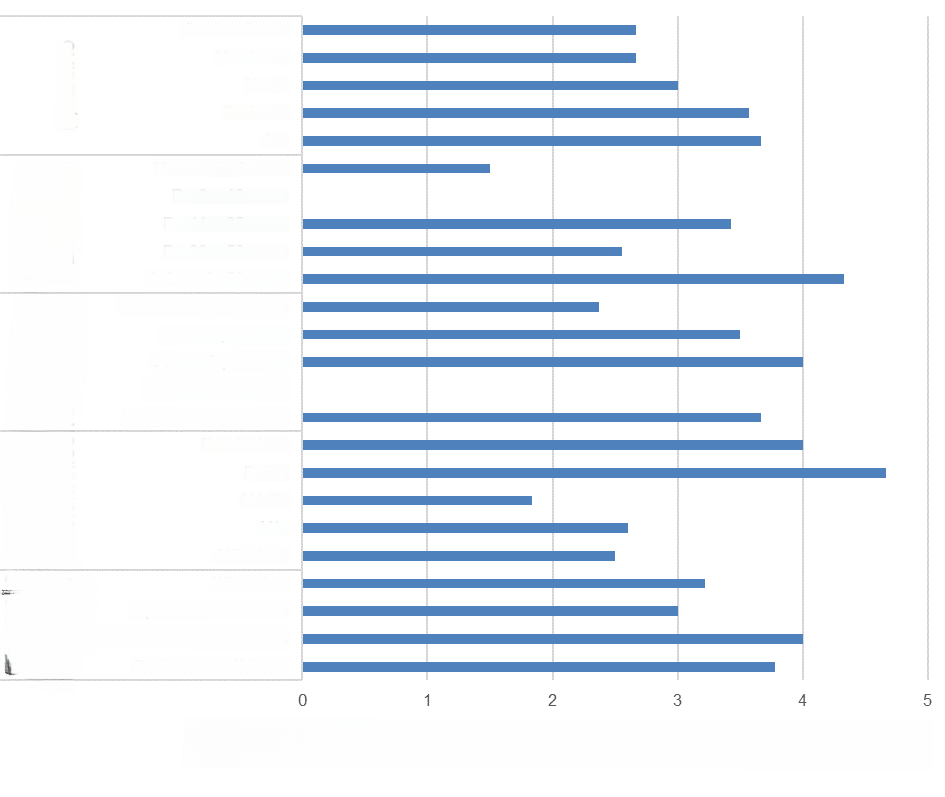
For question 11, related to human development and professionalization actions, Figure 5 shows that the responses indicating low and very low employee turnover (< 20%) apresentaram os níveis mais elevados de favorabilidade. Observa-se também que as empresas que mais investiam no desenvolvimento humano e profissional de seus funcionários eram aquelas localizadas nas regiões Sul e Sudeste, que possuíam o maior quadro de funcionários (> 50 people), which created jobs for specialized technicians and managers/leaders, and companies with more than 50 years in the market.
Source: Original research results.
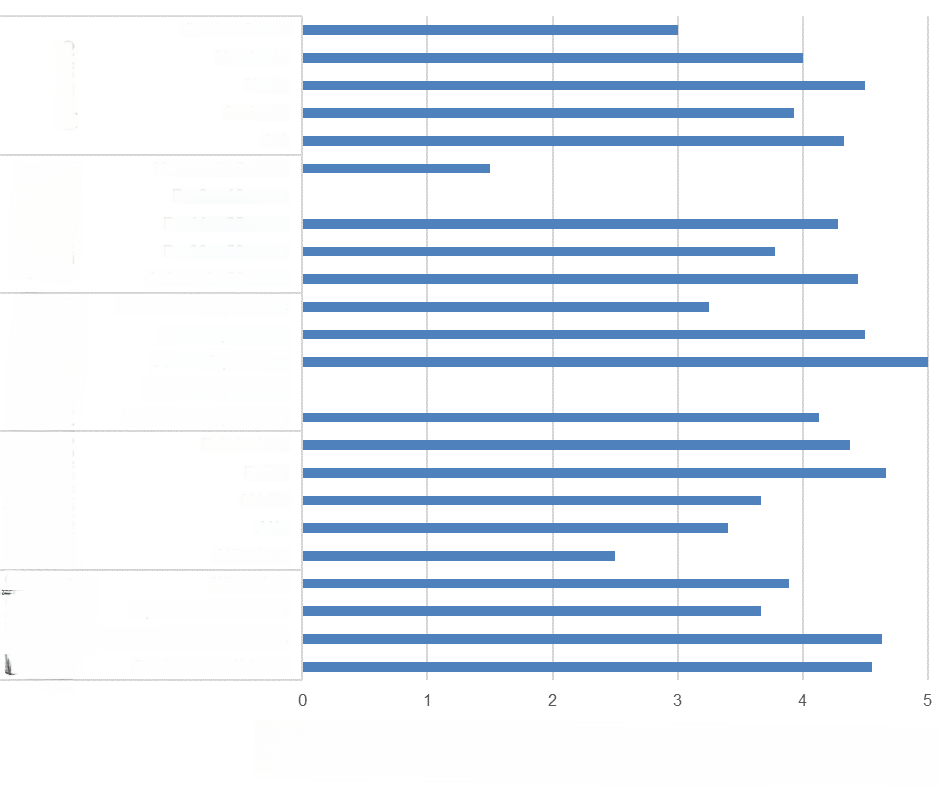
Figure 6, related to question 12, reinforces the hypothesis that companies with a larger staff (> 50 people), longer market presence, and low or very low turnover demonstrated efforts to improve the quality of life within the company, with those located in the North and South of the country being the most active in these actions, followed by the Northeast and Southeast. It is also observed that the companies that expanded their staff of specialized technical professionals and managers/leaders were those that invested in the well-being of their employees.
Source: Original research results.
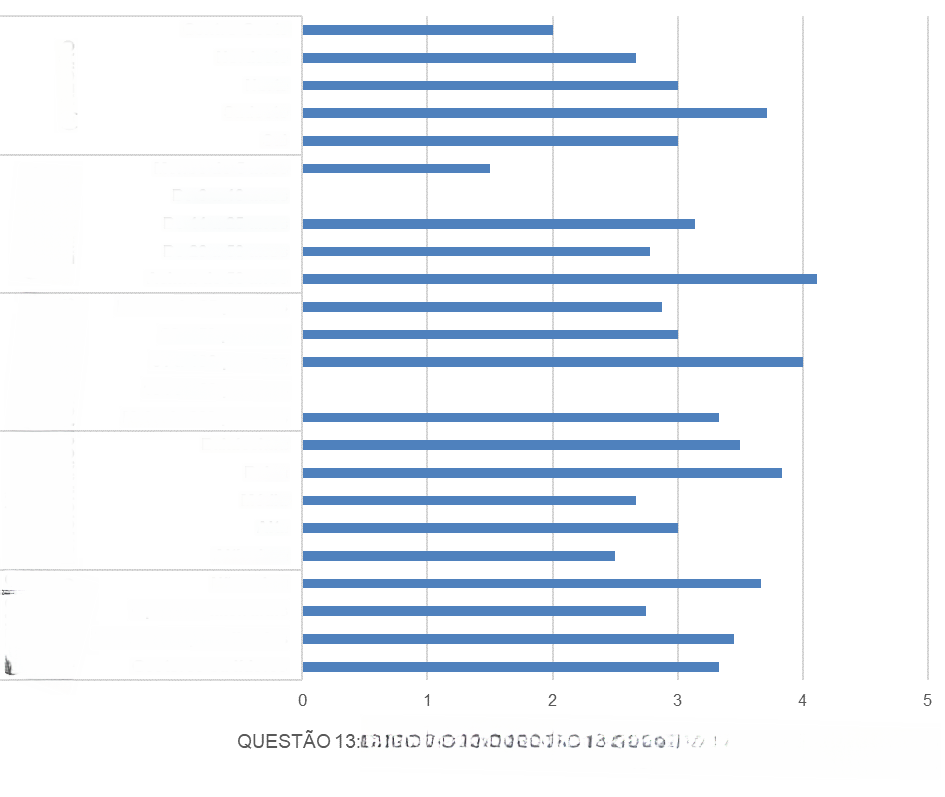
Figure 7, related to question 13, addresses the existence of transparency, collectivity, and trust actions. Companies with more time in the market, a larger staff (> 50 people), and low or very low turnover in 2022 demonstrated greater favorability towards this issue, with emphasis on the Southeast region. Regarding job creation, a trend towards neutrality in responses was observed.
Source: Original research results.
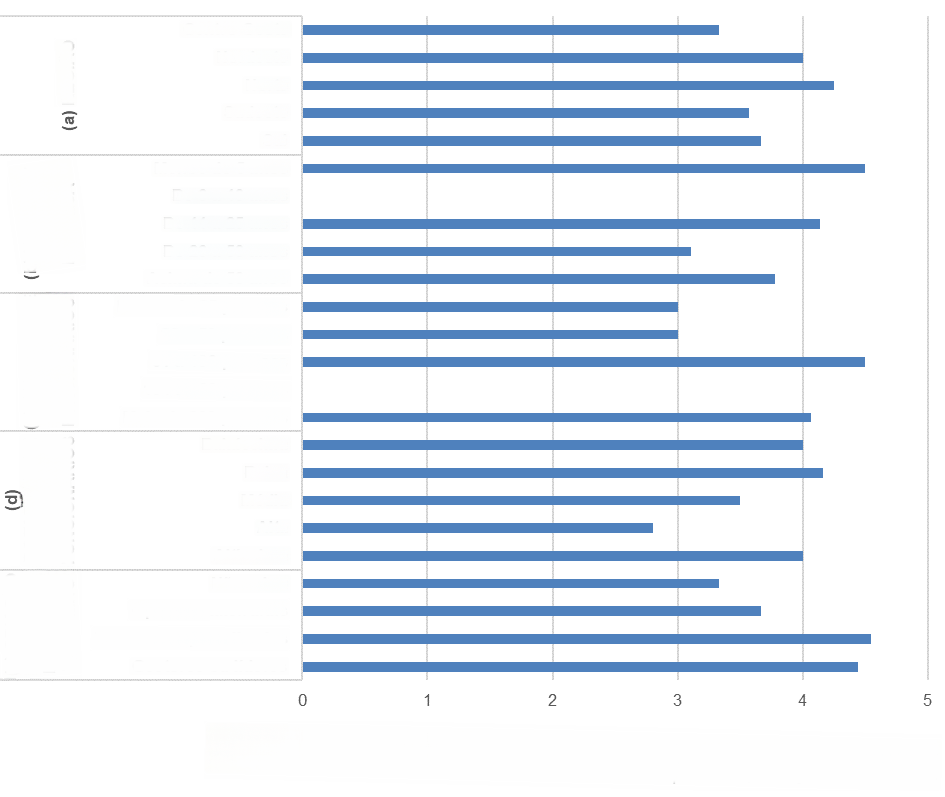
Regarding question 14, which dealt with fostering a culture of innovation in the company, Figure 8 reveals that younger companies in the market presented the highest frequency of high and extremely high favorability. Companies with more than 50 employees in the North and Northeast regions that expanded their workforce with specialized technical professionals and managers/leaders in 2022 demonstrated greater favorability towards the innovation issue. Companies with very high annual turnover (> 60%) and companies with low (10% to 20%) and very low turnover (< 10%) were the most favorable in terms of presenting innovation incentive actions.
Source: Original research results.
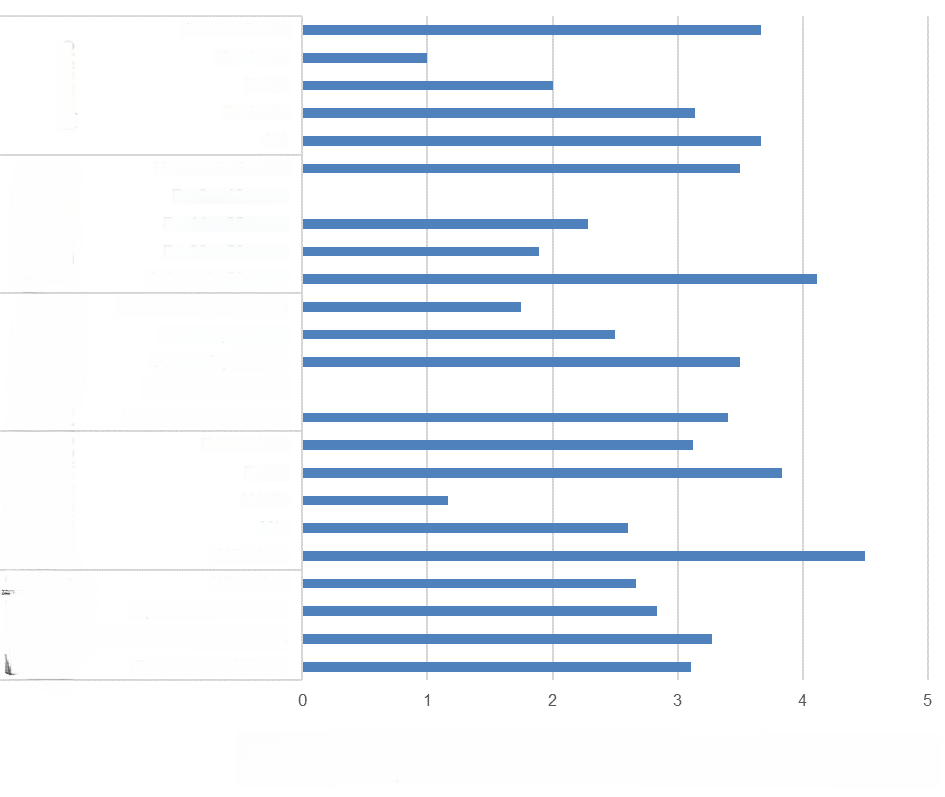
In question 15, which addressed awards and bonuses, Figure 9 highlights with greater favorability companies with more than 50 employees, from the South and Center-West regions, followed by the Southeast. The Northeast showed less favorability to the question. However, both newer companies in the market and older ones showed greater favorability, in contrast to companies with medium lifespan. It was also observed that companies with very high turnover in 2022, as well as those with low and very low turnover, demonstrated high or extremely high favorability. This suggested that actions of this type did not always have a significant impact on turnover, indicating causes possibly stemming from other issues, such as organizational culture and climate. Regarding job creation, there was a tendency towards neutrality in the responses.
Source: Original research results.
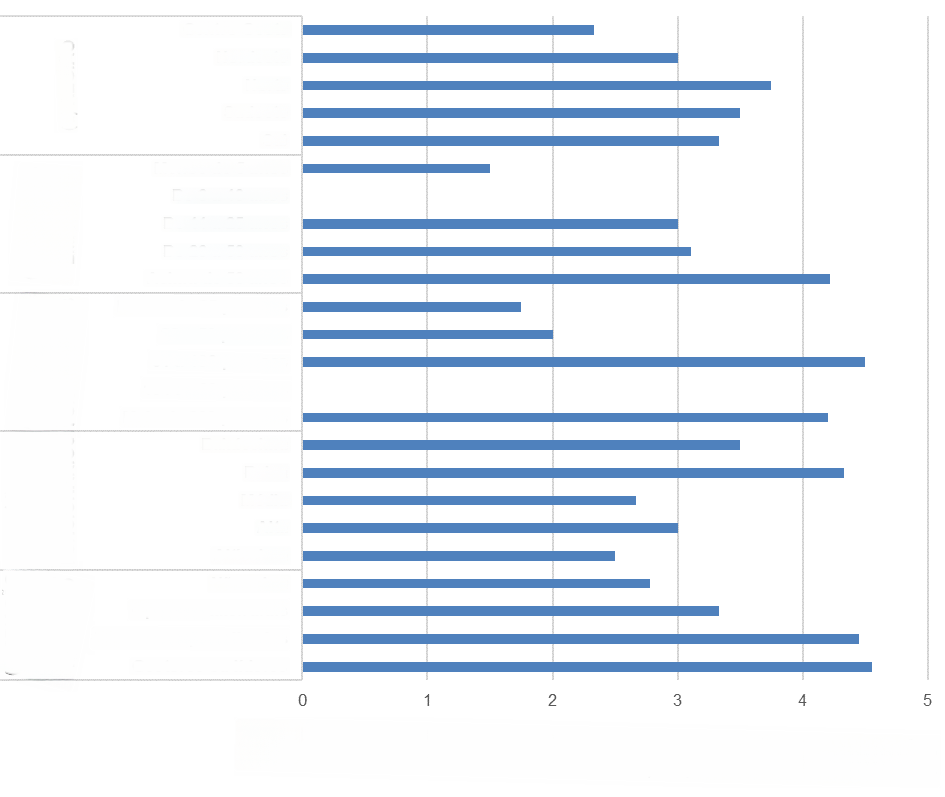
Regarding question 16, which dealt with the management of organizational climate and culture, Figure 10 suggests that the companies most favorable to this statement were those with a larger staff (> 50 people), over 50 years in the market, which significantly expanded their staff with specialized technical professionals and managers/leaders, and which presented low or very low turnover in 2022. No significant variation was observed between regions, with the exception of the Center-West, which showed low favorability.
Source: Original research results.
Apparently, the most consolidated companies in the agribusiness market were those that had been in the market longer and had a larger workforce, typical of medium and large companies. Companies with these characteristics were those that presented the highest frequency of high favorability in the questions related to the actions that underpin a strategic, structured, and functional HR. This scenario was also observed in companies that created jobs for specialized technical professionals and managers/leaders in 2022.
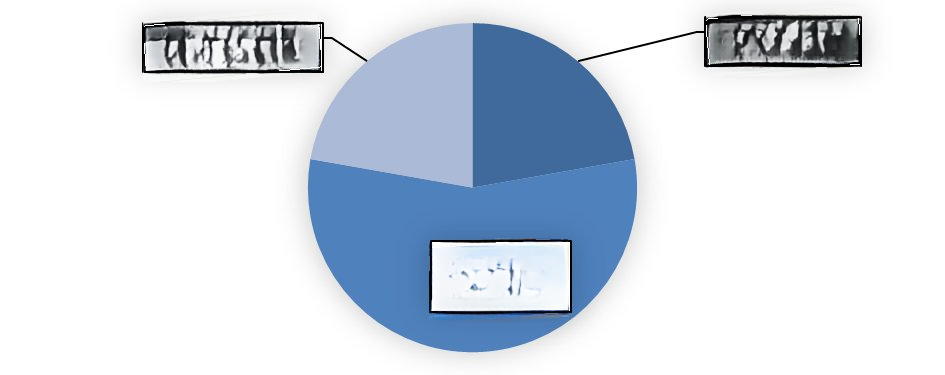
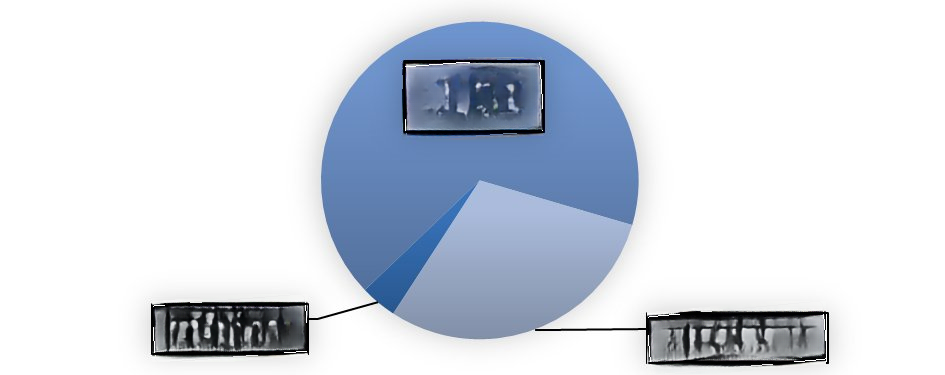
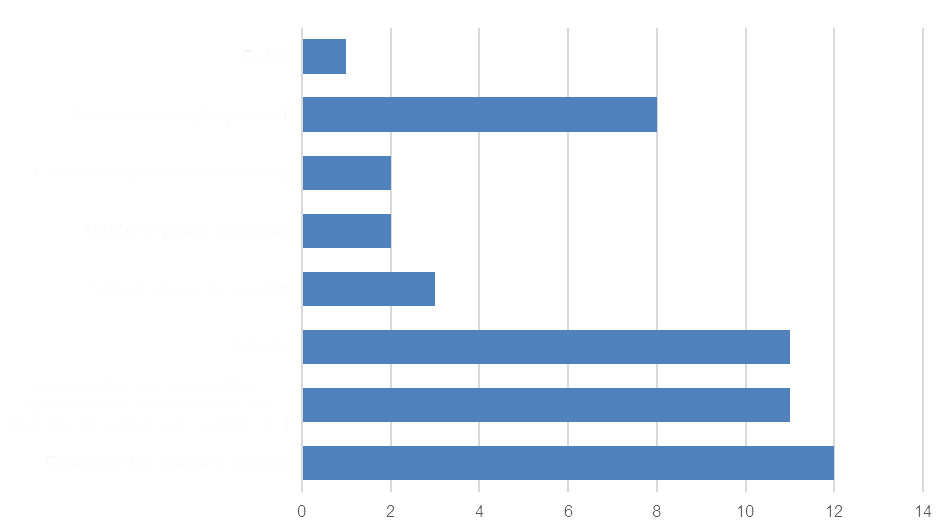
It can be assumed, therefore, that more established companies in the market tend to be more successful in maintaining low turnover levels and are experiencing growth, evidenced by the increase in the workforce with higher education levels, described here as specialized technicians and managers/leaders. The difficulty in attracting these professionals was also assessed in this survey, questioning participants about their current experience in attracting and retaining talented professionals, divided into three hierarchical categories: operational/rural professionals, specialized technicians, and managers/leaders. Regarding the search for and retention of good professionals, participating companies reported finding greater difficulty with specialized technicians, as shown in Figures 11 and 12.
Source: Original research results.
Source: Original survey results.
Companies also shared the main reasons for voluntary resignations (Figure 13). For the most part, specialized technical professionals and managers/leaders requested resignation mainly due to the location of the companies, which, in most cases, was far from major urban centers. Next, they cited issues related to salary and the expectation of a better quality of life in the company’s region. Additional benefits, career plan, and an uninnovative environment were less frequently cited reasons. Furthermore, personal motivation could also be a consequence of these issues.
Source: Original research results.
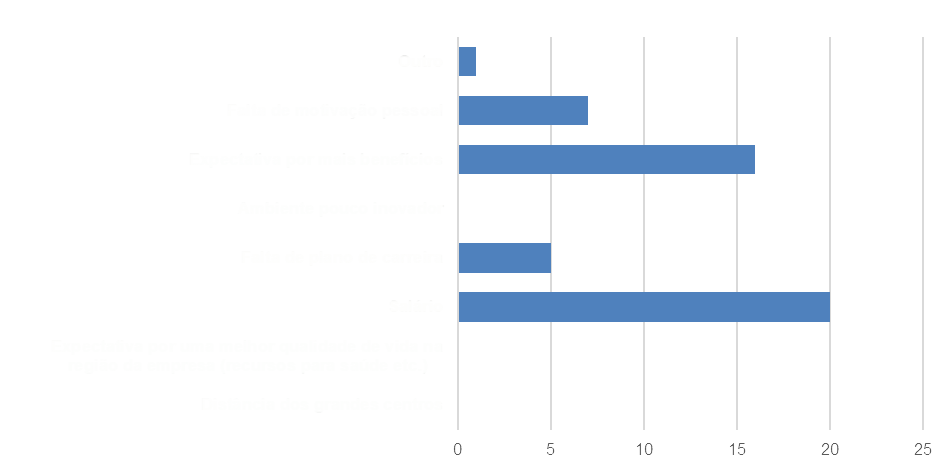
Regarding operational or rural professionals, the reasons mentioned for voluntary departure focused mainly on salary and expectation of more benefits, followed by lack of personal motivation (Figure 14).
Source: Original research results.
According to Chiavenato (2014), other sectors of the economy also face similar challenges, which suggested, in this work, the hypothesis that both in agribusiness companies and in companies from other sectors, the same set of tools and strategies can be used to increase the attraction and retention of talents in the company.
This study evaluated the issues that most impacted employee turnover in Brazilian companies from the perspective of agribusiness companies. Investigation variables common to other sectors of the economy were also analyzed, and a scenario was outlined with agribusiness companies from all regions of the country. Although each company and each region has its particularities, it is important to highlight that similar strategies can be effective in different contexts.
The issue of employee turnover in companies represents a significant challenge for the global market as a whole[13]. In a constantly evolving scenario, such as agribusiness, which seeks a significant increase in specialized professionals in rural areas to meet the imminent demand for labor in the coming years, the issue of employee turnover assumes an even more crucial role. The strategies currently practiced by Brazilian agribusiness companies for talent retention may resemble those of other economic sectors. This suggests the possibility of exploring strategic human resources management to attract and retain talent, both in agribusiness and in other areas of the economy.
Among the analyzed variables, the importance of human development and professionalization actions stood out, as well as investments in employee well-being. These two issues showed a significant correlation with low and very low turnover rates, suggesting that strategies focused on these areas can be especially effective in talent retention in the agribusiness sector. However, it is essential to remember that each company has its particularities and unique challenges. Therefore, the adaptation of talent retention strategies must take into account the specific reality of each organization.
References
[1] Corseuil C.H.L.; Botelho R. (org.). Desafios à trajetória profissional dos jovens brasileiros. Rio de Janeiro: Instituto de Pesquisa Econômica Aplicada (IPEA); 2014.
[2] Chiavenato I. Gestão de pessoas: o novo papel dos recursos humanos nas organizações. 2ed. Barueri: Manole; 2014.
[3] Moreira F.G.; Schlindwein M.M. Sucessão da gestão na agricultura familiar: um estudo de caso no assentamento Santa Olga no município de Nova Andradina em Mato Grosso do Sul. Revista NERA. 2015; (29): 151-173. DOI: 10.23925/2446-9513.2022v9id58575.
[4] Organização das Nações Unidas (ONU). Número de pessoas no mundo. 2022. Disponível em: https://news.un.org/pt/tags/numero-de-pessoas-no-mundo. Acesso em: 20 mar. 2023.
[5] Food and Agriculture Organization of the United Nations. Quase metade da população mundial vive em lares vinculados a sistemas agroalimentares. FAO; 2023. Disponível em: https://www.fao.org/brasil/noticias/detail-events/es/c/1636062/. Acesso em: 07 abr. 2023.
[6] Barros G.S.; Castro N.R.; Machado G.C.; Almeida F.M.S.; Almeida A.N. Boletim Mercado de Trabalho do Agronegócio Brasileiro: 4° trimestre de 2022. Piracicaba: Centro de Estudos Avançados em Economia Aplicada (CEPEA); 2023. Disponível em: https://cepea.esalq.usp.br/upload/kceditor/files/Cepea_Mercado%20de%20Trabalho_ 4T2022.pdf. Acesso em: 30 mar. 2023.
[7] Centro de Estudos Avançados em Economia Aplicada (CEPEA). PIB do Agronegócio Brasileiro. Piracicaba: CEPEA; 2022. Disponível em: https://www.cepea. esalq.usp.br/br/pib-do-agronegocio-brasileiro.aspx. Acesso em: 23 set. 2023.
[8] Centro de Estudos Avançados em Economia Aplicada (CEPEA). PIB do Agronegócio 2022. Piracicaba: CEPEA; 2023. Disponível em: https://www.cepea. esalq.usp.br/upload/kceditor/files/PIB-DO-AGRONEGOCIO-2022.17MAR2023(1).pdf. Acesso em: 07 abr. 2023.
[9] Ministério da Agricultura, Pecuária e Abastecimento (MAPA). Brasil exporta US$ 14,8 bilhões em produtos do agronegócio em agosto. 2022. Disponível em: https://www.gov.br/agricultura/pt-br/assuntos/noticias-2022/brasil-exporta-us-14-8-bilhoes-em-produtos-do-agronegocio-em-agosto. Acesso em 07 abr. 2023.
[10] Costa F.J. Mensuração e desenvolvimento de escalas: aplicações em administração. Rio de Janeiro: Ciência Moderna; 2011.
[11] Ministério do Trabalho e Emprego (MTE). Novo CAGED – Estatísticas Mensais do Emprego Formal. Banco de dados atualizado mensamente desde jan. 2000. Disponível em: http://pdet.mte.gov.br/novo-caged. Acesso em: 07 jan. 2024.
[12] Soares V.G.; Alcázar J.J.P.; Ferreira F.F. Employee turnover intention – mapping profiles under a decision tree perspective. Redeca. 2022; 9: e58575. DOI: 10.23925/2446-9513.2022v9id58575.
[13] Pós PUCPR Digital. Turnover, o índice de rotatividade que vem impactando as empresas. G1; 2022. Disponível em: https://g1.globo.com/pr/parana/especial-publicitario/pos-pucpr-digital/voce-no-futuro/noticia/2022/12/03/turnover-o-indice-de-rotatividade-que-vem-impactando-as-empresas.ghtml. Acesso em: 03 jan. 2024.
[14] Perspectiva Consultores. Pesquisa de Clima Organizacional. Florianópolis: Perspectiva Consultores; 2016. Disponível em: http://perspect.com.br/site/files/downloads/relatorio_pesquisa_individual.pdf. Acesso em: 05 abr. 2023.
How to cite
Souza H.D.; Almeida A.B. Professional turnover in agribusiness companies: the challenges of managing field staff. E&S Journal. 2024; 5: e20240005.
About the authors
Hilarina Dias de Souza, Business and People Management – Rua Vergueiro, 2087, room 502 – Vila Mariana – 04101-000 – São Paulo/SP, Brazil.
Alexandre Barreto de Almeida, Harfsen Research – Rua Dona Eugênia, 1437 – São Judas – 13416-401 – Piracicaba/SP, Brazil.