
Agribusiness
Customer Expectation
Agricultural Technology
November 07, 2022
Customer experience in reducing churn rate in a company specialized in agricultural technology
DOI: 10.22167/2675-6528-20220033
E&S 2022,3: e20220033
Alan Yago Barbosa de Lima e Alexandre Barreto de Almeida
The necessary cost to prospect clients can be five times higher than the retention cost[1]. Understanding “churn” (evasion rate), that is, the customer’s abandonment or migration to a competitor, enables the organization to act on the variables that influence it, seeking to mitigate it[2].
Changes in the client-supplier relationship were promoted through the evolution of relations between market and competition[3], with the objective of improving satisfaction levels, by creating a conducive environment for new businesses, in order to promote repurchase[4]. Several tangible aspects (related to the good or service) and intangible aspects (related to factors such as trust, empathy, among others) interconnect and encompass the client-supplier relationship[5].
Customers become partners of the company that, in order to preserve this relationship with innovation and quality, assumes long-term commitments. This is relationship marketing, based on the conservation and improvement of the relationship with existing customers. Thus, it is assumed that customers, in search of value, prioritize a lasting relationship over the constant exchange of service providers[6].
Companies in the “Agricultural Technology” (AgTech) segment are organizations that offer a high technological level, which justifies the importance of the topic. Furthermore, customer relationship is fundamental for the client to achieve waste reduction in crops and increased competitiveness. With 29 years in the market, the company object of this study, a developer of technology for precision agriculture projects, has organized sectors, from prospecting to after-sales, and possesses significant brand value in its field.
In the customer era, communication is as fundamental as the product or service offered. The collection of statistical data on customer behavior is efficient in the quantitative scope, however, it is paramount that the company is always attentive to the desires, frustrations, needs, and problems of customers, configuring a qualitative approach in relation to the customer[7]. Based on this scenario, it is possible to establish a foundation that supports the association between elements of customer satisfaction and the decrease of “churn”.
To this end, a case study was conducted in an agribusiness company, with the aim of analyzing the reduction of the dropout rate through customer satisfaction, identifying strengths and weaknesses related to customer service and service delivery, ensuring satisfaction and improvement of actions to retain customers and reduce dropout.
To measure customer satisfaction and loyalty, the “Net Promoter Score” (NPS) and “Customer Satisfaction Score” (CSAT) indicators were used. Furthermore, understanding the reasons why customers abandon your product or service is paramount for sustainable business growth. In this regard, the “Churn” indicator was used to measure and analyze the attrition rate, which has a negative effect on revenue, as understanding this index and how to act to reduce this rate is critical for the success of many businesses.
Customer Experience & Success
The complex evolution of relationships, allied with an increasingly demanding and informed market, has driven customer management and marketing in recent decades. With this, methodologies such as Customer Experience Management (CXM) and Customer Success have emerged[8].
GEC emerged to manage the customer experience from pre-sales to post-sales, adding value through content, services, and interactions[9]. Customer Success has been growing and strengthening due to the significant growth of subscription models[10]. In other words, the need for renewal at the end of a period has driven the customer experience and success model.
For this study, a total of 290 clients were considered, all users of a software for precision agriculture projects, in July 2020. A Customer Success department was created, with the objective of approximation, through proactive contacts, to understand their experience and satisfaction, publicize news, and anticipate the resolution of any negative interaction with the company. Subsequently, the “churn” for a twelve-month period was calculated, comparing the results with those of the twelve months prior to the project’s start. Of the total active clients, 215 participated in the study.
Net Promoter Score
Customer loyalty data were obtained through the analysis of Net Promoter Score(NPS), the indicator that aims to measure customer loyalty[11] by applying quantitative and qualitative questions. To analyze the fulfillment of the company’s mission, it is necessary to evaluate customer relationships. To measure this indicator, two questions are necessary: one objective and direct question and a justification[12].
Thus, it is possible to detect the degree of customer loyalty and segment them (Figure 1) to then assist in improving customer-company relationships and in the management of loyalty strategies and goals. After segmentation, the company takes specific actions for each group[12].
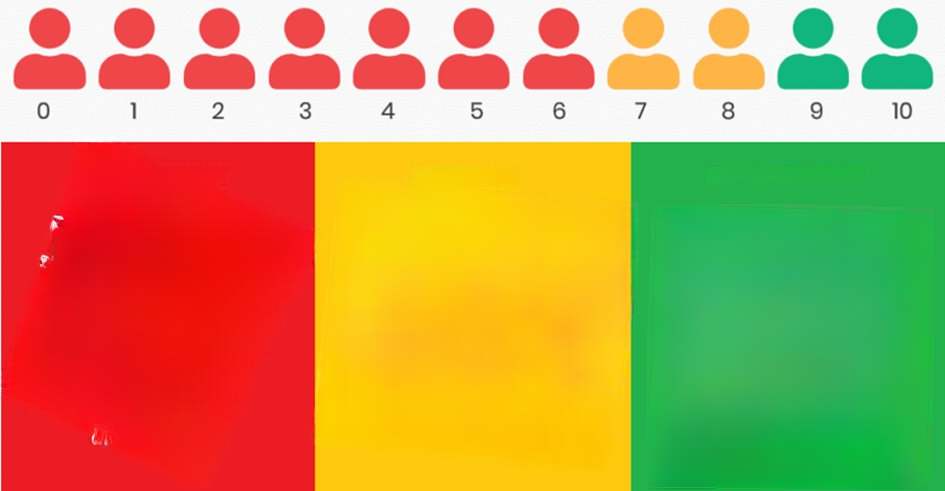
Figure 1. Customer segmentation on the NPS scale
Source: Prepared by the author
The first question serves to segment the respondents, but the second question is important to understand the reason behind the rating given to the company (product or service): “What motivated your rating?”. Reichheld[12] emphasized that the question offers the customer a space to be heard, which avoids biased results from traditional surveys.
In this study, the calculation was performed by subtracting the percentage of promoter customers (P) from that of detractor customers (D), presenting as a result the net promoter score (NPS), according to Equation 1.
P (%) – D (%) = NPS (%) (1)
Where: P is the percentage of promoters; D is the percentage of detractors; NPS is the net promoter score.
The NPS result is classified into zones, according to Figure 2: Critical Zone, in which immediate improvements are necessary together with the entire team and collaborators; Improvement Zone, in which NPS must continue seeking to meet customer expectations; Quality Zone, in which customers are happy and the company must continue striving for its best; Excellence Zone, in which there are high chances that most customers will be loyal and perform voluntary advertising[12].

Figure 2. NPS classification zone
Source: Elaborated by the author
Customer Satisfaction Score
The Customer Satisfaction Score (CSAT) measures the customer’s satisfaction level with the product/service through a questionnaire conducted after the customer’s interaction with the product/service. The score is determined by asking users about their satisfaction level with the consumption experience, on a scale of 1 to 5, where 1 is very dissatisfied and 5 is very satisfied. The results are expressed as a percentage, from 0% to 100%[13].
As evidenced in the literature, customer satisfaction is dependent on the quality of the product or service offered[14], and customer loyalty, in turn, suggests a higher probability of repurchase[15]. However, a satisfied customer is not always a loyal customer[16], which is why it is so important to analyze CSAT. The calculation followed according to Marchetti and Prado[17] (Equation 2):
CSAT = (number of satisfied customers/total number of responses) x 100 (2)
“Turnover“
Regarding the customer base, “churn” is the number of customers who have left the base in a given period, which may indicate a level of dissatisfaction, better prices offered by competitors, or other reasons that may interfere with the customer lifecycle.
The “churn” was calculated from the total number of users who did not renew their usage license in a given period, in relation to the number of active users in the same period[1].
Case study
Companies have sought to build customer loyalty through optimized service, aiming to demonstrate to these customers the importance of their opinion, as well as their time. In this regard, Reichheld’s method[12] provides necessary information for continuous improvement in companies. The methods used involve few objective questions, but are sufficiently efficient to sustain customer satisfaction and loyalty, which is why they are currently the most used methods in the corporate universe.
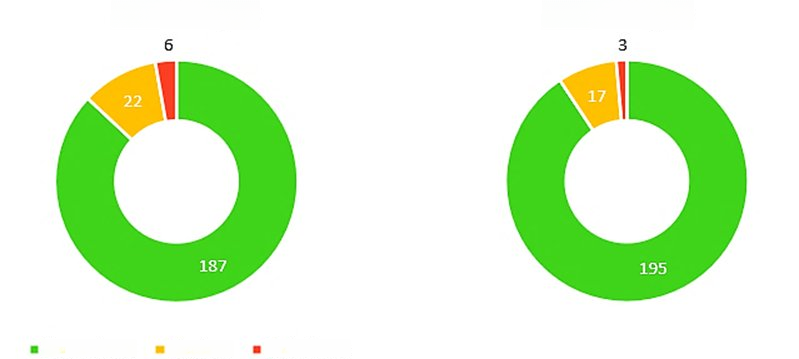
Figure 3 presents the NPS data resulting from the first evaluation, carried out in January 2021. It is possible to observe a considerable improvement in customer satisfaction, as well as a reduction in neutral and detractor customers.
Figure 3. Result of applying the NPS from the 1st and 2nd evaluations
Source: Elaborated by the author
Although the method’s focus is to identify detractor customers, who demand immediate measures, neutral customers also need observation, as they are responsible for low NPS results. It is therefore necessary for all company sectors to be integrated, so that the services are of quality and provide the experience the customer aims for[12].
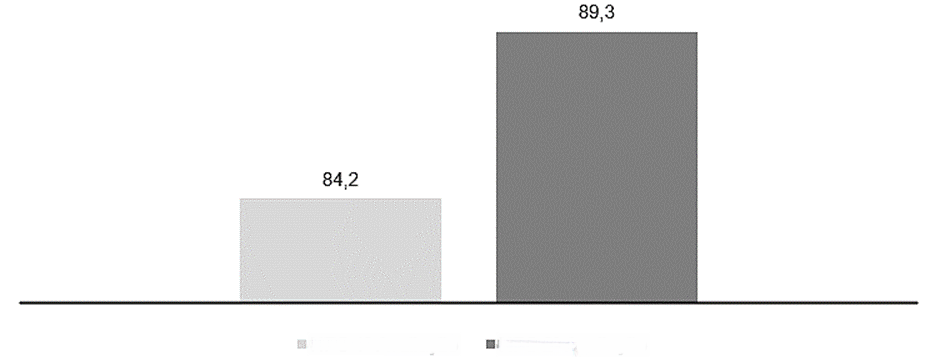
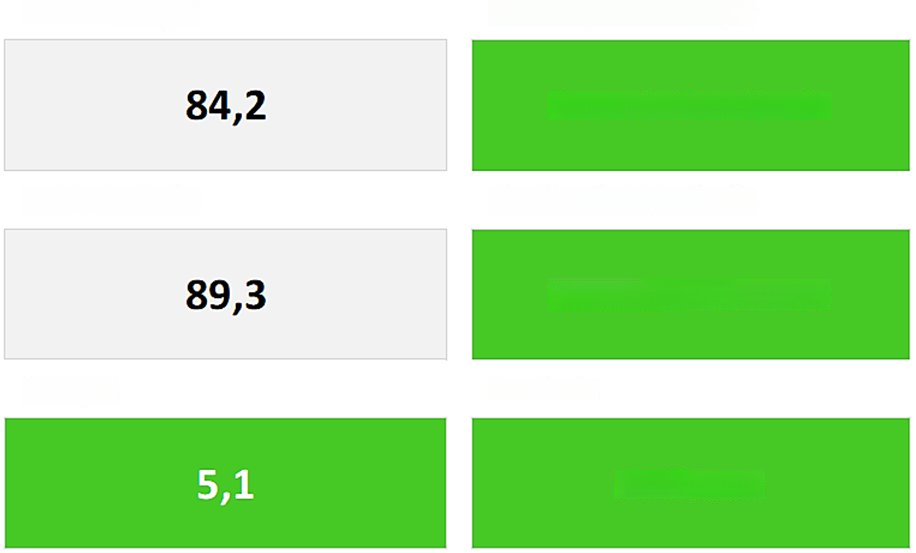
The NPS classification remained within the considered zone of excellence, which implies great possibilities for most customers to be loyal and perform voluntary advertising (Figures 4 and 5). In the second assessment, there was an improvement of 5.1 points in the NPS compared to the first, suggesting that the company’s image among customers improved in twelve months.
Figure 4. Comparison between the NPS of the first and second evaluations
Source: Elaborated by the author
Figure 5. NPS Classification of the first and second evaluations
Source: Elaborated by the author
It is important to emphasize that besides ensuring constant improvement in the customer experience, NPS can also measure product/service performance. Actions to promote a good customer experience should be continuous, ensuring it is constantly surpassed, so that this customer becomes a brand advocate[12].
Long-term customer-company integration efforts predict profits through value-added management, not just the profit from a single or isolated sale[18].
The great challenge of delighting is the daily goal of large companies, a secret that makes them successful. With detractor customers, one should proceed by questioning them about what could be done to bring their score closer to ten, making it possible to identify areas for improvement. It is also necessary to monitor neutral customers, so that in the future they do not downgrade to detractors, but transform into promoters. This is because neutral customers signal that, at some point, the interaction was insufficient[12].
The evolution of customer satisfaction results not only from their interaction with essential services, but from their entire journey and experience during the service delivery process (Table 1).
Table 1. Satisfaction survey result
| Evaluation | Aug.20 | % | Jan.21 | % | Jul.21 | % |
| Extremely Satisfied | 84 | 39,07 | 101 | 46,98 | 105 | 48,84 |
| Very Satisfied | 67 | 31,16 | 77 | 35,81 | 80 | 37,21 |
| Satisfied | 45 | 20,93 | 30 | 13,95 | 27 | 12,56 |
| Slightly Satisfied | 12 | 5,58 | 5 | 2,33 | 3 | 1,40 |
| Nothing Satisfied | 7 | 3,26 | 2 | 0,93 | 0 | 0,00 |
| Sum | 215 | 100,00 | 215 | 100,00 | 215 | 100,00 |
Source: Elaborated by the author
The satisfaction level, i.e., the sum of satisfied, very satisfied, and extremely satisfied customers, evolved from 91.2% in the first evaluation, to 96.7% in the second, and finally to 98.6% in the third evaluation, suggesting that the majority of customers are satisfied with the services provided and recommend the company.
Currently, only 1.4% are detractor customers, a result that, according to the qualitative question, occurs due to some unmet expectation. In contrast, the responses of promoter customers are directly related to the service and support sectors, highlighting the quality of the service and attendance, the rapid resolution of problems, and good after-sales service.
It can be stated that a company’s success is directly related to quality customer service. In other words, it can be said that if customer service meets their needs, the company’s growth tends to increase in sales, profits, and brand value[19]. Managing “churn” as a form of evaluating customer relationship marketing actions can point to those customers with whom the company has been experiencing some friction in the relationship, enabling improvements and adjustments in the customer loyalty process. In other words, knowing the churn rate is important for directing actions from the development of marketing campaigns to strategies for customer retention[20].
Table 2. Churn rate
| Period | Total Sales | Total Loss | Balance | Attrition |
| Jul.19 – Jun.20 | 50 | -32 | 290 | 11,00% |
| July 20 – July 21 | 68 | -28 | 330 | 9,20% |
Source: Elaborated by the author
There was a considerable reduction in the customer churn rate (Table 2), and this may be related to the relationship marketing activities employed, as both NPS and CSAT results also evolved. The results obtained highlight the importance of recognizing the relevance of “churn” management in customer base maintenance processes.
In agribusiness, clients expect quick solutions that help reduce idle time, thus resulting in greater productivity in the field, reduced time, and savings on inputs. This is evidenced by the various compliments made about the company’s technical support service’s performance and agility, in response to the question “What are the reasons behind the score given?”.

Figure 6. Motivation of Ratings – word cloud obtained in response to the question “What are the reasons behind the assigned rating”
Source: Prepared by the author
Table 3. Occurrence of motivation words from the assigned score
| Occurrence | Word |
| 169 | Client |
| 113 | Fast |
| 102 | Customer Service |
| 66 | Attention |
| 55 | Congratulations |
| 33 | Agile |
| 31 | Communication |
| 28 | Satisfied |
| 27 | Support |
| 11 | Team |
Source: Elaborated by the author
The results obtained (Figure 6 and Table 3), as well as the theoretical discussions identified in the literature, suggest that the adopted strategies are good tools for improving the actions used to retain customers and reduce the churn rate.
Other methodologies can also be efficient in the process of continuous improvement of customer satisfaction and loyalty rates, contributing to the reduction and better management of the churn rate, as is the case of the Customer Effort Score (CES), which seeks to assess the level of difficulty encountered by the customer to solve a problem, for example[21]. Internal decisions and the creation of the Customer Success department were the measures taken by the company based on the results obtained, considering that 74.14% of customers responded to the surveys.
References
[1] Kurtz D.L; Clow K.E. Services marketing. 1998. John Wiley & Sons, New York, NY, USA.
[2] Accenture. The new customer imperative: retaining and acquiring customers in a changed banking landscape. The Point. 2009; 9(4): 1-8.
[3] Vargo S.L.; Lusch R.F. Evolving to a new dominant logic for marketing. J Mark. 2004; 68(1): 1-17.
[4] Eggert A.; Ulaga W. Customer perceived value: A substitute for satisfaction in business markets? JBIM. 2002; 17(2/3): 107-118.
[5] Fitzsimmons J.A.; Fitzsimmons M.J. Administração de serviços: Operações, estratégia e tecnologia da informação. 6ed. 2010. Bookman, Porto Alegre, RS, Brasil.
[6] Zeitahaml V.A.; Bitner M.J., Gremler, D. Marketing de serviços: a empresa com foco no cliente. 6ed. 2014. AMGH, Porto Alegre, RS, Brasil.
[7] Mckenna R. Marketing de relacionamento: Estratégias bem-sucedidas para a era do cliente. 7ed. 1992. Editora Campus, Rio de Janeiro, RJ, Brasil.
[8] Soares I.M. Desenvolvimento do processo de gestão da relação com os clientes no INEGI; 2008. Disponível em: <https://repositorio-aberto.up.pt/handle/10216/58449>.
[9] Schmitt B.H. Gestão da experiência do cliente: uma revolução no relacionamento com os consumidores. 2004. Bookman, Porto Alegre, RS, Brasil.
[10] Mehta N.; Steinman D.; Murphy L.; Martinez, M. Customer success: how innovative companies are reducing churn and growing recurring revenue. 2016. Wiley, Hoboken, NJ, USA.
[11] Reichheld F.F. The one number you need to grow. Harvard Business Review. 2003; 81(12): 46-57.
[12] Reichheld,F.F. A pergunta definitiva: Você nos recomendaria a um amigo? 2006. Editora Campus, Rio de Janeiro, RJ, Brasil.
[13] Duarte, T. CSAT: entenda o Customer Satisfaction Score. Trak.Co; 2022. Disponível em: < https://track.co/blog/csat/>.
[14] Parasuraman A.; Zeithaml A.; Berry L. A conceptual model of service quality and its implications for future research. J Mark. 185; 49: 41-50.
[15] Lichtlé M.; Plichon V. Understanding better consumer loyalty. RAM. 2008; 23(4): 121-140.
[16] Jones T.; Sasser W. Why satisfied customers defect. Harvard Business Review. 1995; 73(6): 88-99.
[17] Marchetti R.; Prado P.H.M. Um tour pelas medidas de satisfação do consumidor. RAE. 2001; 41(4): 56-67.
[18] Kotler P.; Keller K.L. Administração em Marketing. 14ed. 2012. Pearson Education do Brasil, São Paulo, SP, Brasil.
[19] Hassan I.A.Y.; Ali I. Customer service and organizational growth of service enterprise in Somalia. Educational Research International. 2013; 2(2): 79-88.
[20] Berry M.J.A.; Linoff G. Mastering data mining: The art and science of customer relationship management. 1ed. 2000. Wiley Computer Publishing, New York, NY, USA.
[21] Clark M.; Bryan A. Customer effort: help or hype? Henley Business School. 2013. Disponível em: <http://www.resourcesbt.com/resources/files/quicklinks/136194842_Customer_Effort_Help_or_Hype_65299.pdf >.
Como citar
Lima A.Y,B; Almeida A.B. Experiência do cliente na redução da taxa de evasão em empresa especializada em tecnologia agrícola. Revista E&S. 2022; 3: e20220033.
Sobre os autores
Alan Yago Barbosa de Lima, Engenheiro Agrônomo e Especialista em Agronegócios, São Paulo, SP, Brasil.
Alexandre Barreto de Almeida, Harfsen Research, Departamento de gestão de projetos de inovação, Piracicaba, SP, Brasil.
Editorado por: Edson Pereira da Mota
Link para download: https://cms.revistaes.com.br/wp-content/uploads/2022/11/ES_33.pdf