
Agribusiness
Risk Management
Rural Producer
May 15, 2024
Risk management in agribusiness: hedge strategies for the rural producer
DOI: 10.22167/2675-6528-20230065
E&S 2024, 5: e20230065
Antônio Costa Ferreira Neto; Rodrigo Marques Nascimento; Lucas da Costa Santos
Since the dawn of civilizations, food production has been part of the basic strategies for population maintenance. Currently, in addition to the objective of meeting basic physiological needs, the agricultural market plays a strategic role in the economies of several countries, as is the case of Brazil, which in 2022 had 24.8% of its GDP represented by agribusiness[1], making the Brazilian agricultural sector the target of significant investments within the country’s economy. In the next ten years, a growth of about 40% is expected in Brazilian agribusiness[2,3].
Brazil is considered the world’s breadbasket due to its capacity to produce large volumes of food. The country has about 22% of the world’s arable land; it has a diverse climate; abundant solar energy; and about 13% of all the planet’s fresh water, in addition to increasingly raising the levels of technologies in the field, which guarantee productivity increases and make Brazilian agribusiness a modern, efficient, and competitive sector on the international stage[4]. However, rising global competitiveness demands the use of tools to improve producers’ profit margins and reduce operational risks.
The resilience and profits of agribusiness over the years, generating positive results in adverse scenarios (as in the case of the Covid-19 pandemic), have raised the expectation that the activity will attract even more investments. However, as in any other business, the sector is not immune to risks and uncertainties[5]. The sources of risk can be directly linked to agricultural and livestock production, such as climate instability and the emergence of pests and diseases, or to market, institutional, and financial risks.
The producer needs to make an investment with the expectation that, after a certain period, the profit margin will be positive. However, there is a possibility that, during this period, events may occur that result in a sudden price variation. An example is a disagreement with an international commercial partner, which can result in a drop in product prices, as happened at the end of September 2021, when China stopped buying Brazilian beef, and the price of fattened cattle fell.
Therefore, an efficient productive process is essential for a good outcome in rural entrepreneurship. However, this is not the only factor that defines the return on invested capital. Managing the market risks involved in the business is an important task for those who wish to remain active and competitive in their businesses, considering competition and the free market. For this purpose, producers can use hedging, which consists of fixing the product price in advance, with the aim of protecting the operator from potential losses resulting from value fluctuations[6].
The justification for this research is the fact that many producers do not know the tools that can provide greater security for the commercialization of their production. Thus, the objective was to investigate the impact of using agricultural hedge tools in a market risk management structure applied to agribusiness, specifically for corn commercialization.
According to Liquitay[7], the term hedge, of English origin, refers to an operation in which a financial instrument is used to protect a given asset from price fluctuations, with the objective of safeguarding the financial operator from eventual losses resulting from the oscillation in the value of their assets. For Hull[8], performing a hedge can be compared to taking out insurance, potentially providing more peace of mind for those who undertake it. By using this protection tool, the agent can eliminate possible losses; however, the hedge can also nullify the possibility of profit, with the economic objective being the transfer of inherent risks in operations to another agent.
The hedge strategy was used to understand the reality of a hypothetical corn producer who is seeking an alternative to reduce the risk of price fluctuations, minimizing the possibilities of loss. For this, the aforementioned producer should rely on the forward market and the options market to carry out their price risk management strategy, which consists of selling contracts with a volume equivalent to their production, with the objective of mitigating the risk of price oscillation.
In the analysis, a harvest with hypothetical investment and cost was considered, and different price scenarios were taken into account. The harvest results, according to the fictitious scenario, considered the variables hedge and capital structure. In this sense, in the present study, simulations were performed for six scenarios:
Scenario I: harvest with investment made only with own capital and without the use of hedge;
Scenario II: harvest with investment made only with own capital and with forward market hedge;
Scenario III: harvest with investment made only with own capital and hedge from the options market;
Scenario IV: harvest with investment half made with own capital and half with third-party capital, without the use of hedge;
Scenario V: harvest with investment half made with own capital, half with third-party capital and with forward market hedge.
Scenario VI: harvest with investment half made with own capital, half with third-party capital and with options market hedge.
All scenarios used a production of 90 thousand bags of corn, at a cost of BRL 66.00 per bag (average price provided by the National Supply Company in 2022 (CONAB, 2022)[9]. Additionally, sale values for corn ranging from BRL 60.00 to BRL 75.00 per bag were considered.
The scenario with hedge in the options market considered a premium value of R$ 2.00 per bag for the put option, and the strike price of R$ 72.00 per bag, with an exercise date of 120 days after the transaction. Each corn option contract has 450 bags; therefore, 200 contracts were considered in the simulation to cover the 90,000 bags produced.
For scenarios using third-party capital, an interest rate of 3.66% for 180-day loans was considered, along with a capital structure of 50% equity and 50% third-party capital. The adopted interest rate was obtained from the 2022/23 Safra Plan, where interest for the National Program to Support Medium Rural Producers (PRONAMP) was 8.0% per year. The cost of capital was disregarded in all scenarios.
Based on the aforementioned criteria, the obtained results were demonstrated according to the variation of scenarios, considering the profitability on investment and on equity for each scenario tested. The data analysis was developed in Excel, and the discussion was carried out using descriptive statistics from tables and graphs, thus allowing the exploration of the results found.
Scenario 1 took into account the business model with equity and without hedge. This is the most common of the scenarios, in which the producer does not acquire financing and does not use tools to protect against negative price variations. Thus, the farmer does not know what the selling price will be, which will depend on the cereal’s value on the day it is traded. The expected production was 90,000 bags of corn, at R$ 66.00 each. As no loan was defined in this scenario, interest did not influence the cost, and the total investment was R$ 5.9 million. The selling price of R$ 66.00 per bag was considered the break-even point, equating costs and revenue; above this value, the scenario would be profitable for the producer, and profitability could reach up to 13.6% when the corn price was R$ 75.00 per bag.
For Scenario 2, a business model was considered with investment entirely derived from equity and with hedging, through forward market sales, to guarantee the anticipated value for the harvest to be reaped. As there was no third-party capital involved, there were also no interest payments, which is quite conservative, as the producer uses only their own money and eliminates price variation risks.
As can be observed in Table 1, the production cost was R$ 66.00 per bag, meaning that for the producer not to incur a loss, they needed to sell the corn for at least this amount. For this scenario, it was established that the cereal would be sold in the forward market for R$ 72.00 per bag, with an exercise date 120 days ahead, which allowed the producer a profit of R$ 6.00 per bag, equivalent to a profitability of 9.09%.
From the adoption of the second scenario’s guidelines, the producer would be able to protect themselves from a drop in the future price of corn and would guarantee positive profitability. However, if the value of corn exceeded the price agreed upon by the farmer, they would receive nothing beyond the pre-established amount, meaning this scenario would eliminate the risk of loss but would limit gains.
Table 1. Business structure for Scenario 2
| Entry | Unit | Value |
| Production | Withdrawal | 90.000 |
| Production cost | Reais/bag | 66,00 |
| Third-party capital | Percentage | – |
| Financed amount | Real | – |
| Interest rate | Percentage | 3,66 |
| Equity | Percentage | 100,00 |
| Shareholder equity | Real | 5.940.000,00 |
| Interest rate | Real | – |
| Total cost | Real/Withdrawal | 66,00 |
| Total investment | Real | 5.940.000,00 |
| Forward sale | Real/Withdrawal | 72,00 |
| Total revenue | Real | 6.480.000,00 |
| Profit | Real | 540.000,00 |
| Return on investment | Percentage | 9,09 |
| Return on equity | Percentage | 9,09 |
Scenario 3 was structured using equity and hedge from the sale of contracts in the options market. As in the first two scenarios, the non-option for third-party capital eliminated the incidence of interest. However, there was an additional cost for the hedge. The options market functions as insurance, by fixing a minimum value; therefore, it can be understood as a tool for price risk management[10].
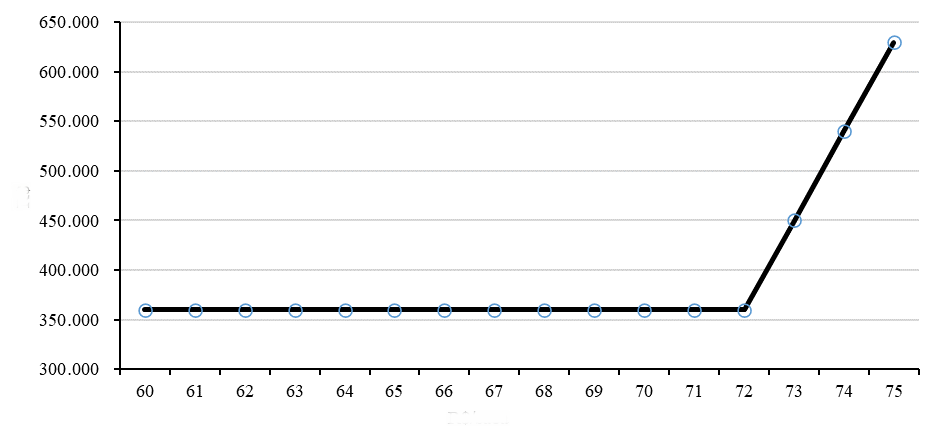
Table 2 shows the expense for protection against price fluctuations, according to the production of 90,000 bags of corn. The producer purchased, for R$ 2.00/bag, the right to sell the corn at the price of R$ 72.00/bag, with an exercise date 120 days after the trading day. With this, the total cost of cereal production was R$ 68.00/bag.
The revenue derived solely from the sale of corn in the physical market could cause losses to the producer, bringing negative results to the activity. However, the hedge (difference between the exercise price and the quotation) would allow for an always positive result, as the producer would have a minimum guaranteed selling price. The result of the operation, which is the sum of the hedge result with the revenue from sales, will always be positive, with a minimum profit of R$ 360,000.00 (which guarantees a minimum profitability of 5.9% on the investment) and no profit limit, as can be seen in Figure 1.
Table 2. Business structure for Scenario 3
| Entry | Unit | Value |
| Production | Withdrawal | 90.000 |
| Production cost | Reais/bag | 66,00 |
| Third-party capital | Percentage | – |
| Financed amount | Real | – |
| Interest rate | Percentage | 3,66 |
| Equity | Percentage | 100,00 |
| Shareholder equity | Real | 6.120.000,00 |
| Interest rate | Real | – |
| Strike price | Real | 72,00 |
| Premium paid for the put option | Real | 2,00 |
| Total cost | Real/Withdrawal | 68,00 |
| Total investment | Real | 6.120.000,00 |
Source: Elaborated by the authors.
In addition to Scenario 3 protecting the producer from the risks of loss in the activity, it also offered the benefit that, should the corn price appreciate beyond expectations, it would be possible to take advantage of the rise and obtain higher remuneration for the product.
In a real situation, where the person’s data was anonymized to ensure confidentiality, a producer decided to take out insurance against possible negative fluctuations in the price of corn, to protect 2,000 bags. The operation was carried out on 08/12/2022, when a bag of corn was being priced at an average of R$ 88.66, and the producer acquired the right to sell corn at R$ 89.67/bag with an exercise date of 09/16/2022, by paying a premium of R$ 3.21/bag. The total cost of the operation was R$ 6,420.00.
After the 35 days, the period between the hedge execution and the deadline, the average corn price was R$ 89.33/bag, meaning it was advantageous for the producer to exercise their right to sell at the previously agreed price, to guarantee a value R$ 0.34 higher per bag (R$ 680.00 in total). However, considering the premium cost, the producer did not obtain financial advantage with the strategy, given that they invested R$ 6,420.00 for the acquisition of the selling right and had a return of R$ 680.00; however, they fulfilled their objective of guaranteeing a minimum selling price to obtain profit in the corn marketing.
For Scenario 4, the use of third-party capital (bank credit) was considered with a proportion of 50% of the total amount invested. Thus, the financial expense corrected by interest of 3.66%, paid in the operation, was adopted. In this case, no hedge tool was used, as shown in Table 3.
This is the scenario considered riskiest, as the producer borrows money and does not hedge against the possibility of price drops, which can cause significant losses. On the other hand, depending on the circumstances, it is also the context in which the producer can obtain the highest return on invested equity.
Considering the worst selling price (R$ 60.00/bag), the farmer would have a negative profitability on equity of 21.9%, equivalent to a loss of R$ 650,373.30. If the cereal price reached the highest possible level (R$ 75.00), the profitability on invested capital would reach 23.6%, equivalent to R$ 699,626.70, the highest profit among the six scenarios considered in this work.
In the business model of Scenario 5, the investment was divided into two parts, half with bank credit, half with own capital; hedge was used with a forward market sale, guaranteeing a minimum value for the price of the corn to be harvested. With this, interest also composed the cost of production of the cereal, and the hedge would protect the producer against possible negative price variations.
As can be observed in Table 3, the total production cost was R$ 67.23 per bag, of which R$ 1.23 represents the interest paid per bag, totaling R$ 110,373.25 in the period. For this scenario, it was considered that the cereal would be sold in the forward market at R$ 72.00/bag, with an exercise date 120 days ahead, which allowed the producer a net profit of R$ 4.77 per bag, equivalent to a return on equity of 14.47% on the deal.
In Scenario 5, the producer can start the activity with third-party capital and eliminate the risk of price fluctuation, allowing them to boost their results safely, acting conservatively. However, if the value of the corn sack exceeds the value previously agreed upon in the contract, the producer will not be able to sell at the best market price, being limited to R$ 72.00 per sack, eliminating the risk of loss but limiting profits.
Table 3. Operational structure for Scenario 5
| Entry | Unit | Value |
| Production | Withdrawal | 90.000 |
| Production cost | Reais/bag | 66,00 |
| Third-party capital | Percentage | 50,00 |
| Financed amount | Real | 2.970.000,00 |
| Interest rate | Percentage | 3,66 |
| Equity | Percentage | 50,00 |
| Shareholder equity | Real | 2.970.000,00 |
| Interest rate | Real | 110.373,25 |
| Total cost | Real/Withdrawal | 67,23 |
| Total investment | Real | 6.050.373,25 |
| Forward sale | Real/Withdrawal | 72,00 |
| Total revenue | Real | 6.480.000,00 |
| Profit | Real | 429.626,75 |
| Return on investment | Percentage | 7,10% |
| Return on equity | Percentage | 14,47% |
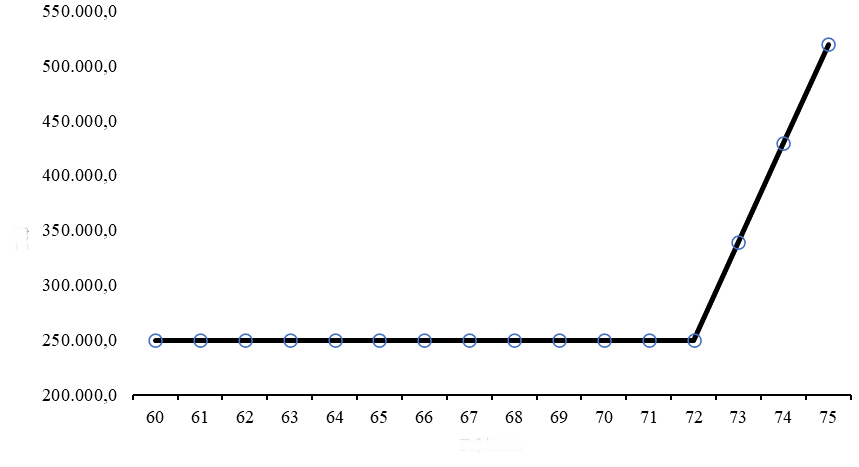
For Scenario 6, the use of third-party capital was considered with a proportion of 50% of the total amount invested and with hedge in the options market. This strategy protects the entire production against price drops, due to the purchase of the right to a minimum sale of R$ 72.00/bag. In this scenario, the premium paid for the put option and the interest from the bank financing impacted the corn production cost, which totaled R$ 69.23/bag. Due to the hedge, in none of the possible cereal selling prices would there be a loss for the producer, not even if the selling price fell below the production cost, because when the spot sale result is negative, the hedge result is positive and ensures that the minimum result is R$ 249,626.70, the equivalent of a minimum profitability of 8.4% on the invested equity, as can be observed in Figure 2.
In this scenario, the producer guarantees a satisfactory return on equity invested and eliminates the risk of loss, should the product’s selling price be too low.
Table 4. Operational structure for Scenario 6
| Entry | Unit | Value |
| Production | Withdrawal | 90.000 |
| Production cost | Reais/bag | 66,00 |
| Third-party capital | Percentage | 50,00 |
| Financed amount | Real | 2.970.000,00 |
| Interest rate | Percentage | 3,66 |
| Equity | Percentage | 50,00 |
| Shareholder equity | Real | 2.970.000,00 |
| Interest rate | Real | 110.373,25 |
| Strike price | Real | 72,00 |
| Premium paid for the put option | Real | 2,00 |
| Total cost (with interest and premium) | Real/Withdrawal | 69,23 |
| Investment value (without interest) | Real | 6.120.000,00 |
| Investment value (with interest) | Real | 6.230.373,25 |
Source: Elaborated by the authors.
The comparative analysis of the scenarios showed that, in situations where the hedge (1 and 4) was not used, the business presented itself as riskier, mainly when capital loan is contracted, as is the case in Scenario 4. However, these same scenarios are the ones that allow the producer to obtain the highest returns, meaning, they are scenarios that bring more risks to the farmer, but they are also the ones that can bring greater returns, as can be analyzed in Tables 5 and 6.
Table 5. Investment profitability comparison according to the proposed scenarios.
| Price/ value/ quote (BRL) | Scenario 1 (%) | Scenario 2 (%) | Scenario 3 (%) | Scenario 4 (%) | Scenario 5 (%) | Scenario 6 (%) |
| 60,00 | -9,1 | 9,1% | 5,9 | -10,7 | 7,1 | 4,0 |
| 61,00 | -7,6 | 9,1 | 5,9 | -9,3 | 7,1 | 4,0 |
| 62,00 | -6,1 | 9,1 | 5,9 | -7,8 | 7,1 | 4,0 |
| 63,00 | -4,5 | 9,1 | 5,9 | -6,3 | 7,1 | 4,0 |
| 64,00 | -3,0 | 9,1 | 5,9 | -4,8 | 7,1 | 4,0 |
| 65,00 | -1,5 | 9,1 | 5,9 | -3,3 | 7,1 | 4,0 |
| 66,00 | 0,0 | 9,1 | 5,9 | -1,8 | 7,1 | 4,0 |
| 67,00 | 1,5 | 9,1 | 5,9 | -0,3 | 7,1 | 4,0 |
| 68,00 | 3,0 | 9,1 | 5,9 | 1,2 | 7,1 | 4,0 |
| 69,00 | 4,5 | 9,1 | 5,9 | 2,6 | 7,1 | 4,0 |
| 70,00 | 6,1 | 9,1 | 5,9 | 4,1 | 7,1 | 4,0 |
| 71,00 | 7,6 | 9,1 | 5,9 | 5,6 | 7,1 | 4,0 |
| 72,00 | 9,1 | 9,1 | 5,9 | 7,1 | 7,1 | 4,0 |
| 73,00 | 10,6 | 9,1 | 7,4 | 8,6 | 7,1 | 5,5 |
| 74,00 | 12,1 | 9,1 | 8,8 | 10,1 | 7,1 | 6,9 |
| 75,00 | 13,6 | 9,1 | 10,3 | 11,6 | 7,1 | 8,3 |
Table 6. Profitability comparison on equity in the proposed scenarios.
| Price/ value/ quote (BRL) | Scenario 1 (%) | Scenario 2 (%) | Scenario 3 (%) | Scenario 4 (%) | Scenario 5 (%) | Scenario 6 (%) |
| 60,00 | -9,1 | 9,1 | 5,9 | -21,9 | 14,5 | 8,4 |
| 61,00 | -7,6 | 9,1 | 5,9 | -18,9 | 14,5 | 8,4 |
| 62,00 | -6,1 | 9,1 | 5,9 | -15,8 | 14,5 | 8,4 |
| 63,00 | -4,5 | 9,1 | 5,9 | -12,8 | 14,5 | 8,4 |
| 64,00 | -3,0 | 9,1 | 5,9 | -9,8 | 14,5 | 8,4 |
| 65,00 | -1,5 | 9,1 | 5,9 | -6,7 | 14,5 | 8,4 |
| 66,00 | 0,0 | 9,1 | 5,9 | -3,7 | 14,5 | 8,4 |
| 67,00 | 1,5 | 9,1 | 5,9 | -0,7 | 14,5 | 8,4 |
| 68,00 | 3,0 | 9,1 | 5,9 | 2,3 | 14,5 | 8,4 |
| 69,00 | 4,5 | 9,1 | 5,9 | 5,4 | 14,5 | 8,4 |
| 70,00 | 6,1 | 9,1 | 5,9 | 8,4 | 14,5 | 8,4 |
| 71,00 | 7,6 | 9,1 | 5,9 | 11,4 | 14,5 | 8,4 |
| 72,00 | 9,1 | 9,1 | 5,9 | 14,5 | 14,5 | 8,4 |
| 73,00 | 10,6 | 9,1 | 7,4 | 17,5 | 14,5 | 11,4 |
| 74,00 | 12,1 | 9,1 | 8,8 | 20,5 | 14,5 | 14,5 |
| 75,00 | 13,6 | 9,1 | 10,3 | 23,6 | 14,5 | 17,5 |
The scenarios in which risk management tools were used (2, 3, 5, and 6) offered more security to the producer, as they eliminated the chance of loss at the time of corn sale, but also had the potential to reduce possible gains. Despite the uncertainties and results that vary according to market movement, hedging proved to be efficient in managing price fluctuations, ensuring the coverage of all production costs, even without increasing revenue[11,12]. Therefore, this strategy is of great importance for people involved in the production and commercialization of grains and derivatives[13].
The analysis of the simulation results for the different scenarios made it possible to visualize the advantages and disadvantages of using hedge in the forward and options market, using own capital and third-party capital (bank credit). By opting for hedge, the producer increases their costs and acknowledges the possibility of lower profit in the activity, in exchange for a sales price guarantee that brings positive profitability to the business. The acquisition of credit through third-party capital can bring greater risks to the activity, however, it boosts results and brings more profitability on the own capital invested.
Given the above, it was found that the use of hedge tools to ensure better marketing prices brings benefits to agribusiness, however, they must be analyzed according to each situation and producer profile, to define the best strategy for the crop to be cultivated through the variation of prices during planting and harvesting.
References
[1] Centro de Estudos Avançados em Economia Aplicada (CEPEA). 2023. PIB do Agronegócio Brasileiro. Disponível em: https://www.cepea.esalq.usp.br/br/pib-do-agronegocio-brasileiro.aspx. Acesso em: 20 abr. 2023.
[2] Lima J. G.; Pozo O. V. C.; Freitas, R. R.; Mauri, G. N. Startups no agronegócio brasileiro: uma revisão sobre as potencialidades do setor. Brazilian Journal Of Production Engineering. 2017; 3(1): 107-121. Disponível em: https://periodicos.ufes.br/bjpe/article/view/v3n1_10.
[3] Zanella T. P. Leismann E. L. Abordagem da sustentabilidade nas cadeias de commodities do agronegócio brasileiro a partir de sites governamentais. Revista Metropolitana de Sustentabilidade – RMS. 2017; 7(2): 6-19. Disponível em: https://revistaseletronicas.fmu.br/index.php/rms/article/view/938
[4] A Rede Nacional de Informações sobre o Investimento (RENAI). O setor de Agronegócio no Brasil: Histórico e Evolução do Agronegócio Brasileiro. 2015. Disponível em: http://www.mdic.gov.br/sistemas_web/renai/public/arquivo/arq1273158100.pdf. Acesso em: 07 set. 2022
[5] Calegari I. P.; Baigorri M. C.; Freire, F. S. Os derivativos agrícolas como uma ferramenta de gestão do risco de preço. Custos e @gronegócio Online. 2012; 8: Edição Especial: 2-21. Disponível em: http://www.custoseagronegocioonline.com.br/especialv8/Derivativos.pdf.
[6] Brender Filho R.; Callegaro G. Uso de Hedge no mercado da soja no Mato Grosso: análise das praças de Primavera do Leste e Sorriso. Revista em Agronegócio e Meio Ambiente – Rama. 2022; 15(4): 1-19. DOI: 10.17765/2176-9168.2022v15n4e9856.
[7] Liquitay L. M. P. Administre o risco de preços pecuários: um guia prático para o hedge de sucesso. Bebedouro/SP: Agrofatto; 2020.
[8] Hull J. Options, futures, and other derivatives. 9ed. Porto Alegre: Brookman: 2016.
[9] Companhia Nacional de Abastecimento (CONAB). Planilhas de custo de produção – Milho. 2022. Disponível em: https://www.conab.gov.br/info-agro/custos-de-producao/planilhas-de-custo-de-producao/itemlist/category/821-milho. Acesso em: 15 out. 2022.
[10] Valaski B.S. Dalchiavon F.C. Mercado de opções como alternativa de gestão do risco de preço para o sojicultor. Revista iPecege. 2018; 4:(4): 16-30. DOI: https://doi.org/10.22167/r.ipecege.2018.4.16.
[11] Castro L.C.; Barboza F. Eficiência do mecanismo do contrato futuro de operações de hedge em derivativos agropecuários: um estudo sobre a cana-de-açúcar. Revista Interdisciplinar Científica Aplicada. 2021; 15(2): 17-35. Disponível: https://portaldeperiodicos.animaeducacao.com.br/index.php/rica/article/view/18043.
[12] Silva L.T. Faria A. F. G. Estatística como ferramenta para mitigar o risco de preço sobre o hedge de boi gordo. Revista iPecege. 2016; 2(1): 40-56. DOI: 10.22167/r.ipecege.2016.1.40.
[13] Martins A.G. Aguiar D.R.D. Efetividade do hedge de soja em grão brasileira com contratos futuros de diferentes vencimentos na Chicago Board of Trade. Revista de Economia e Agronegócio. 2015; 2(4): 449-472. DOI: https://doi.org/10.25070/rea.v2i4.43.
Como citar
Ferreira Neto A.C; Nascimento R.M.; Santos L.C. Gerenciamento de risco no agronegócio: estratégia de hedge para o produtor rural. Revista E&S. 2024; 5: e20230065.
Sobre os autores
Antônio Costa Ferreira Neto , Universidade Federal dos Vales do Jequitinhonha e Mucuri – Departamento de Agronomia – MGC 367, Km 583, 5000 – Alto da Jacuba – CEP 39100-000 – Diamantina/MG, Brasil.
Rodrigo Marques Nascimento, Universidade Federal dos Vales do Jequitinhonha e Mucuri – Departamento de Agronomia – MGC 367, Km 583, 5000 – Alto da Jacuba – CEP 39100-000 – Diamantina/MG, Brasil.
Lucas da Costa Santos, Federal University of the Jequitinhonha and Mucuri Valleys – Agronomy Department – MGC 367, Km 583, 5000 – Alto da Jacuba – CEP 39100-000 – Diamantina/MG, Brazil.