
February 09, 2024
A comparison between investment strategies using neural networks, statistical methods, and momentum
DOI: 10.22167/2675-6528-2023116
E&S 2024, 5: e2023116
Helcio Haruo Sasaki; Murilo Henrique Tank Fortunato
Artificial intelligence (AI) was born in the mid-20th century and caused two “waves” in the market. The first began in 1950, with Alan Turing[1] as the main exponent, prevailing until the mid-1980s, amidst advances in computer science. One of the icons of this generation was the development of chess games for computers. A second wave emerged between the 1990s and 2000s, when there was an inversion in the classic programming rule. Until then, it was necessary to explicitly program all possibilities to obtain answers. In “machine learning,” on the other hand, the goal becomes to train the machine for learning, so that it discovers the rule, as illustrated in Figure 1.
Figure 1. Representation of the “machine learning” model before and after

Source: Elaborated by the authors.
Currently, there are already several practical applications for products that use “machine learning”, such as personal assistants, assertive social media marketing tools, improved diagnostic prediction models, and more recently, self-driving cars (notably Tesla’s), AlphaGo (DeepMind’s AI that defeats humans in the game of Go), and ChatGPT (AI capable of creating content), from OpenAI[2].
Lately, the financial market has begun to incorporate these tools, which have enormous potential for discovering new applications, such as the use of “machine learning” to estimate coffee prices through the “convolutional neural network”[3] network. The objective of this work was to implement “machine learning” techniques to generate alpha in investments, that is, to perform active management by obtaining returns above the “benchmark”. It is important to mention that, in terms of accuracy, while the machine can achieve high levels of correctness in an image classification model, in the financial market the level of correct predictions is more modest. Robert Mercer, one of the founders of the giant investment management company Renaissance Technologies, once said: “we are right 50.75% of the time, but we are 100% sure 50.75% of the time”[4].
A portfolio was structured whose resources were equally distributed among four possible investments. The update was monthly and synthesized a 20-year history. Brokerage costs, execution costs, income tax, nor the possibility of short selling the asset (betting on negative asset returns) were considered, as it is not easily implemented for individual investors.
a) Dollar
The benchmark real price for the dollar was measured by the average quote of three existing funds (Santander Fundo Cambial, Itaú Fundo Cambial, and Bradesco Fundo Cambial). Using only the exchange rate variation does not correctly reflect profitability, as there is remuneration on dollar cash.
b) Ibovespa Stocks
Index with the main companies traded on the Stock Exchange, such as: Petrobras, Vale, Itaú, Bradesco, Santander, Banco do Brasil, B3, WEG and Ambev.
c) Two-year pre-fixed interest investment
Average interpolated rate for the two-year maturity, based on the vertices of interbank deposits traded daily on the Stock Exchange (B3). The choice of a generic maturity avoided the need to consider the decay effect of the paper’s maturity. In this analysis, the investment return was considered based on the financial value (PU):

where: PUi is the present value of the 100 thousand invested; i represents the reference date; dui represents the business days between i and the generic maturity date; and taxai represents the pre-fixed rate negotiated on day i.
d) Five-year fixed-rate investment
Average interpolated rate for the five-year term, based on the vertices of interbank deposits traded daily on the Stock Exchange. The return based on the financial value (PU) was also considered.
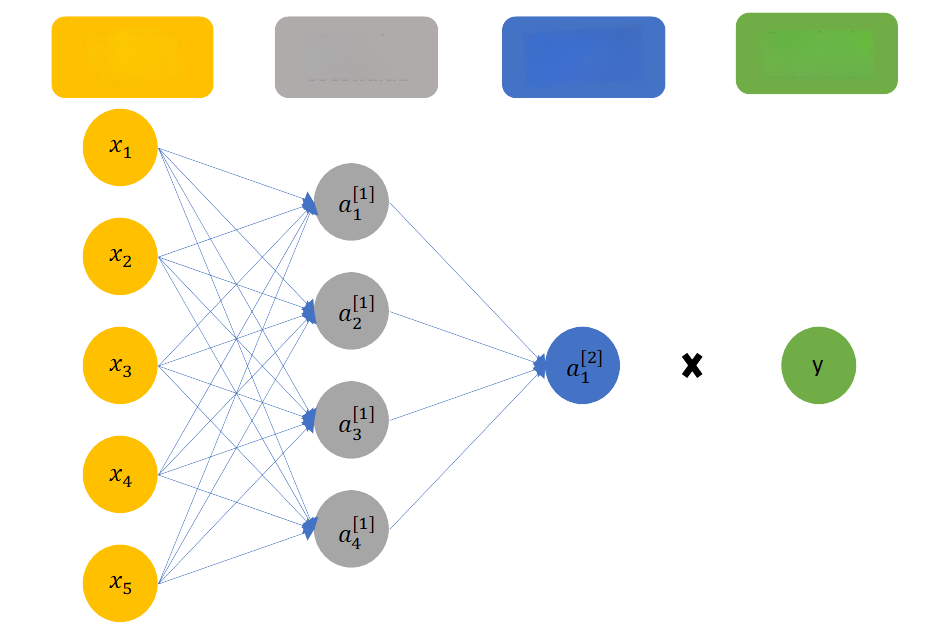
Programming languages — such as R, Java Script, and especially Python — have several neural network packages, like Keras and TensorFlow. According to Chollet[5], these tools have the advantage of being like building blocks, where one can fit layers of “deep learning” functions and use the “pipeline” to order the flow of information within the structure. However, to gain sensitivity to the rationale and results, a neural network was created from scratch, detailed in Figure 2[6]:
Figure 2. Diagram of the proposed neural network
Source: Elaborated by the authors.
In this example, there are five input data, a hidden layer (or intermediate layer) and an output layer (or “output” layer) that contains the estimated result. The superscript reference in brackets ([j]) represents the layer of each neuron; in this case, it only varies between 1 (hidden layer) and 2 (output layer). The subscript reference “i” represents the neuron contained in a given layer. In this case, the hidden layer has four neurons, and the output layer contains only one neuron.
The neuron Zi[j] can be generically described as the result of the weighted “input” by the weight w –(“weight”) added to the bias b[j] (“bias”):

In each of the layers, there is an activation function whose objective is to “turn on” or “turn off” the neuron. This step is important to reduce the risk of error non-convergence, as described in Murray, Abrol and Tanner[7] and Ovalle[8], which would make the model unable to find a solution.
In the hidden layer, the hyperbolic tangent activation function tanh was used, using w[1] to weigh the input data summed with the bias b[1]. In this way, the intermediate layer neuron attempts to estimate the asset return between a rise (+1) or a fall (-1):

In the output layer ai[2] the sigmoid activation function σ was used. Thus, the output layer weights the result of the previous layer ai[1] by the weight w[2] and adds the bias b[2], thus defining whether it was interesting (+1) or not (0) to invest in the asset:

For the error calculation, the “binary cross entropy” equation [9] was used:

where: total error represents the sum of the difference between the estimated value and the realized value; m represents the sample size; ai[2] represents the estimated value resulting from the “output layer”; and Yi represents the observed variable.
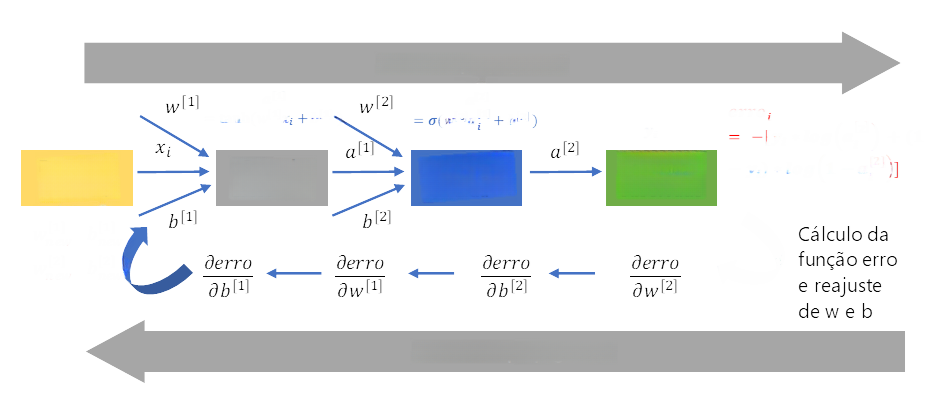
Initially, in the input layer, the values of w[1] and b[1] are random values. The result of multiplying the “inputs” by the weight w[1] is added to the bias b[1], and the final result passes through a logistic activation function. The information flows to the intermediate layer, where the previous result is multiplied by the new weight w[2] and is added to the bias b[2], which are also initially random values. This information flow is called “forward propagation”.
The beauty of the neural network is that, based on the difference between the estimated value and the realized value, a new estimate is made, with a marginal adjustment of the parameters w[j] and b[j] to minimize the deviation in the next iteration. This resembles the process of learning through trial and error, which in neural networks is called “backward propagation”[10].
Figure 3. Information flow within a neural network
Source: Elaborated by the authors.
The correction parameters described in the “backward propagation” of Figure 3 were obtained through the gradient descent optimization method, where the weight correction is defined by:





where: A[2] represents the expected value in the output layer in matrix; Y represents the realized results in matrix form; and A[2]t represents the result of the intermediate layer in transposed matrix.
Subsequently, the partial derivative of the error sensitivity with respect to the bias of the output layer, b[2], was calculated, represented in matrix form by the mean deviation:

Up to this point, the corrections for the weight and bias of the output layer were calculated. The next step was to calculate the weight and bias adjustment for the hidden layer. The sensitivity of the error with respect to the weight in the intermediate layer, w[1], was calculated as follows:

where: W[2]t represents the weights of the final layer in transposed matrix; and Xt represents the input data in transposed matrix.
Subsequently, the partial derivative of the error with respect to the bias in the intermediate layer was calculated, b[1]:

where: W[2]t represents the weights of the final layer in transposed matrix.
The matrix equations (10) and (11) from the output layer and equations (12) and (13) from the intermediate layer were encoded in Python.
All strategies used 20 years of monthly history, in the period from January 2002 to December 2022.
a) “Long-only” strategy (passive strategy)
The resources were equally divided among four assets: stocks, dollar, two-year interest rates, and five-year interest rates, with no changes during the analysis period.
b) Impetus
Momentum represents the tendency for price increases to perpetuate in the coming periods, just as a fall is generally preceded by further corrections. In this sense, the 2008 Nobel laureates in economics, Fama and French[12], stated that momentum is a “premier market anomaly”, that is, a strategy that generates above-average returns. Subsequent works have confirmed this anomaly, including in the markets of emerging countries[11].
Antonacci[13] went further and proposed a simple but effective strategy on the momentum of assets: if an asset’s return is higher than the risk-free rate, it is applied to that asset for the next period. If the return is lower, it is applied to the risk-free asset.
c) 21-period Momentum
The same logic as the strategy described in the previous item was applied, but a moving average of the returns of the last 21 months was used, a period chosen because it is common in technical analysis.
d) Linear regression [“ordinary least squares (OLS)”]
In this strategy, the coefficients of the lagged linear regression were calculated over a period, as shown in the example for the dollar return:

where: USDM represents the dollar return in period M; USDM-1: is the dollar return in period M-1; IBOVM-1 is the Ibovespa return in period M-1; PRE2YM-1 represents the return of the investment in two-year fixed-rate interest in period M-1; PRE5YM-1 is the return of the investment in five-year fixed-rate interest in period M-1; CDIM-1 is the return of the Interbank Deposit Certificate (CDI) in period M-1; and βs represent the regression coefficients.
As detailed below, the neural network model uses 80% of the data for training. To maintain equality regarding sample size, the same data cut was used to estimate the linear regression coefficients. Thus, for a given month “M”, 80% of the previous observations (17 months) were used to estimate the regression coefficients; the remaining 20% of the observations (four months), as a test sample.
If the estimate of the next period’s return were positive, the resources would be applied to this asset for the following month. Otherwise, the resources would be applied to the risk-free CDI asset.
e) Logistic regression
In the same way that happened with linear regression, the coefficients of logistic regression were estimated based on a moving window of 21 periods: 80% of the sample observations were used to determine the regression coefficients, and the remaining 20% as a test. To define whether the next return would be high (1) or low (0), a cutoff of 0.50 was used as the limit.
f) Neural network
A hidden layer of four neurons with hyperbolic tangent activation and one neuron in the output layer with logistic activation was implemented, as detailed in Figure 2.
The moving window contained the return of the last 21 months; 80% of the previous observations (17 months) were used to estimate the “weight” and “bias” parameters, and the remaining 20% for testing. The learning rate was 0.50, with 1,000 iterations (“epochs”).
If the expected return were positive, the model would apply resources to this asset for the next month. If the expected return were negative, the model would apply resources to the CDI.
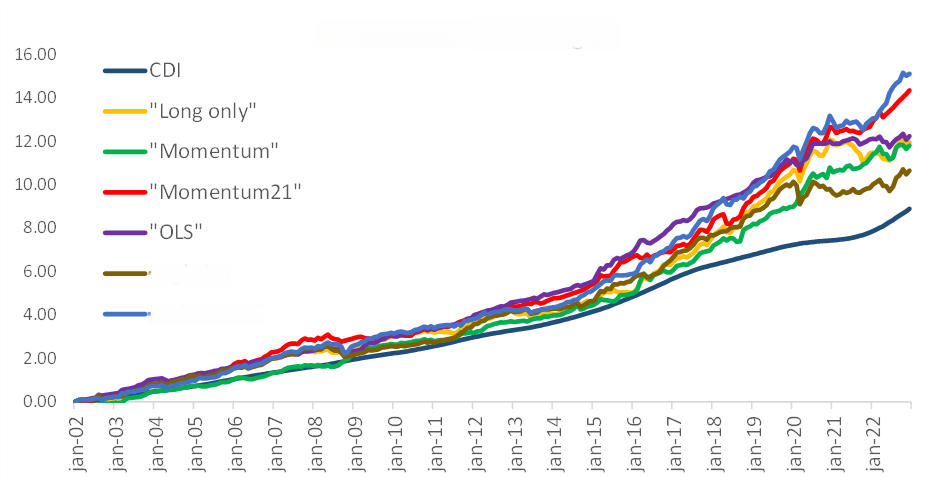
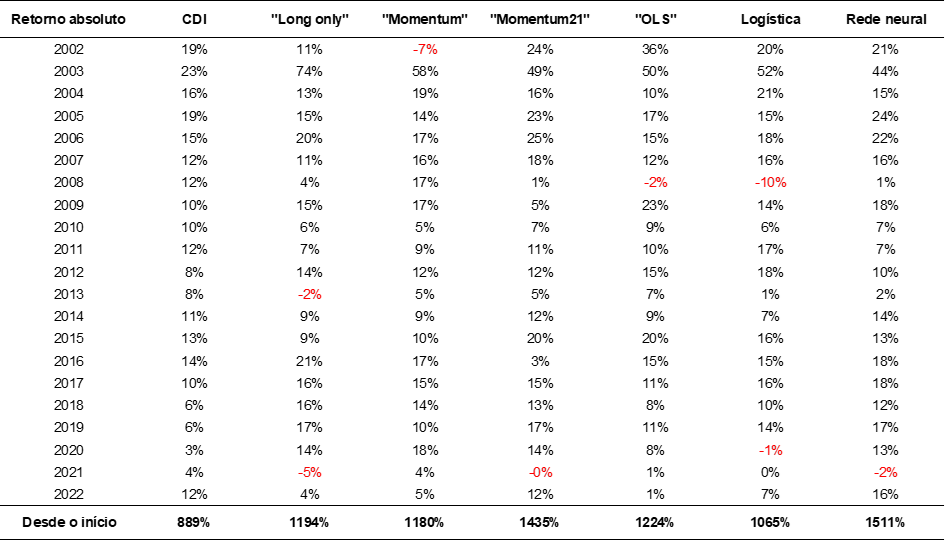
Figure 4 shows the accumulated result of 20 years of the six investment strategies and the “benchmark”, which is the accumulated CDI in the period. Table 1 shows the detailed results by year and strategy.
Figure 4. Monthly accumulated result of the 6 strategies and the accumulated CDI
Source: Elaborated by the authors.
Table 1. Annual result of the different strategies
Source: Elaborated by the authors.
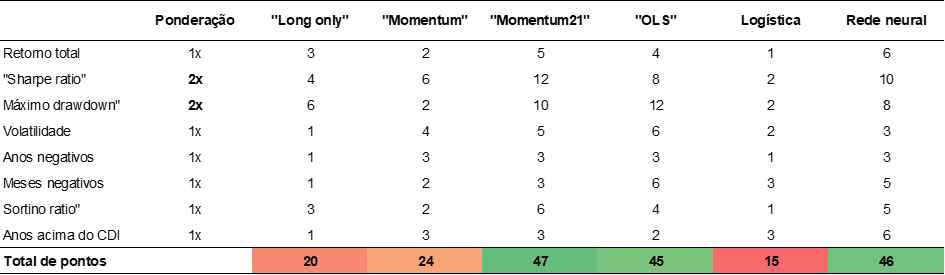
In order to choose the best strategy, eight criteria were evaluated: absolute total return; “sharpe ratio” (return adjusted for volatility); “maximum drawdown” (maximum monthly loss); volatility (standard deviation); number of negative years; number of negative months; “sortino ratio” (return adjusted for downside volatility); and number of years above the CDI.
Table 2. Evaluation measures of the different strategies
Source: Elaborated by the authors.
For each criterion, scores from 1 to 6 were assigned, with 6 being the best and 1 the worst. For the “sharpe ratio” and “maximum drawdown” indicators, there was a double weight weighting, due to their importance for investment evaluation.
Table 3. Ranking of the best strategy (the higher the score, the better)
Source: Elaborated by the authors.
Although the neural network strategy has the best performance, with a return of 1,511% in 20 years, the model that had the best score was momentum with 21 periods, with superior performance in items such as “sharpe ratio”, “maximum drawdown”, “sortino ratio” and volatility.
In the construction of the neural network strategy, variability was observed in the results depending on the “inputs” used, such as learning rate, number of neurons, and number of simulations. Possibly due to lack of model convergence or data “over-fitting”[14]. Table 5 contains the sensitivity of the result.
Table 5. Risk measures of different neural network strategies
Source: Elaborated by the authors.
The second negative point of neural networks was the lack of sensitivity to how input variables affect the outcome. In the case of a regression, the sensitivity of how explanatory variables affect the outcome can be observed by the regression coefficients, and, in the case of the momentum strategy, the sensitivity can be visualized by the simple average of the last returns.
In any case, all modeling can incur errors caused by the lack of asset liquidity, surprises in the disclosure of indicators, for example, and even by the more intense use of algorithms that operate in the financial market, as “algo trading” (“robots”) can increase the level of noise in prices: if an asset rises unduly due to low liquidity, for example, the computer may notice the price increase and send a buy order, which can further displace the asset’s price.
However, perhaps the main factor distorting prices is the behavioral bias of investors, which tends to oscillate between the extremes of greed and fear[15], which favored the momentum strategy. The neural network investment strategy with only one hidden layer and one output layer, in turn, presented a very interesting result and surpassed the absolute profitability of the other strategies. However, when considering other performance metrics, such as risk-adjusted return and volatility, the momentum strategy with 21 periods was the winning allocation in the observed 20-year period. This simple strategy also had two advantages over the neural network:
I. simplicity of the decision model, as the choice was for the asset with profitability higher than that of the CDI on average over the last 21 months, given the black box of “machine learning” results, which, because they cannot be reconstructed, demand trust in the model’s “output”;
II. ease in the interpretation and predictability of the decision criterion (an asset that is rising should maintain its trend), compared to the lack of sensitivity to how each variable influences the decision of the neural network model.
It is important to add that the results of the neural networks presented some instability in the simulations depending on the parameters used, which generates insecurity regarding the model’s stability.
Finally, as this field of knowledge is recent, it is important to look closely at improvements in neural network models. At the same time, humility is also necessary to recognize that there may be limitations of “machine learning” models, particularly in the financial market, since investor behavior can sometimes seem more erratic than rational, alternating between moments of euphoria and panic.
References
[1] Turing A. Computing Machinery and Intelligence. MIND A Quartely review of Psycholology and Philosophy. 1950; 59(236): 433-460. Disponível em: https://psycnet.apa.org/doi/10.1093/mind/LIX.236.433. Acesso em: 29 set. 2023.
[2] Harari Y. ‘Sapiens’ author says AI is an alien threat that could wipe us out: ‘Instead of coming from outer space, it’s coming from California. Fortune. 2023. Disponível em: https://fortune.com/2023/09/12/sapiens-author-yuval-noah-harari-ai-alien-threat-wipe-out-humanity-elon-musk-steve-wozniak-risk-cogx-festival/. Acesso em: 29 set. 2023.
[3] Santos J.A.A. Previsão do preço do café arábica: uma aplicação de redes neurais CNN-BLSTM. Research, Society and Development. 2022; 11(3): 1-11. DOI: https://doi.org/10.33448/rsd-v11i3.26101.
[4] Zuckerman G. O Homem que decifrou o Mercado. Rio de Janeiro (RJ): Alta Books; 2020.
[5] Chollet, F. Deep Learning with Python. Shelter Island (NY): Manning; 2018. 384 p.
[6] Verma A. Shallow Neural Net from Scratch Using R. RPubs. 2020. Disponível em: https://rpubs.com/theairbend3r/bin-classification-small-nnet-scratch-r. Acesso em: 29 set. 2023.
[7] Murray M.; Abrol V.; Tanner J. Activation Function Design For Deep Networks: Linearity And Effective Initialisation. Applied and Computational Harmonic Analysis. 2021; 59: 117-154. Disponível em: https://arxiv.org/pdf/2105.07741.pdf. Acesso em: 29 set. 2023.
[8] Ovalle D. The purpose of activation functions in the neural network. Medium. 2020. Disponível em: https://medium.com/@1087/the-purpose-of-activation-functions-in-the-neural-network-be08f81b7c32. Acesso em: 29 set. 2023.
[9] Yathish V. Loss Functions and Their Use In Neural Networks. Medium. 2022. Disponível em: https://towardsdatascience.com/loss-functions-and-their-use-in-neural-networks-a470e703f1e9. Acesso em: 29 set. 2023.
[10] Patel J. Derivation of Backpropagation in Neural Network. Youtube. 2021. Disponível em: https://www.youtube.com/watch?v=URJ9pP1aURo&t=190s. Acesso em: 29 set. 2023.
[11] Blitz D.; Hanauer M.; Vidojevic M. The idiosyncratic momentum anomaly. International Review of Economics & Finance. 2020; 69: 932-957. Disponível em: https://www.sciencedirect.com/science/article/abs/pii/S1059056020300927. Acesso em: 29 set. 2023.
[12] Fama, E.F.; French, K.R. Dissecting Anomalies. The Journal of Finance, 2008. Disponível em: https://doi.org/10.1111/j.1540-6261.2008.01371. Acesso em 29 set. 2023.
[13] Antonacci G. Dual Momentum Investing. Nova York (NY): Mc Graw Hill Education; 2015. 256 p.
[14] Dixon M.; Klabjan D.; Bang J.H. Classification-based financial markets prediction using deep neural networks. Journal Algorithmic Finance. 2017; 6(3-4): 67-77. Disponível em: https://content.iospress.com/articles/algorithmic-finance/af176. Acesso em: 29 set. 2023.
[15] Kindleberger C.P.; Aliber, R.Z. Manias, Panics, and Crashes: A History of Financial Crises. Palgrave MacMillan 7th Edition. 2015.
Como citar
Sasaki H.H.; Fortunato M.H.T. Uma comparação entre estratégias de investimento utilizando redes neurais, métodos estatísticos e momentum. Revista E&S. 2024; 5: e2023116.
Sobre os autores
Helcio Haruo Sasaki, Banco Santander, Avenida Juscelino Kubitschek, 2235 – Vila Olímpia – CEP 04543-011 – São Paulo/SP, Brasil.
Murilo Henrique Tank Fortunato , Instituto de Pesquisa e Educação Continuada em Economia e Gestão de Empresas – Pecege – Rua Cezira Giovanoni Moretti, 580 – Santa Rosa – CEP 13414-157 – Piracicaba/SP, Brasil.
Download link: PDF