
Business
June 16, 2025
Hierarchical process for indivisible load projects
DOI: 10.22167/2675-6528-2024066
E&S 2025, 6: e2024066
Vanderson de Oliveira Arrais e Rodolfo Ribeiro
In large countries, such as Brazil, road transport stands out as one of the most agile and flexible options for accessing cargo, which favors connectivity between different regions, including the most remote ones[1]. By choosing road transport as the main transportation alternative, the country ended up disregarding other modes that could have been more efficiently explored[2].
By 2024, it was estimated that road transport would be responsible for more than 60% of the cargo transported[1]. With the confirmation of this projection, highways currently account for 62.2% of the total cargo transported[3]. According to Souza and Markoski[2], several works are underway or in the planning phase as a result of the Growth Acceleration Program (PAC), an initiative implemented by the Federal Government starting in 2007.
These works aim, primarily, to improve the infrastructure, with the intention of boosting the productive sectors. In addition to logistics, the interventions also cover energy, social, and urban infrastructure[2]. For different types of cargo, varied tariffs and transport conditions may be applied. For example, special conditions may be established for the transport of indivisible loads, given that this process demands complex logistics, which requires coordination between various regulatory bodies[1].
An indivisible load is one that, due to its characteristics, exceeds the regulatory weight or dimension limits when loaded, or that requires transport in specific vehicles, equipped with adequate capacity, dimensions, structure, suspension, and steering[4]. Examples of indivisible loads include transformers, reactors, machinery for civil construction, agricultural and industrial use, among others[4].
Due to the nature of these loads, their transport implies high-risk operations, which demand adequate logistics. This includes the use of specific equipment and the action of professionals with technical competence to execute this type of operation[1]. In view of this, it is important to develop an efficient planning process, as logistical planning that prioritizes the satisfaction of market demands contributes significantly to maintaining organizational control[5].
The preparation for the execution of an operation with indivisible loads requires a detailed analysis of the project, which includes the consideration of road infrastructure, with the objective of identifying viable routes and mapping possible critical points[6]. A project is a temporary undertaking intended to create a unique product, service, or result. Its temporality implies a defined beginning and end, either for the set of project activities or for one of its specific phases[7].
However, it is important to emphasize that the temporality of a project does not necessarily imply a short duration, as projects can extend over varied periods, from weeks to several years. Furthermore, even after their completion, the products and results of a project can endure for a significant period[8]. Considering the importance of planning the action strategy in the indivisible load project market, this study aims to investigate how a company operating in this field establishes a system for prioritizing its projects.
For the development of the research, data were collected from a company specializing in indivisible load transport and large equipment rental, whose headquarters are located in the Southeast region. The research methodology used was the case study, which, according to Gil[9], is characterized by the analysis of one or a few cases, with the aim of achieving an in-depth and comprehensive understanding. The roadmap for fulfilling the objective of this research is presented in Table 1.
Table 1. Survey of information for study analysis
| Objective | Field Procedures | Detailing of the necessary information | Consulted sources |
| Investigate how a company establishes the prioritization of indivisible cargo transportation projects | Analyze literature on project prioritization | Survey of selection and prioritization criteria for projects | Value analysis: continuous improvement process[10] Product development management: a reference for process improvement[11] |
| xxxxGathering xxxxxinformation about customers | Main active clients Field of activity | Internal organizational information | |
| xxxGathering information xxxxxxfrom projects | Volume of closed projects Revenue generated | Internal organizational information |
For sampling criteria, data were collected from 13 of the main clients, with negotiation of projects closed in the first quarter of 2022 and the first quarter of 2023. Information was gathered on the volume of projects per client, their respective business segment, and the revenue generated in the studied period. For this study, a total of 24 projects were analyzed across 5 business segments: 13 projects closed in the first quarter of 2022 and 11 projects closed in the first quarter of 2023.
For the data analysis, the collected information was systematically organized into tables. The weights assigned to the evaluation of the criteria were determined by the studied company, with the assignment of values 1, 3, and 5, according to the relative importance of each criterion presented in a table. Subsequently, the relevant percentages were gathered for analysis and the creation of a matrix that presented the results of the project prioritization.
Mudge Diagram
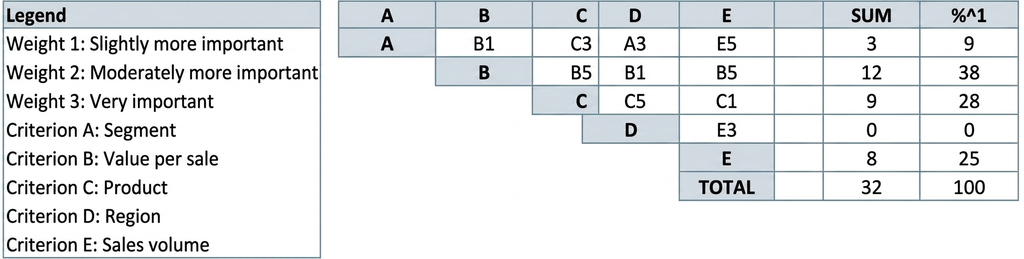
Mudge’s diagram, frequently used in functionality assessment, prioritizes functions according to their importance[10]. In this diagram, valuation is performed by comparing objectives in pairs, generating a hierarchy that indicates the relative degree of importance between them[11]. According to Pagnusati[12], the process involves defining the criteria to be used as the basis for prioritization, the selection of which is determined by the specific requirements of each situation.
The diagram is structured in a triangular matrix format, in which the elements of each row are compared with the elements of the columns, with the assignment of a letter for each criterion[12]. Together with the letters, according to Filho[10], an importance value is assigned, expressed by the weights: 1: slightly more important; 3: moderately more important and 5: much more important. From the definition of the criteria and assigned weights, the Mudge diagram is applied, as shown in Figure 1, with the objective of establishing the hierarchy based on the degree of relative importance.
Source: Original research results.
Note. %¹: In percentage.
The criteria were organized into a matrix and summed up in order to identify the percentage of importance of each one, according to the assigned weights. The result of the analysis obtained through Mudge’s diagram is used as a weight in the process of hierarchizing and prioritizing projects[12].
Hierarchy process
The company object of this study specializes in the rental of large-scale equipment and the provision of indivisible cargo transportation services, and has over 30 years of experience in the project market. Its headquarters are located in the Southeast region of Brazil, with branches distributed in the Southeast and Northeast regions. The clients of this company, the focus of this research, demand specialized logistics due to the characteristics related to the dimensions and weights of the equipment they need to transport. These clients operate in various sectors of the economy.
The customer segments may cover different areas, as demonstrated
in Table 2.
Table 2. Customer segments
| Area of operation | Description | Key activities |
| Energy | Manufacturing of equipment to serve the industry, wind farms, among others | Transformers and reactors |
| Industry and machinery | Heavy machinery manufacturers | Tractors, backhoe loaders, cranes |
| Oil and gas | From manufacturers to companies at the end of the supply chain that require specialized logistics for the transport of modules and accessories for application in the oil industry | Christmas tree¹, gas turbine skid, torpedo pile |
| Civil construction | Manufacturers and engineering companies that require specialized equipment for application in civil infrastructure works | Precast beams |
| Import and export | Companies that act as freight forwarders and serve the domestic and international markets through the import and export of equipment | Locomotives, industrial skids |
Note. ¹Christmas tree: set of valves and equipment installed at the top of an oil or natural gas well, used for flow and operation control.
In the process of serving projects, a customer assessment is performed, in which criteria such as the duration of the commercial relationship with the client in question are considered. This aspect integrates the credit release process conducted by the financial department, in addition to the client’s size and the revenue generated by the projects, based on commercial history.
For each of the criteria, three value ranges are determined, with the assignment of a specific weight for each range, as shown in Table 3, used in the analysis for project prioritization.
Table 3. Customer profile evaluation criteria
| Criteria | Weight 1 | Weight 3 | Weight 5 |
| Client size | Small scale | Medium-sized | Large scale |
| Relationship time | 0 to 1 year | 1 year to 5 years | Over 5 years |
| Revenue generated in reais (BRL) | 0,00 – 250.000,00 | 250.001,00 – 750.000,00 | >= 750.001,00 |
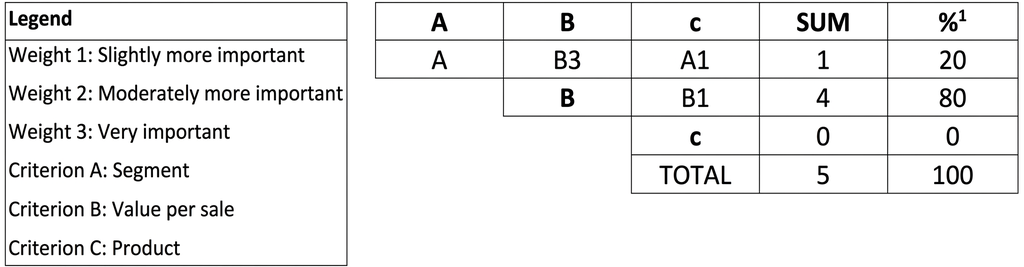
With the defined criteria and weights, based on the prospecting of customer information and historical data of closed deals, the analysis is performed using Mudge’s diagram, as shown in Figure 2, to identify which criterion has greater relevance in relation to the others in the process of hierarchization and decision-making.
Source: Original research results.
Note. %¹: In percentage.
When applying the information from the customer profile assessment in the Mudge diagram, as per Table 4, it is observed that the revenue generated presents greater relevance in relation to the other criteria, with the highest percentage weight, followed by customer size and relationship duration. This finding suggests that the company prioritizes the maximization of financial returns as a determining factor in decision-making related to projects, which may indicate a strategic orientation focused on the organization’s growth and financial sustainability.
To investigate how the company establishes its hierarchy, data on revenue, project volume, and business segment were evaluated, referring to the first quarter of 2022 and the first quarter of 2023.
As shown in Table 1, in the first quarter of 2022, a larger volume of projects for the energy segment is observed, with 38.46% of the total projects closed, which corresponds to 76.88% of the revenue generated. This data suggests that the efforts and resources employed in project execution do not necessarily guarantee financial return — as exemplified by the civil construction segment, which represents 30.77% of the total projects, but contributes only 3.06% of the revenue generated. Thus, the energy sector achieves better results, possibly due to its strategic relevance and higher potential for financial return. This analysis can support future decisions regarding resource allocation and project prioritization within the company.
Table 1. Volume of closed projects and revenue generated by business segment for the 1st quarter of 2022
| Number of closed projects | Revenue generated (BRL¹) | Area of operation | Closed projects (%²) | Revenue generated (%²) |
| 2 | 782.000,00 | Import and export | 15,38 | 18,75 |
| 1 | 6.823,09 | Oil and gas | 7,69 | 0,16 |
| 5 | 3.207.185,55 | Energy | 38,46 | 76,88 |
| 4 | 127.686,68 | Civil construction | 30,77 | 3,06 |
| 1 | 48.000,00 | Industry and machinery | 7,69 | 1,15 |
| 13 | 4.171.695,32 | – | 100,00 | 100,00 |
Note. BRL¹: In Brazilian Reais; %²: In percentage.
As shown in Table 2, the evaluation of the weights assigned in the profile analysis demonstrates that customers in the energy segment have a higher weight. This result reveals the strategic focus on developing business relationships with companies in this specific sector, with a higher return in generated revenue, which according to Cannon and Perreault[13], effective relationships between companies and their key segments enhance financial performance, through cost reduction and increased collaboration and predictability in the supply chain.
Table 2. Assessment of the profile of main clients by business segment for the 1st quarter
of 2022
| Customer | Area of operation | Customer size | Relationship time | Generated Revenue | Weighted average |
| Client 007 | Import and export | 3 | 5 | 5 | 4,3 |
| Client 008 | Oil and gas | 5 | 5 | 1 | 3,7 |
| Client 009 | Energy | 5 | 5 | 5 | 5,0 |
| Client 010 | Civil construction | 3 | 3 | 1 | 2,3 |
| Client 011 | Civil construction | 1 | 1 | 1 | 1,0 |
| Client 012 | Industry and machinery | 3 | 3 | 1 | 2,3 |
| Client 013 | Energy | 5 | 5 | 3 | 4,3 |
When evaluating the weights assigned based on generated revenue, as shown in Table 3, a clear trend of targeting energy segment clients is observed. This analysis indicates a strategic preference for clients operating in this sector, possibly due to more profitable business opportunities. Such a trend suggests an orientation towards consolidating the company as a prominent partner in this market.
Table 3. Revenue generated by customer and business segment for the 1st quarter of 2022
| Customer | Area of operation | Revenue generated (BRL¹) | Revenue generated (%²) | Weight |
| Client 009 | Energy | 2.871.253,98 | 68,83 | 5 |
| Client 007 | Import and export | 782.000,00 | 18,75 | 5 |
| Client 013 | Energy | 335.931,57 | 8,05 | 3 |
| Client 011 | Civil construction | 68.436,68 | 1,64 | 1 |
| Client 010 | Civil construction | 59.250,00 | 1,42 | 1 |
| Client 012 | Industry and machinery | 48.000,00 | 1,15 | 1 |
| Client 008 | Oil and gas | 6.823,09 | 0,16 | 1 |
| Total sales (vendas)/ Invoicing (emissão de doc) | – | 4.171.695,32 | 100,00 | – |
Note. BRL¹: In Brazilian Reais; %²: In percentage.
When evaluating the scenario of the first quarter of 2023, with the objective of verifying demand consistency, it is observed that the segment with the highest representation in project volume and revenue was industry and machinery, as shown in Table 4, which accounted for 45.45% of closed projects and corresponded to 53.09% of the revenue generated — an increase compared to the previous quarter. The energy segment, in turn, showed a slight reduction in project volume, retained 36.36% of the total, but suffered a significant drop in revenue generated, ending the quarter at 29.08% of the total generated. This analysis highlights market dynamics and fluctuations in project demand across different segments, which may impact the company’s prioritization and resource allocation strategies in the future.
Table 4. Volume of closed projects and revenue generated by business segment for the 1st quarter of 2023
| Number of closed projects | Revenue generated (BRL¹) | Area of operation | Closed projects (%²) | Revenue generated (%²) |
| 2 | 206.000,00 | Import and export | 18,18 | 17,82 |
| 4 | 336.128,59 | Energy | 36,36 | 29,08 |
| 5 | 613.654,35 | Industry and machinery | 45,45 | 53,09 |
| 11 | 1.155.782,94 | – | 100,00 | 100,00 |
Note. BRL¹: In Brazilian Reais; %²: In percentage.
It is noted that, as highlighted in Table 5, when evaluating the weights assigned based on generated revenue, this criterion stands out in the industry and machinery segment, even when the relationship time and client size are greater in other segments, such as energy. This demonstrates that the generated revenue criterion prevails over the others, which requires a careful evaluation of market dynamics along with the company’s adopted prioritization strategies. This observation reinforces the need for a more in-depth analysis of market conditions and project demands in different segments, in order to optimize resource allocation and maximize the company’s financial returns.
Table 5. Customer Assessment of the main clients’ profile by business segment for the 1st quarter
of 2023
| Customer | Area of operation | Customer size | Relationship time | Revenue generated (%¹) | Weighted average |
| Client 001 | Import and export | 1 | 1 | 1 | 1,0 |
| Client 002 | Import and export | 3 | 5 | 1 | 3,0 |
| Client 003 | Energy | 5 | 5 | 1 | 3,7 |
| Client 004 | Industry and machinery | 3 | 3 | 1 | 2,3 |
| Client 005 | Energy | 5 | 5 | 1 | 3,7 |
| Client 006 | Industry and machinery | 1 | 1 | 3 | 1,7 |
Note. %¹: In percent.
When evaluating the weight compared to the revenue generated, as highlighted in Table 6, it is observed that customers from the industry and machinery segment have greater representation in the results, which may indicate the impact of seasonality in this specific sector. This analysis highlights the importance of considering external factors — such as seasonal variations in demand and economic activity — when interpreting results and making strategic decisions related to project prioritization and resource allocation.
Table 6. Revenue generated by customer and business segment for the 1st quarter of 2023
| Customer | Area of operation | Revenue generated (BRL¹) | Revenue generated (%2) | Weight |
| Client 006 | Industry and machinery | 492.631,62 | 42,62 | 3 |
| Client 002 | Import and export | 190.800,00 | 16,51 | 1 |
| Client 005 | Energy | 170.000,00 | 14,71 | 1 |
| Client 003 | Energy | 166.128,59 | 14,37 | 1 |
| Client 004 | Industry and machinery | 121.022,73 | 10,47 | 1 |
| Client 001 | Import and export | 15.200,00 | 1,32 | 1 |
| Sum | – | 1.155.782,94 | 100,00 | – |
Note. BRL¹: In Brazilian Reais; %²: In percentage.
This more comprehensive understanding of market dynamics proves fundamental for effective and adaptive management of the company’s operations. Throughout this study, it was observed that prioritizing projects based on generated revenue tends to have greater relevance over other criteria. However, this approach should not be considered in isolation, as according to Pagnusati[12], it is important to consider whether the results are in agreement with the project strategies. The seasonality of demands and fluctuations between different segments are variables that directly influence the company’s performance and, therefore, must be carefully monitored and analyzed.
The use of project prioritization tools, such as the Mudge diagram, combined with continuous market trend analysis, allows the company greater adaptability to changes in the business environment. A structured prioritization process based on historical data, along with a strategic vision of external factors, constitutes an essential competitive differential for efficient project management, resulting in better long-term financial and operational results.
The study shows that the prioritization process established by the company for its projects can be influenced by demand seasonality. As demonstrated, it is necessary to monitor project demand in different segments in order to adapt resource allocation and optimize results. The literature highlights the importance of understanding the specific requirements of each situation, as observed in the analyzed information. Thus, it becomes fundamental to identify external factors and develop a more comprehensive understanding of market dynamics.
The survey reveals that the revenue generated criterion has a greater influence on the results, compared to other criteria, such as size and customer relationship duration, as highlighted by Mudge’s diagram. This suggests that establishing a good relationship with large companies is not sufficient on its own. The use of prioritization data, along with other analyses, is essential for effective management. To perform more comprehensive analyses, capable of identifying the influence of the strategy on other company services, a larger volume of data is required. Due to the limitation of available information, it was not possible to assess whether there are direct impacts on these other services.
References
[1] Pereira, R.D.A. 2016. Logística do transporte de cargas indivisíveis. Revista cientifica UBM. 18(35): 171-189. DOI: 10.52397/rcubm.v0in.35.1260.
[2] Souza, D.F.D.; Markoski, A. 2012. A competitividade logística do brasil: um estudo com base na infraestrutura existente. Revista de Administração. 10(17): 135-144.
[3] Plataforma de Infraestrutura em Logística de Transportes da Fundação Dom Cabral (PILT FDC). 2024. Cenários de Carregamento da Rede Multimodal de Transporte com Fluxos de Cargas nos Horizontes-Base e Futuros. Disponível em: https://pilt.fdc.org.br/trabalhos/. Acesso em: 30 ago. 2024.
[4] Departamento Nacional de Infraestrutura de Transportes (DNIT). 2022. Resolução n. 11, de 21 de setembro de 2022. Estabelece normas sobre o uso de rodovias federais por veículos ou combinações de veículos e equipamentos, destinados ao transporte de cargas indivisíveis e excedentes em peso ou dimensões, observados os requisitos estabelecidos pelo Conselho Nacional de Trânsito-CONTRAN. Ministério da Infraestrutura, Departamento Nacional de Infraestrutura de Transportes. Brasília DF, Brasil. Disponível em: https://www.gov.br/dnit/pt-br/central-de-conteudos/atos-normativos/tipo/resolucoes/resolucao-no-11-2022. Acesso em: 18 de fev. 2024.
[5] Gardesani, R.; Moori, R.G.; Morais, R.R.D. 2010. A importância da informação no processo logístico do transporte de cargas pesadas: um estudo de caso. Revista de logística da Fatec Carapicuíba. 1(2): 15-45.
[6] José, L.L.D.O; Grilo, M.P.D.S; França T.F.B.D. 2015. Planejamento logístico dos transformadores de corrente contínua em alta tensão (hvdc). In: XII Simpósio de Excelência em Gestão e Tecnologia, Associação Educacional Dom Bosco. Resende, RJ, Brasil. Disponível em: https://www.aedb.br/seget/arquivos/artigos15/102211.pdf.
[7] Project Management Institute (PMI). 2022. Guia PMBOK, um guia do conhecimento de gerenciamento de projetos. 7ed. Project Management Institute, Newtown Square, PA, EUA.
[8] Carvalho, M.M. 2018. Fundamentos em gestão de projetos – construindo competências para gerenciar projetos. 5ed. Editora Atlas, Rio de Janeiro, RJ, Brasil.
[9] Gil, A.C. 2022. Como Elaborar Projetos de Pesquisa. 7ed. Editora Atlas, Barueri, SP, Brasil.
[10] Filho, R.R.P. 1994. Análise do valor: processo de melhoria contínua. 1ed. Editora Nobel, São Paulo, SP, Brasil.
[11] Rozenfeld, H.; Forcellini, F.A.; Amaral, D.C.; Toledo, J.C.D.; Silva, S.L.D.; Alliprandini, D.H.; Scalice, R.K. 2006. Gestão de desenvolvimento de produtos: uma referência para a melhoria do processo. 1ed. Editora Saraiva, São Paulo, SP, Brasil.
[12] Pagnusati, G.C. 2021. Estudo sobre o processo de desenvolvimento de dispositivos de tecnologia assistiva. Trabalho de Conclusão de Curso em Engenharia Mecânica. Universidade de Caxias do Sul, Caxias do Sul, RS, Brasil.
[13] Cannon, J.P.; Perreault Júnior. W. 1999. Buyer-Seller Relationship in Business Markets. Journal of Marketing Research. 36(4): 439-460. DOI: 10.2307/3151999.
Como citar
Arrais, V.O.; Ribeiro, R. Processo de hierarquização de projetos de cargas indivisíveis. Revista E&S. 2025; 6: e2024066
About the authors
 Vanderson de Oliveira Arrais – Specialist in Business Management. Guarulhos, São Paulo, BrazilRodolfo Ribeiro – Fatec Sebrae Business School. Alameda Nothmann, 598, Campos Elíseos, 01216-000, São Paulo, SP, Brazil