
Business
October 20, 2025
Fruit Production Indicators in the Brazilian Northeast
Authors: Marina Ximenes de Lima Oliveira and Maysa Pereira Tomé
DOI: 10.22167/2675-6528-2024083
E&S 2025, 6: e2024083
Historically, the Brazilian Northeast region had its economy based on the agro-export model of monocultures, with an emphasis on the production of sugarcane, cotton, and cocoa. However, with the introduction of new technologies, investments in infrastructure, and incentive policies for the activity, there was the development of fruit farming, mainly from irrigation implemented by the federal government[1].
In this context, Northeastern fruit farming shows high productive performance, achieved due to the region’s favorable climatic conditions, with emphasis on luminosity, high temperature, and low average relative air humidity. These factors guarantee the region a comparative advantage over the South and Southeast in the production of fruit varieties[2].
Production occurs on a large scale and demand is significant in both domestic and foreign markets. According to data from the Brazilian Association of Fruit Exporters and Derivatives [Abrafrutas][3], the region was responsible for exporting more than 390 thousand tons of fruit in 2021, which contributed positively to the Brazilian trade balance.
Given the relevance of the topic for the socioeconomic scenario of Brazil, this study has as its main objective to characterize the evolution of fruit farming in the Brazilian Northeast and to quantitatively analyze the behavior of fruit production in the period from 2013 to 2022.
For this purpose, a data survey related to the production of fruit farming in the Brazilian Northeast over the last 10 years (2013 to 2022) was carried out through the platform of the Brazilian Institute of Geography and Statistics (IBGE). Data on the production of banana, coconut, guava, orange, mango, grape, pineapple, watermelon, and melon available in the IBGE Automatic Retrieval System (Sidra) [4] were collected.
The variables selected for this study were: harvested area in hectares (ha), quantity produced in tons (t), production value in reais (R$), and average yield (kg/ha). The data were tabulated with the aid of Microsoft Excel® software and analyzed through descriptive and variability measures for comparison between the years 2013 and 2022. Linear regression analysis was performed for the variables quantity produced and production value.
Pluviometric data from the region were collected to verify the correlation between annual pluviometric averages and the quantity of fruits produced per state, based on the database of the National Institute of Meteorology (Inmet)[5]. To quantify the influence of precipitation volume in the states on the variation of annual fruit production, the Pearson correlation formula was applied.
The harvested area in hectares of the fruits under study, presented in Table 1, indicates that banana production in the region registered, in the last 10 years, the largest harvested areas, with an average value of 183,604 ha. Next, the area dedicated to the cultivation of coconut stood out, with an average of 175,641 ha, and, in third place, the area of oranges, with an average of 106,974 ha. In contrast, guava cultivation showed the smallest average, of 9,377 ha.
The analysis of the coefficient of variation (c.v.) data indicates that watermelon cultivation presented a high value of 18.36%, which reveals greater variability in the harvested area over the years. In contrast, banana cultivation presented lower variability, with a c.v. of 3.48%, demonstrating the stability of the cultivation area during the analyzed period.
Table 1. Descriptive analysis of the harvested area, in hectares, of banana, coconut, guava, orange, mango, grape, pineapple, watermelon, and melon crops in the Brazilian Northeast, from 2013 to 2022
| Organizational Culture | Average | Standard deviation | Coefficient of variation (%) |
| Banana | 183.604 ha | 6.386 ha | 3,48 |
| Orange | 106.974 ha | 15.259 ha | 14,26 |
| Mango | 50.707 ha | 4.951 ha | 9,76 |
| Watermelon | 34.381 ha | 6.313 ha | 18,36 |
| Pineapple | 22,090 ha | 1,352 ha | 6,12 |
| Melon | 20.925 acres | 2.174 acres | 10,39 |
| Grape | 10.385 ha | 636 ha | 6,12 |
| Guava | 9.377 ha | 1.381 acres | 14,73 |
| Coconut of the bay | 175.641 ha | 24.473 ha | 13,93 |
Note: ha: hectares.
Regarding the quantity of fruits produced in tons (Table 2), banana showed the highest average production, followed by orange and bay coconut, whose measurements were 2,302,630 t, 1,363,710 t, and 1,158,472 t, respectively. This indicates that, among the fruits studied, these were produced in greater quantities in the region. However, guava showed the lowest average in the period from 2013 to 2022, with an average quantity of 233,699 t.
The coefficients of variation showed changes in the quantity produced over the years. The coconut-of-the-bay presented the highest coefficient of variation, 32.43%, which suggests greater variation in production in relation to the average during the period. In contrast, the banana presented the lowest coefficient of variation, 4.70%, which indicates stability of agricultural production over the analyzed years.
Table 2. Descriptive analysis of the quantity produced in tons of banana, coconut, guava, orange, mango, grape, pineapple, watermelon, and melon crops in the Brazilian Northeast from 2013 to 2022
| Organizational Culture | Average | Standard deviation | Coefficient of variation (%) |
| Banana | 2,302,630 t | 108.196 t | 4,70 |
| Orange | 1,363,710 b | 280.181 t | 20,55 |
| Mango | 959.819 t | 216.075 t | 22,51 |
| Watermelon | 685.120 t | 111.665 t | 16,30 |
| Pineapple | 576.815 t | 54.792 t | 9,50 |
| Melon | 567.842 t | 52.659 t | 9,27 |
| Grape | 422.218 t | 88.681 t | 21,00 |
| Guava | 233.699 lot | 58.746 t | 25,14 |
| Coconut of the bay | 1.158.472 t | 375.709 t | 32,43 |
Note. t: tons.
For the production value variable in reais of the fruits under study in the Brazilian Northeast, banana, grape, and mango presented average values of BRL 2,463,054.00; BRL 1,251,115.00; and BRL 1,014,624.00, respectively (Table 3). In contrast, guava presented the lowest value, at BRL 360,450.00.
Table 3. Descriptive analysis of the production value in reais of banana, coconut, guava, orange, mango, grape, pineapple, watermelon, and melon crops in the Brazilian Northeast from 2013 to 2022
| Organizational Culture | Average | Standard deviation | Coefficient of variation (%) |
| Banana | BRL 2,463,054.00 | BRL 652,586.00 | 26,49 |
| Orange | BRL 647,805.00 | BRL 119,862.00 | 18,50 |
| Mango | BRL 1.014.624,00 | BRL 445,863.00 | 43,94 |
| Watermelon | BRL 413,692.00 | BRL 128,181.00 | 30,98 |
| Pineapple | BRL 695,917.00 | BRL 64,788.00 | 9,31 |
| Melon | BRL 547,241.00 | BRL 118,703.00 | 21,69 |
| Grape | BRL 1.251.115,00 | BRL 450,182.00 | 35,98 |
| Guava | BRL 360,450.00 | BRL 153,533.00 | 42,59 |
| Coconut of the bay | BRL 774,839.00 | BRL 143,721.00 | 18,55 |
Regarding the average yield of agricultural production of the fruits under study (Table 4), grapes showed the highest average yields, followed by melon and pineapple, with values of 40,406 kg/ha; 27,186 kg/ha and 26,070 kg/ha, respectively. However, coconut showed the lowest average yield, at 7,234 kg/ha.
Furthermore, the grape revealed the highest c.v. (17.06%), indicating significant variation in yields over the years. On the other hand, banana cultivation showed the lowest c.v. (3.77%), demonstrating less variation in agricultural production yield during the study period.
Table 4. Descriptive analysis of the average yield of banana, bay coconut, guava, orange, mango, grape, pineapple, watermelon, and melon crops in the Brazilian Northeast from 2013 to 2022
| Organizational Culture | Average | Standard deviation | Coefficient of variation (%) |
| Banana | 12.544 kg/ha | 473 kg/ha | 3,77 |
| Orange | 12.654 kg/ha | 816 kg/ha | 6,45 |
| Mango | 18.774 kg/ha | 2.889 kg/ha | 15,39 |
| Watermelon | 20.032 kg/ha | 1.178 kg/ha | 5,88 |
| Pineapple | 26.070 kg/ha | 987 kg/ha | 3,79 |
| Melon | 27.186 kg/ha | 1.219 kg/ha | 4,48 |
| Grape | 40.406 kg/ha | 6.892 kg/ha | 17,06 |
| Guava | 24.580 kg/ha | 3.027 kg/ha | 12,31 |
| Coconut of the bay | 7.234 kg/ha | 957 kg/ha | 13,24 |
Note. Kg/ha: kilogram per hectare.
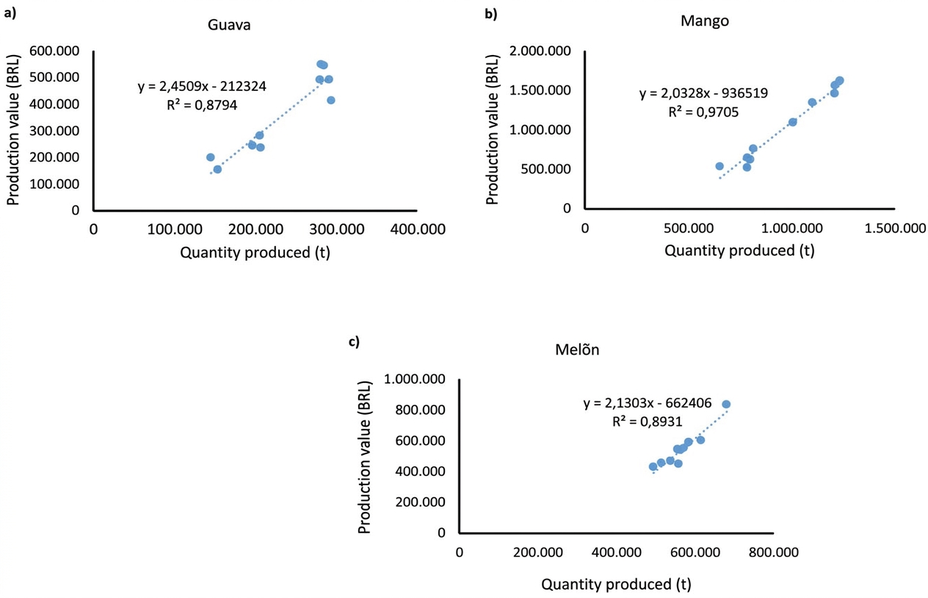
Linear regression analysis between the variables produced quantity and production value indicated a significant positive relationship (p < 0.05) for melon, guava, and mango fruits. This means that when the produced quantity increases, the production value also increases (Figure 1). For melon cultivation, 89% of the variation in value is explained by the produced quantity; for guava, 87%; and for mango, 97%. These results indicate that factors other than the produced quantity may influence the value of fruits in the region under study.
Source: Original research results.
The evidenced results are explained by numerous factors, mainly by the particularities of the Northeast region. Among these particularities, soils with high texture variation, ranging from sandy to clayey soils, with low natural fertility and areas of high acidity[6] can be highlighted. Furthermore, there is the predominant presence of arid and semi-arid climate in the region[1].
However, irrigation resulted in greater dynamism in certain areas, due to the use of available natural resources, such as water and land, fundamental elements to irrigated fruit farming[7].
However, Vidal[8] highlighted that there are limitations in the region that compromise production and sustainability, with an emphasis on the citrus chain, in addition to the occurrence of pests and diseases. In this context, limitations of soils with low natural fertility and the presence of compacted horizons, which confer high resistance to root penetration, climate change with intensification of droughts and increased temperatures; and absence of a canopy diversification plan, rootstock and their combinations stand out.
For grape cultivation, the main technology responsible for major changes in the production system and for the increase in the activity’s profitability was the genetic improvement of plants[9]. As with grapes, the productivity levels of bay coconuts in the region are related to the variety exploited, the use of technologies, and edaphoclimatic factors, among others[10].
The increase in mango production, according to Lima et al.[9], is mainly due to the use of technologies for flowering management, which allow production at times suitable for commercialization; to fertilization carried out based on the monitoring of soil and plant samples, to replenish minerals according to the demands of each phenological phase; and to phytosanitary management focused on the control of diseases and pests.
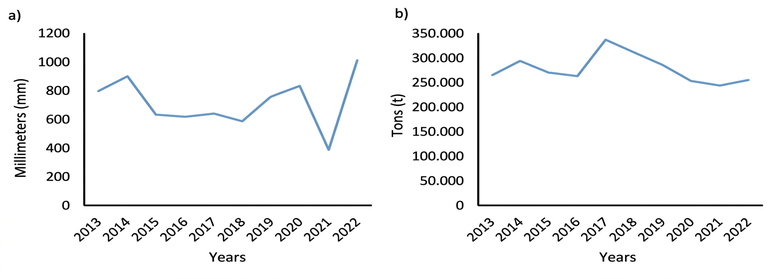
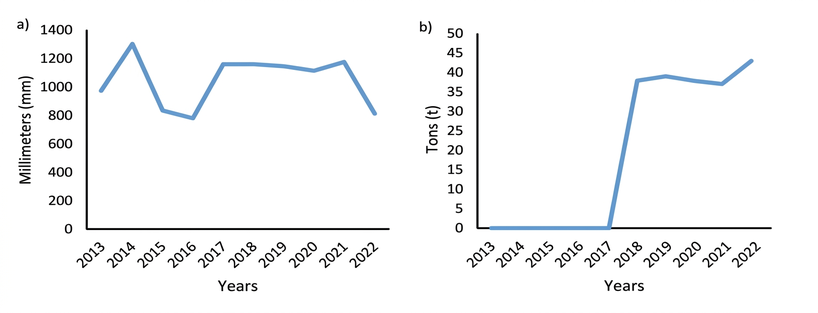
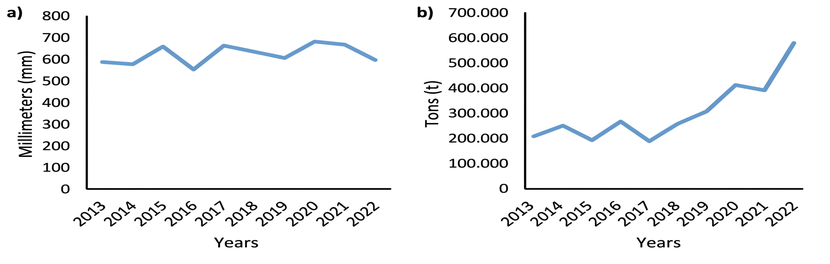
When analyzing the correlation between average rainfall data and fruit production, variation is observed between years for the different crops under study. In the correlation between the annual rainfall average of the state of Paraíba and the quantity of pineapples produced, the correlation coefficient (r) was -0.05, which indicates a negative correlation between the two variables (Figure 2).
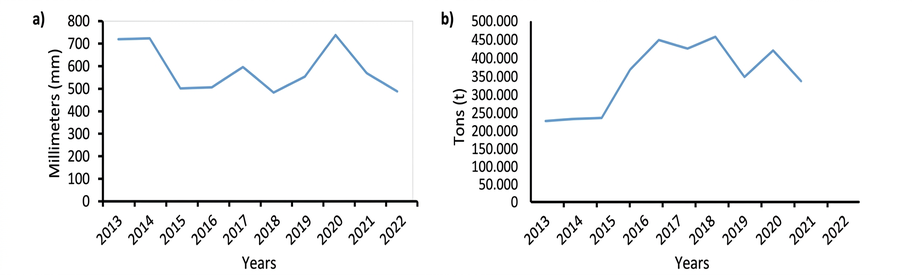
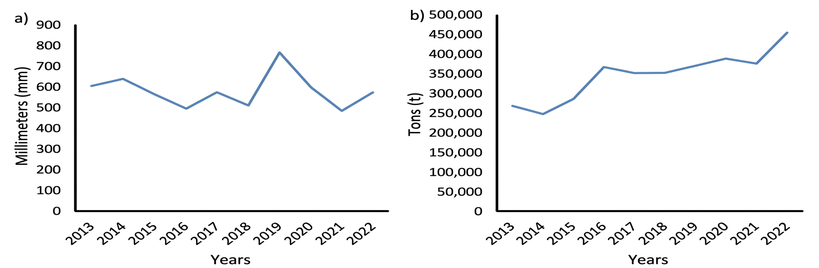
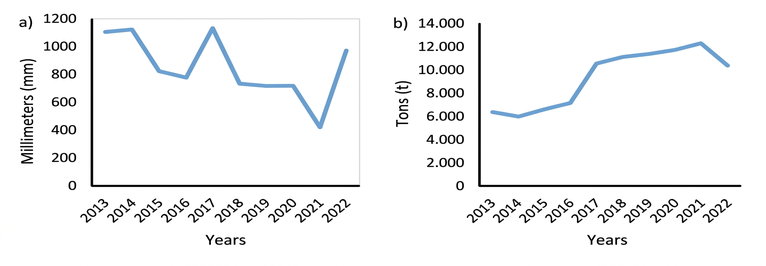
This shows that the amount of rain and pineapple production are inversely related. A negative correlation was also evidenced between the average rainfall and grape production in the state of Pernambuco, with r = -0.41 (Figure 3), and between the average rainfall in the state of Rio Grande do Norte and melon production, with a Pearson coefficient r = -0.15 (Figure 4).
Source: Original research results.
Source: Original research results.
Source: Original research results.
The same negative correlation trend was evidenced in the states of Maranhão and Alagoas. In Maranhão, the correlation coefficient r= -0.96 indicated an inverse relationship between the amount of rain and guava production (Figure 5). In Alagoas, the correlation between the average annual rainfall and mango production was r= -0.59 (Figure 6).
Source: Original research results.
Source: Original research results.
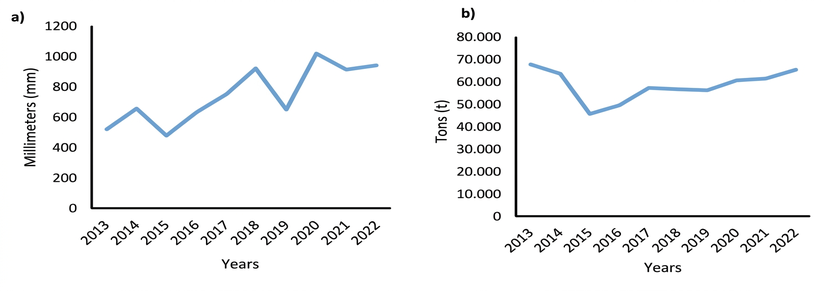
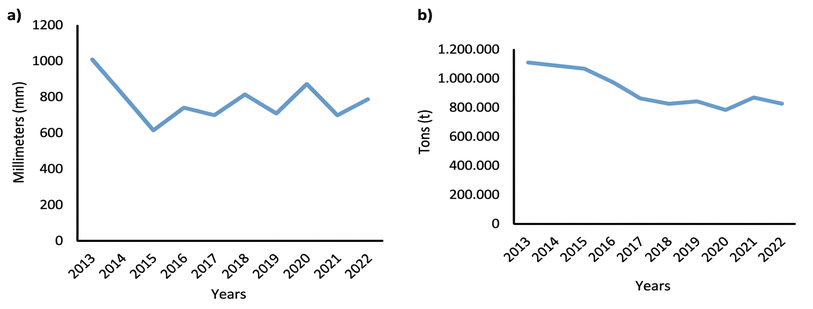
Still regarding the average annual rainfall and fruit production, in the state of Piauí, the correlation coefficient (r) was 0.34 (Figure 7), which indicates a moderate positive relationship between the amount of rain and watermelon production. In general, when the amount of rain increases, watermelon production also tends to increase. For orange production in the state of Sergipe, the Pearson correlation coefficient was 0.51 (Figure 8), which demonstrates a positive relationship between the amount of rain and orange production.
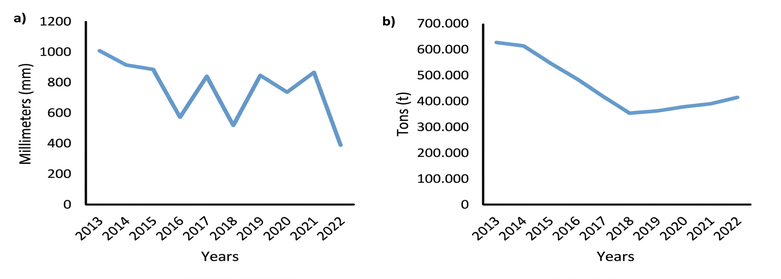
In the state of Ceará, the Pearson coefficient was 0.06 (Figure 9) when the rainfall index was related to the production of coconut. For the state of Bahia, based on banana production, the Pearson correlation coefficient identified was 0.16 (Figure 10), which shows the relationship between the average annual amount of rain and the quantity of bananas produced.
Source: Original research results.
Source: Original research results.
Source: Original research results.
Source: Original research results.
The result of the pineapple analysis can be explained according to Sanches and Matos[11] pineapple planting should occur at the end of the dry season and extend into the rainy season. In tropical areas with regular rainfall or irrigation, planting occurs throughout the year, and water is essential.
For grape production in the state of Pernambuco, continuous rain harms the plant, as highlighted by Garrido[12], mainly during sprouting and flowering, due to berry abortion and the occurrence of fungal diseases, and during fruit maturation and harvest, due to the risk of berry cracking and the incidence of rot in the bunches.
For melon production in the state of Rio Grande do Norte, this trend may have occurred because the rainy season causes several factors that reduce the quantity produced and the quality of the fruit. Among these factors, diseases during periods of high rainfall stand out, with emphasis on bacterial fruit blotch, caused by Acidovorax citrulli. On the other hand, dry weather favors the good development of fruits, as it reduces the occurrence of diseases[13].
The negative trend observed for guava cultivation occurs because the guava tree is very demanding regarding water conditions, and its cultivation is satisfactory only in regions where annual rainfall varies between 800 and 1,000 mm. Furthermore, periods of high water demand by the guava tree can result in the formation of small fruits and, consequently, in lower production per plant[14].
In mango cultivation, a negative interference is observed, as the mango tree requires a dry season for vegetation and fruiting, since floral differentiation occurs after the end of the rainy season. When rains occur during the flowering period, there is a reduction in pollination, fruit retention on the tree, and the quantity produced[15].
The evidenced result for watermelon cultivation is explained by water scarcity, which directly affects production[16]. Nutrient absorption depends on their dilution by water: lack of water in the soil prevents nutrient absorption by the plant, and excess water can cause leaching of these minerals[17].
The expressed result for the quantity of oranges in the state of Sergipe, as a function of the annual pluviometric average, can be explained by the plant’s water requirement. Alves and Melo[18] state that citrus cultivation requires a volume of water between 1,900 and 2,400 mm, with a minimum of around 1,300 mm.
Regarding the production of coconuts, the quantity produced depends on the total rainfall and the annual distribution of rain in the region. The water requirement is around 1,500 mm, uniformly distributed throughout the year[19]. Banana production is also strongly influenced by the rainfall regime of the Bahia region. According to Borges and Souza[20], the highest banana productions are associated with an annual total precipitation of 1,900 mm, well distributed throughout the year, i.e., 160 mm/month and 5 mm/day.
The increase in fruit production in the Northeast, even with edaphoclimatic limitations, highlights the relevance of technological advancements in strengthening the activity. The analysis of the evolution of fruit farming between 2013 and 2022 allowed for an understanding of the sector’s behavior during the period and emphasized not only the growth of the sector but also the significant differences between crops and regions, especially due to the variability of rainfall indices.
These results reinforce the need for more efficient management strategies, such as defining cultivation calendars adjusted to the water requirements of the species, in order to ensure the sustainability of the activity and the continuity of profitability for producers. Therefore, they open space for future investigations aimed at understanding the effects of climate change on regional fruit farming, evaluating the effectiveness of public policies to encourage the sector, and studying the adoption of irrigation and sustainable management technologies capable of increasing the resilience and competitiveness of northeastern fruit farming.
REFERENCES
[1] Santana, J.V.F. 2023. Efeitos econômicos da fruticultura irrigada no Nordeste. Trabalho de Conclusão de Curso. Goiânia: Pontifícia Universidade Católica de Goiás, Goiânia, GO.
[2] Vidal, M.F. 2018. Fruticultura na área de atuação do BNB. Caderno Setorial Escritório Técnico de Estudos Econômicos do Nordeste. Disponível em: https://www.bnb.gov.br/s482-dspace/handle/123456789/102. Acesso em: 02 de abr. 2024.
[3] Associação Brasileira dos Produtores e Exportadores de Frutas e Derivados- ABRAFRUTAS. 2023. Conheça a região Nordeste do Brasil e sua importância na fruticultura brasileira. Disponível em: https://abrafrutas.org/2023/06/conheca-a-regiao-nordeste-do-brasil-e-sua-importancia-na-fruticultura brasileira/#:~:text=No%20que%20diz%20respeito%20%C3%A0,frutas%20mais%20produzidas%20na%20regi%C3%A3o. Acesso em: 14 out. 2023.
[4] Sistema IBGE de Recuperação Automática- SIDRA. 2024. Produção agrícola municipal. Disponível em: https://sidra.ibge.gov.br/. Acesso em: 10 de mar. 2024.
[5] Instituto Nacional de Meteorologia- INMET. 2024. Banco de Dados Meteorológicos do INMET. Disponível em: https://bdmep.inmet.gov.br/. Acesso em: 01 de mar. de 2024.
[6] Marques, F. A.; Nascimento, A. F. ; Araujo Filho, J. C. de; SILVA, A. B. 2014. Solos do Nordeste. Disponível em: https://www.embrapa.br/en/busca-de-publicacoes/-/publicacao/1003864/solos-do-nordeste. Acesso em: 06 de abr. 2024.
[7] Nascimento, W.P. 2023. A expansão de objetos técnico-científicos-informacionais na fruticultura irrigada do nordeste semiárido brasileiro e a sujeição da terra camponesa. Tese de Doutorado. Universidade Federal do Rio Grande do Norte, Natal, RN.
[8] Vidal, M.F. 2021. Produção de laranja na área de atuação do BNB. Caderno Setorial Escritório Técnico de Estudos Econômicos do Nordeste. Disponível em: https://www.bnb.gov.br/s482-dspace/bitstream/123456789/1041/1/2021_CDS_198.pdf. Acesso em: 01 de mar. de 2024.
[9] Lima, J. R. F.; Yuri, J. E.; Mouco, M. D. C.; Leao, P. D. S.; da Costa-Lima, T. C. 2021. Menos área cultivada, mais tecnologia na fruticultura de exportação: uva, manga e melão. Disponível em: https://www.embrapa.br/en/busca-de-publicacoes/-/publicacao/1131621/menos-area-cultivada-mais-tecnologia-na-fruticultura-de-exportacao-uva-manga-e-melao. Acesso em: 06 de abr. 2024.
[10] Brainer, M. S. D. C. P.; Ximenes, L. F. 2020. Produção de coco: soerguimento das áreas tradicionais do Nordeste. Caderno Setorial Escritório Técnico de Estudos Econômicos do Nordeste. Disponível em: https://www.bnb.gov.br/s482-dspace/handle/123456789/387. Acesso em: 04 de abr. 2024.
[11] Sanches, N.F.; Matos, A.P. 2013. Abacaxi: O produtor pergunta, a Embrapa responde. Disponível em: https://mais500p500r.sct.embrapa.br/view/pdfs/90000025-ebook-pdf.pdf. Acesso em: 06 e abr. 2024
[12] Garrido, L. D. R.; Maia, J. D. G.; Ritschel, P. S.; Gava, R. 2017. Manual de identificação das doenças abióticas da videira. Disponível em: https://www.alice.cnptia.embrapa.br/alice/bitstream/doc/1078121/1/Manualdoencasabioticasvideira.pdf. Acesso em: 06 abr. 2024.
[13] Santos, G. R. dos; Juliâo, L.; Viana, M. M. 2012 Melão: tempo seco beneficia qualidade no Vale. Disponível em: https://cepea.esalq.usp.br/hfbrasil/edicoes/112/melao.pdf. Acesso em: 06 abr. 2024.
[14] Manica, I.; Icuma, I. M.; Junqueira, N. T. V.; Salvador, J. O.; Moreira, A.; Malavolta, E. 2000 Goiaba. Porto Alegre, RS: Cinco Continentes.
[15] Silva, A. P. G., de Moura, M. S. B., Sá, I., Souza, L., da Silva, L. F. B., & da Silva, T. G. F. 2010. Impacto do aquecimento global no zoneamento climático da mangueira para o Estado de Pernambuco. Disponível em: https://www.alice.cnptia.embrapa.br/alice/bitstream/doc/872799/1/AnaPaula.pdf. Acesso em: 06 de abr. 2024.
[16] Oliveira, A. L. R.; Moraes, S. R. P.; Gill Neto, A. G. 2010. Zoneamento Edafoclimático da Cultura da Melancia. Enciclopédia biosfera. 6(11): 01-11. DOI: https://doi.org/10.22238/rc2448269220191702212227.
[17] Gama, F.; Castro, N. M.; Leão, E.; Gonçalves, C.; Cardon, C.; Sarmento-Brum, R. B. C. 2011. Nutrição mineral e adubação na cultura da melancia. In: Santos, G. R.; Zambolim, L. Tecnologias para produção sustentável da melancia no Brasil, p. 19-44. Visconde do Rio Branco, MG: Suprema Gráfica e Editora LTDA.
[18] Alves, P. R B.; Melo, B.A. 2023. Cultura dos citros. Núcleo de Estudo em Fruticultura no Cerrado. Disponível em: http://www.fruticultura.iciag.ufu.br/citros2.htm . Acesso em: 06 de abr. de 2024.
[19] Fontes, H. R. F.; Ferreira, J. M. S.; Siqueira, L. A. 2002. Sistema de produção para a cultura do coqueiro. Aracaju: Embrapa Tabuleiros Costeiros. Disponível em: https://www.cpatc.embrapa.br/download/SP1.pdf . Acesso em: 06 de abr. de 2014.
[20] Borges, A.L.; Souza, L.S. 2021. Banana: relações/clima. [Acesso em: 06 de abril 2024]. Disponível em: https://www.embrapa.br/en/agencia-de-informacao-tecnologica/cultivos/banana/preproducao/especie/relacoes/clima#:~:text=As%20maiores%20produ%C3%A7%C3%B5es%20de%20banana,e%20no%20in%C3%ADcio%20da%20frutifica%C3%A7%C3%A3o . Acesso em: 06 de abr. 2024.
COMO CITAR
Oliveira, M.X.L.; Tomé, M.P. Indicadores de produção de frutas no Nordeste brasileiro. Revista E&S. 2025; 6: e2024083.
ABOUT THE AUTHORS
 Marina Ximenes de Lima Oliveira – Agribusiness Specialist. Training Supervisor at the National Rural Apprenticeship Service in Pernambuco. Rua São Miguel, 1050, Afogados, 50770-720, Recife, Pernambuco, Brazil.
Maysa Pereira Tomé – PhD in Entomology from USP/Esalq. Supervising Professor. Rua Cezira Giovanoni Moretti, 580, 13414-157, Piracicaba, São Paulo, Brazil.