
Project Management
November 06, 2026
Technical-economic Feasibility of Two Automation Levels in the Transition of an Industrial System
Carlos Henrique Bonfim; Auro de Jesus Cardoso Correia
DOI: 10.22167/2675-6528-202603640
Article derived from a Final Course Work (TCC), with content based on the student’s original work and adapted to the editorial format of the E&S Magazine with the support of the ResumeAI tool, an artificial intelligence solution developed by Instituto Pecege for textual synthesis and organization.
Summary
The study analyzed the technical-economic justification of medium and long-term investments in industrial systems automation, focusing on plastic industry factories that still maintain a significant part of their operations in manual routines. In these environments, the investment decision is complex, as production already generates revenue, even with losses, rework, low traceability, and unreliable data. The objective was to compare the implementation of Human-Machine Interface (HMI) and supervisory systems at different production scales. The methodological approach was mixed and applied, developed from a project management perspective, considering cost, risk, operational safety, raw material quality, traceability, data governance, production continuity, and decision-making support. Four reference cases were compared: HMI on one line, HMI on seven lines, supervisory on one line, and supervisory on seven lines. The results indicated that the HMI contributed to organizing and standardizing local operations, while the supervisory system expanded the capacity to record information, track histories, generate reports, support audits, and investigate bottlenecks. It was concluded that the investment justification should not be limited to immediate returns but should consider the reduction of uncertainties, losses, operational risks, and costs that accumulate over time.
Keywords: Data governance; Risk management; Traceability; Supervisory; Decision-making.
1. Introduction
The automation of industrial systems can be treated as an investment and change management decision, and not just as the purchase of panels, screens, licenses, or technical services. In factories that still preserve many manual routines, especially in the plastics industry, the proposal to automate often encounters resistance when the current operation continues to deliver production and revenue. Therefore, the analysis must go beyond the initial cost and consider value delivery, risks, stakeholders, and acceptance of the solution throughout the project (Kerzner, 2017; Project Management Institute, 2021).
This difficulty becomes more evident because part of the gains from automation do not appear immediately in the cash flow. Manual operation can keep the factory running, but it usually increases operators’ reliance on memory, parallel notes, field adjustments, subsequent inspections, and scattered queries. For these gains to be discussed objectively, it is necessary to transform them into measurable data and compare them economically between implementation alternatives (Brealey et al., 2020; Casarotto Filho and Kopittke, 2010).
From a technical point of view, industrial automation brings together field devices, controllers, operation interfaces, and supervisory control and data acquisition (SCADA) systems. Groover (2019) describes automated systems as productive structures formed by machines, control, and information. Boyer (2004), in turn, presents SCADA as a layer for monitoring, supervision, and data acquisition in distributed processes.
At the local level, the Human-Machine Interface (HMI) is the means by which the operator executes commands, views process states, and monitors alarms near the equipment. In practice, it represents a first step in organizing operations, as it reduces scattered manual actions and creates a standard for process interaction. The ANSI/ISA-101.01-2015 standard reinforces that industrial screens should be clear, consistent, and focused on the actual operational situation (ISA, 2015).
At the supervisory level, the solution starts to gather histories, alarms, reports, batch records, line monitoring, and traceability information. With this layer, the factory gains better conditions to support audits, analyze quality, investigate deviations, and identify bottlenecks, such as recurring pauses, frequent alarms, or differences between planned and actual consumption. The literature on industrial supervision and traceability indicates that structured data increases the ability to track processes, record evidence, and support subsequent verifications (Aung and Chang, 2014; Boyer, 2004; ISO, 2015).
The justification for the investment also involves operational safety and implementation governance. In environments with many manual interventions, automation can organize alarms, reduce employee exposure, record events, and support interlocks. This reading is compatible with occupational risk management and with the conduct of projects that require communication, progressive control, and well-defined acceptance criteria (ISO, 2018; Kerzner, 2017).
The problem that motivated this research lies in the difficulty of defending medium and long-term investments in automation when the factory already operates manually and generates revenue. The study’s gap is in demonstrating that automation tends to be undervalued when analyzed solely by immediate financial return. Its effects also involve reducing risks, waste, rework, record-keeping errors, operational exposure, raw material losses, and lack of evidence for audits and managerial decisions.
Given this context, the present research is justified by the need to structure a more comprehensive technical-economic justification for such investments. The objective of the study is to analyze ways to technically and economically justify medium and long-term investments in industrial systems automation, comparing implementation by HMI and by supervisory control in a pilot line and in seven production lines, with an emphasis on factories that still depend on manual processes.
2. Material and Methods
The study adopted a mixed approach, of an applied nature and exploratory-descriptive character, according to Gil (2017). The quantitative dimension organized costs, services, technical hours, cost per line, and incremental investment, while the qualitative dimension assessed risks, operational safety, traceability, user acceptance, data governance, phasing, and value generation potential. This design allowed for the comparison of implementation alternatives in a real industrial environment.
The methodological strategy corresponded to a multiple case study of reference, according to Yin (2018). Four implementation arrangements were defined for comparison: HMI on one line, HMI on seven production lines, supervisory on one line, and supervisory on seven production lines. These cases represent possible implementation paths, from a local and pilot solution to a broader and centralized solution, allowing us to observe how investment and the level of available information change with scale.
The unit of analysis was the automated production line, using a reference plant from the plastics industry as an applied example. The intention was to represent a common situation in industries that operate manually but need to evaluate the value of automation in terms of safety, quality, traceability, loss reduction, and improved decision-making.
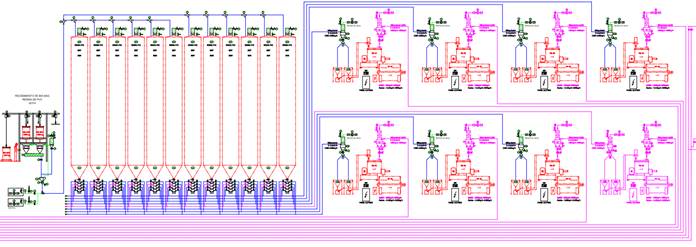
Figure 1 represents the reference industrial arrangement used for case comparison, portraying a common situation in plastic industry factories and other industrial environments, with raw material reception and movement, storage, transport, silos, scales, and production lines. The flow highlights the need for integration between production, maintenance, engineering, quality, safety, and financial management for the implementation of this type.
Figure 1. Conceptual flowchart of the reference industrial arrangement used for case comparison
Source: Original research data
The data collection combined documentary research, secondary data survey, analysis of technical evidence from the process, and organization of cost parameters. Information on equipment, licenses, services, automation architecture, batch sample records, dosage reports, alarms, and operational screens were considered. Bibliographic research was used to support the interpretation of the results.
The data analysis occurred in four stages: 1) structuring of total costs, cost per line, and incremental differences; 2) comparison of cases by technical and managerial criteria; 3) application of a multicriteria matrix with a score from 1 to 5; and 4) interpretation of results based on the literature. The analysis differentiated directly measurable elements (investment and cost per line) from managerial elements (risk, security, quality, traceability, data governance, and user adoption).
The financial analysis was conducted conservatively, without using indicators such as ROI, payback, NPV, and IRR as final results, as the study did not include real measurements of benefits after implementation. We avoided estimating financial return without a measured basis, aligned with the corporate finance and engineering economics literature (Brealey et al., 2020; Casarotto Filho and Kopittke, 2010), which highlights the importance of considering cash flows, measurable benefits, comparison between alternatives, and incremental investment analysis. Table 1 summarizes the methodological design and its application in the study.
Table 1. Synthesis of the methodological design and its application in the study
| Methodological element | Application in the study | Justification |
| Type of research | Applied | Evaluate a practical decision for implementing automation in an industrial environment. |
| Approach | Mixed | Combine cost data and technical hours with risk analysis, traceability, security, and governance. |
| Classification | Exploratory-descriptive | Better understand the problem and describe deployment alternatives, according to Gil (2017). |
| Strategy | Study of multiple reference cases | Compare four deployment arrangements, following the logic of case study discussed according to Yin (2018). |
| Unit of analysis | Automated production line | Compare the pilot deployment, the expansion to seven lines, and the cost per line. |
| Analysis technique | Cost composition and multicriteria matrix | Organize economic, technical, and operational criteria to support the comparison of alternatives. |
Source: Original research data
Table 2 presents the cost parameters used in the modeling.
Table 2. Parameters used in cost modeling
| Parameter | Value | Use in modeling |
| Main panel – equipment | BRL 236,148.50 | Considered as the initial fixed cost of the solution, common to the analyzed scenarios. |
| Remote panel by line – equipment | BRL 55,640.81 | Considered as an additional cost per production line included in the implementation. |
| Supervisor licenses | BRL 67,128.42 | Included only in scenarios with supervision, composing the fixed portion of this type of solution. |
| Technical hour value | BRL 250.00 | Used to estimate the technical services of engineering, programming, testing, and deployment. |
| Supervisory specialized service | BRL 160,000.00 | Considered as an additional fixed cost of the scenarios with supervision, related to the configuration and implementation of the solution by a specialized team. |
Source: Original research data
3. Results and Discussion
The four reference cases defined in the study revealed significant differences in investment, complexity, operational scope, and capacity to generate management information. The comparison considered HMI on one line, HMI on seven production lines, supervisory on one line, and supervisory on seven production lines, evaluating criteria such as total cost, cost per line, incremental investment, traceability, implementation risks, data governance, stakeholders, and monitoring indicators. The alternatives indicated that the investment decision should not be based solely on the lowest cost, as each arrangement presented its own level of risk, expansion capacity, and informational value.
Characterization of reference cases
The single-line HMI case represented the alternative of lower initial complexity, allowing validation of screens, alarms, nomenclatures, interlocks, and operation routines in a production area. However, its limitation lies in the low consolidation of historical and managerial data, which restricts support for audits and comparative analyses. The seven-line HMI expanded operational standardization and reduced the cost per line, replicating the operation logic in more areas. Nevertheless, traceability remained limited due to the lower integration of data for managerial queries and deviation investigations.
The supervisory system in one line demanded higher initial investment per line, but added a layer of information to the process, including operation history, batch records, reports, alarms, traceability, and centralized monitoring. This scenario proved adequate for validating the data layer before a broader implementation. The supervisory system in seven lines represented the highest total investment and informational scope, consolidating data from multiple lines to facilitate audits, deviation investigations, alarm analysis, and performance comparisons. In contrast, it required greater attention to training, standardization, data governance, and change management. Table 3 summarizes the compared cases.
Table 3. Characterization of the analyzed reference cases
| Case | Role in the study | Observed benefit | Observed limitation |
| HMI – 1 line | Represent the simplest input in automation | Lower initial investment and operational learning on a controlled scale. | Low consolidation of management and historical data. |
| HMI – 7 lines | Represent the expansion of operational standardization | Reduction of cost per line and greater operational uniformity between lines. | Traceability still fragmented and little managerial integration. |
| Supervisory – 1 line | Represent the initial validation of the data layer | Inclusion of history, alarms, reports, and traceability on a controlled scale. | Higher initial investment per line. |
| Supervisory – 7 lines | Represent the most complete management and information solution | Greater traceability, data integration, and consolidated factory view. | Greater implementation complexity, higher total cost, and greater governance requirements. |
Source: Original research results
Quantitative cost results
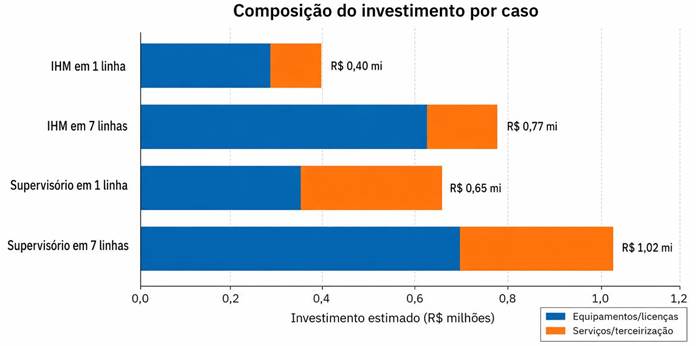
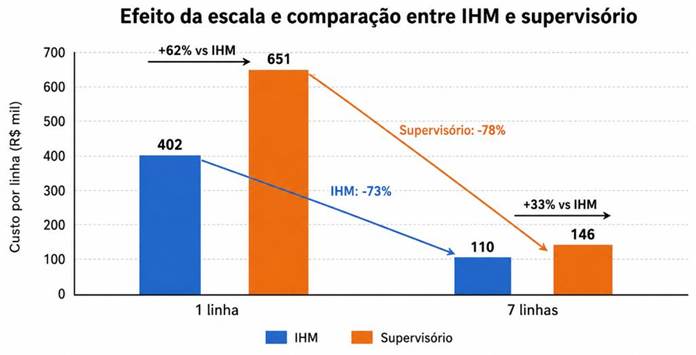
The quantitative analysis revealed differences in total cost, cost per line, and incremental cost. Automation with HMI for one line totaled R$ 401,789.31. The HMI on seven lines totaled R$ 773,134.19, with a unit cost of R$ 110,447.74. The supervisory system on one line totaled R$ 650,917.73. The supervisory system on seven lines totaled R$ 1,022,262.61, with a unit cost of R$ 146,037.52.
The expansion to seven lines reduced the cost per line due to the dilution of fixed costs. The incremental differences between alternatives were: the migration from HMI on one line to supervisory on one line represented an addition of R$ 249,128.42, while the expansion from supervisory on one line to supervisory on seven lines represented an addition of R$ 371,344.88. Table 4 presents the comparison of cases with incorporated services.
Table 4. Comparison of cases with embedded services
| Case | Lines | Equipment/licenses | Services/third party | Total cost | Cost per line |
| HMI – 1 line | 1 | BRL 291,789.31 | BRL 110,000.00 | BRL 401,789.31 | BRL 401,789.31 |
| HMI – 7 lines | 7 | BRL 625,634.19 | BRL 147,500.00 | BRL 773,134.19 | BRL 110,447.74 |
| Supervisory – 1 line | 1 | BRL 358,917.73 | BRL 292,000.00 | BRL 650,917.73 | BRL 650,917.73 |
| Supervisory – 7 lines | 7 | BRL 692,762.61 | BRL 329,500.00 | BRL 1.022.262,61 | BRL 146,037.52 |
Source: Original research results
Incremental reading of scalability indicated that the deployment can be planned in stages. After deploying HMI on one line, the evolution to supervisory on one line corresponds to the difference between the two cases. Once the supervisory on one line is validated, the expansion to seven lines corresponds to the addition of the remaining six lines, as indicated in Table 5.
Table 5. Estimated incremental investment between automation stages
| Evolution path | Final accumulated investment | Incremental Difference | Managerial reading |
| HMI 1 line -> Supervisory 1 line | BRL 650,917.73 | BRL 249,128.42 | Adds history, reports, and traceability to local automation at a pilot scale. |
| HMI 1 line -> HMI 7 lines | BRL 773,134.19 | BRL 371,344.88 | Expand local automation to six more lines, increasing operational standardization. |
| Supervisory 1 line -> Supervisory 7 lines | BRL 1.022.262,61 | BRL 371,344.88 | Expand the already validated supervisory solution to the other production lines. |
| HMI 7 lines -> Supervisory 7 lines | BRL 1.022.262,61 | BRL 249,128.42 | Add the supervisory layer to a local base already standardized in seven lines. |
Source: Original research results
The investment composition and the estimated unit cost per analyzed case are presented in Figure 2 and Figure 3.
Figure 2. Investment composition between equipment/licenses and services
Source: Original research results
Figure 3. Estimated unit cost per analyzed case
Source: Original research results
Considering the complete path, the evolution from HMI in one line to supervisory in seven lines represents an estimated addition of R$ 620,473.30 compared to the initial scenario. This value reflects the expansion of automation to the other lines and the inclusion of the supervisory layer, which offers history, reports, traceability, and greater data integration. This analysis reinforces that the decision should not only consider the total investment but also the appropriate time to advance between stages.
Multi-criteria matrix and deployment risk
The multicriteria matrix was used to compare the cases from a broader perspective, considering seven criteria: initial cost, implementation risk, safety and quality, traceability, expansion, user adoption, and management value. The scoring scale ranged from 1 to 5, where 5 indicated greater adherence to the criterion. The highest weighted result was obtained by the supervisory system on a single line, with 3.80 points. The single-line HMI and the seven-line supervisory system achieved 3.60, while the seven-line HMI obtained 3.05. This result suggests that a larger scope does not, in itself, guarantee the best alternative, making it necessary to balance cost, risk, expansion capability, traceability, user acceptance, and value generated for management. Table 6 consolidates the matrix used.
Table 6. Multicriteria decision support matrix
| Criterion (weight) | IHM 1 line | IHM 7 lines | Sup. 1 line | Sup. 7 lines |
| Initial cost (20%) | 5 | 4 | 3 | 2 |
| Implementation risk (15%) | 5 | 3 | 4 | 2 |
| Security and quality (15%) | 3 | 4 | 4 | 5 |
| Traceability (20%) | 2 | 2 | 4 | 5 |
| Expansion (10%) | 3 | 3 | 4 | 5 |
| User adoption (10%) | 5 | 3 | 4 | 2 |
| Management value (10%) | 2 | 2 | 4 | 5 |
| Weighted scoring | 3,60 | 3,05 | 3,80 | 3,60 |
Source: Original research results
Risks, phasing, and data for future assessment
The qualitative analysis indicated that the implementation of automation involves risks that go beyond the initial investment, such as production downtime during implementation, low user acceptance, lack of standard for expansion, vendor dependency, absence of data custodians, unsafe manual interventions, and insufficient records on raw materials. These risks reinforce the importance of a phased implementation to reduce initial exposure, validate the operation with key users, correct standards, and prepare the data structure for future use. Table 7 presents the main risks identified and the recommended mitigation measures.
Table 7. Main identified risks and mitigation measures
| Risk | Impact | Recommended mitigation |
| Stop or instability during deployment | Production loss and schedule delay. | Deploy in stages, plan windows, and maintain a rollback plan. |
| Pilot without standard for expansion | Rework in migration to supervisory. | Define naming, screen, communication, and data standards before the pilot. |
| Low user acceptance | Incorrect use and loss of value of the system. | Train operators and validate screens with key users. |
| Excessive manual intervention | Greater operational exposure and dependence on individual actions. | Map critical points, review interlocks, and train teams. |
| Data without defined responsibility | Unreliable reports for decision-making. | Define data owners, permissions, validation, and backup. |
| Financial benefits without measurement | Unproven return expectation. | Measure losses, discards, stops, pauses, and investigation time. |
| Lack of traceability | Difficulty in investigating, auditing, and controlling raw material. | Register origin, destination, quantity, time, batch, recipe, and events. |
Source: Original research results
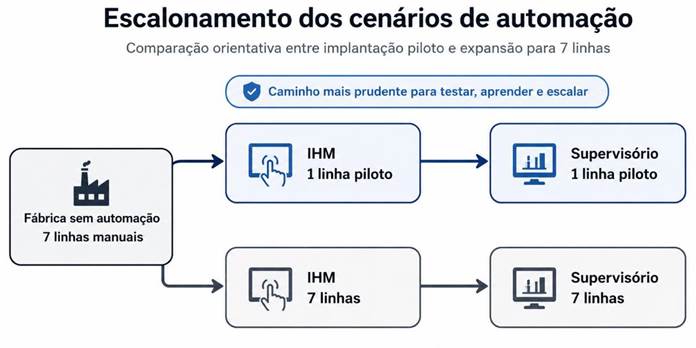
Table 8 organizes the suggested implementation plan, from the definition of requirements to the financial measurement after the start of operations. Figure 4 summarizes the scaling of the evaluated cases, indicating the progress from pilot implementation to expansion in seven lines.
Table 8. Recommended implementation plan
| Phase | Objective | Suggested deliverables |
| Definition of requirements | Align what operation and management need to measure. | List of data, reports, critical alarms, and acceptance criteria. |
| Pilot HMI | Validate local operation with low exposure. | Local screen, tests, initial training and adjustment registration. |
| Preparation for supervisory | Avoid rework in the expansion. | Naming convention, communication, history, backups, and data structure. |
| Supervisory in a line | Validate traceability and managerial use. | History, reports, users, batch records, and assisted operation. |
| Expansion to seven lines | Deploy validated solution to the rest of the factory. | Schedule by waves, stop windows, training, and final acceptance. |
| Subsequent financial measurement | Convert potential benefits into indicators. | Loss data, downtime, scrap, investigation time, ROI, and payback. |
Source: Original research results
Figure 4. Scaling of automation scenarios
Source: Original research results
Traceability and data governance evidence
The results indicated that effective traceability requires standardized, recorded, and retrievable data, not just operation screens. Information such as recipe, batch, line, origin, destination, quantity, time, alarms, operator, and events are essential for reconstructing the production sequence and supporting investigations. Figures 5 and 6 present examples of records used in the study, such as the batch record to track orders and status, and the dosage report to analyze routes and raw material consumption. This evidence suggests that the supervisory system can enhance the managerial value of automation when data is structured from the project’s inception.
Figure 5. Example of batch record used for operational traceability
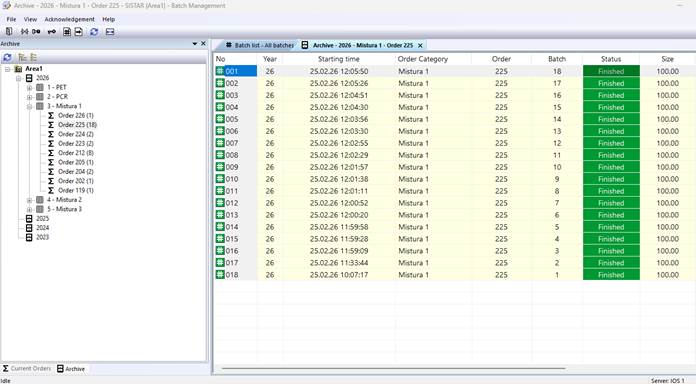
Source: Original research results
Figure 6. Example of a dosage report used for production analysis
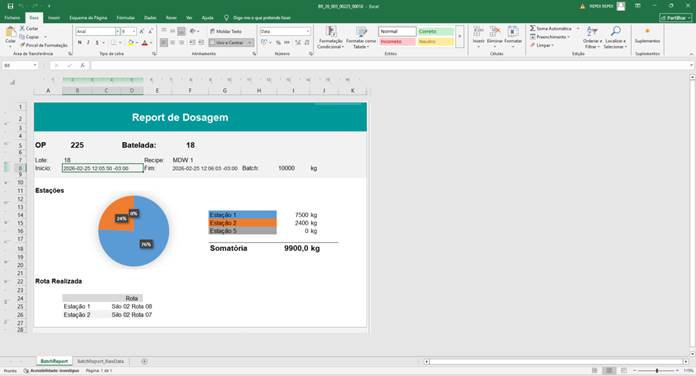
Source: Original research results
Data governance is crucial before expanding to seven lines, requiring the definition of those responsible for registrations, access permissions, backup routines, report validation, alarm handling, and criteria for changing screens or logic. Without this organization, the system can generate unreliable data for auditing, quality, maintenance, and decision-making. Table 9 consolidates the minimum data recommended for operational traceability.
Table 9. Recommended minimum data for traceability
| Dataset | Management purpose | Expected use |
| Revenue identification | Relate production, material, and specification. | Investigate divergences between planned and executed. |
| Batch number | Individualize each process execution. | Delimit affected material in deviations or blockages. |
| Production line | Identify consumption location or destination. | Compare behavior between rows and turns. |
| Origin and destination of the material | Rebuild movement route. | Check silo exchange, incorrect route, or improper supply. |
| Quantity moved | Measure adherence to the process. | Compare expected consumption and actual consumption. |
| Start and end time | Reconstruct temporal sequence. | Relate production with alarms, stops, and interventions. |
| Alarms and events | Register relevant anomalies. | Support maintenance and quality diagnosis. |
Source: Original research results
Acceptance criteria and variables for future measurement
The results also indicated the need for data governance before expansion, with critical points such as responsibility for registrations, permissions, backup, report validation, alarm handling, change history, and definition of criteria for information use. The adoption of acceptance criteria was considered essential to reduce discrepancies between expectation and delivery. The pilot implementation should prove the functionality of screens, alarms, records, reports, permissions, communication, and data recovery. Table 10 presents the suggested acceptance criteria for the pilot implementation.
Table 10. Suggested acceptance criteria for the pilot implementation
| Criterion | Verification required | Expected evidence |
| Local operation | Commands, states, and interlocks tested in the field. | List of tests approved and pending issues registered. |
| Alarms | Critical alarms identified and classified. | History with schedule, description, and return condition. |
| Traceability | Batch registered with minimum defined data. | Query by revenue, line, batch, time, and quantity. |
| Reports | Useful reports for production and quality. | Model validated by key users. |
| Training | Trained operators and maintenance. | Attendance list and assisted operation roadmap. |
| Backup and recovery | Copy and restore routine tested. | Documented procedure and retrievable archive. |
Source: Original research results
The financial results were treated as investment estimates, without calculating definitive financial return, as the study did not include real measurements of benefits after implementation. However, the analysis allowed for the identification of operational variables that can be monitored before and after the project for a future return evaluation. Table 11 presents these recommended variables for future measurement, with the objective of transforming qualitative benefits (safety, quality, traceability, reduction of investigation time, and bottleneck identification) into measurable data.
Table 11. Recommended variables for future financial analysis
| Variable | Expected effect | Suggested measurement method |
| Raw material losses | Waste reduction increases economic benefit. | Compare expected and actual consumption before and after implementation. |
| Blocked Batches | Traceability can reduce unnecessary blockages. | Register value, cause, blocked quantity, and released quantity. |
| Investigation time | Shorter time frees up the team and speeds up decisions. | Measure hours spent per occurrence and average team cost. |
| Production stops and pauses | Identification of bottlenecks improves availability. | Record duration, cause, affected line, and estimated cost of the stoppage. |
| Manual interventions and safety | Reduced exposure can reduce operational risk. | Record interventions, risk conditions, alarms, and corrective actions. |
| Operational rework | Less rework reduces indirect cost. | Record occurrences, correction hours, and recidivism. |
| System support | Cost of maintaining the solution affects viability. | Register calls, technical hours, outsourcing, and updates. |
Source: Original research results
Stakeholder Analysis
The stakeholder analysis showed that the implementation of automation affects different areas in distinct ways. Production, quality, maintenance, safety, engineering, and financial management have their own needs, which reinforces the importance of organizing the investment by technical, operational, and managerial criteria. This reading aligns with the approach of Freeman (1984) and PMI (2021), who highlight the importance of considering the groups that can affect or be affected by an initiative. The same investment can be seen as an additional cost by one area and as a risk reduction by another. Table 12 details the contribution of HMI and supervision to each stakeholder.
Table 12. Reading of cases by stakeholders
| stakeholders | Main necessity | HMI Contribution | Supervisory contribution |
| Production | Operate with stability and little downtime. | Facilitates local command and standardizes routine. | Allows tracking history and comparing rows. |
| Quality | Investigate deviations with evidence. | Records part of the local operation. | Consolidates batches, schedules, events, and reports. |
| Workplace safety | Reduce exposure and manual interventions. | Supports standardized commands, local alarms, and interlocks. | Allows monitoring of events, pauses, alarms, and corrective actions. |
| Maintenance | Diagnose failures and reduce recurrence. | Shows equipment status and alarms. | Organizes alarm history and frequency. |
| Engineering | Avoid rework and standardize expansion. | Validate screens and nomenclatures in the pilot. | Define data architecture for the plant. |
| Financial Management | Justify investment with data. | Reduces initial disbursement risk. | Creates a baseline for measuring avoided losses and return. |
Source: Original research results
Reading by stakeholders also indicated the need for communication and training, with points of attention on screen comprehension, report usage, data validation, alarm response, record maintenance, and acceptance of new routines. This result reinforces the importance of shared acceptance criteria, involving production, quality, maintenance, engineering, safety, and financial management.
Governance necessary for expansion
Expansion to seven lines requires minimum governance, including standardization of names, tag structure, alarm criteria, access rules, backup periodicity, registration responsible parties, report validation, and criteria for changing screens or logic. Governance is also linked to vendor dependency, with documentation, training, and knowledge transfer treated as formal deliverables. Table 13 presents the recommended governance elements for the expansion.
Table 13. Recommended governance elements for expansion
| Governance element | Description | Reduced risk |
| Name pattern | Unique nomenclature for lines, silos, recipes, and alarms. | Operational confusion and maintenance difficulty. |
| Data structure | Minimum fields for history, batch, and report. | Incomplete or poorly comparable data. |
| Access control | Profiles for operation, maintenance, engineering, and management. | Improper changes and loss of reliability. |
| Backup and restore | Documented and periodically tested routine. | Loss of history and prolonged stop. |
| Change Management | Log of changes to logic, screen, and report. | Rework and inconsistency between rows. |
| Continuous training | Training for new users and refresher courses. | Incorrect use and low adoption. |
Source: Original research results
Post-implementation tracking indicators
Although the study did not calculate a definitive financial return, the results allowed for the proposal of monitoring indicators for collection before and after implementation, so that future financial evaluation can be based on measured data. The proposed indicators combine operational performance, safety, data quality, and economic benefits, allowing the project to be monitored not only by the technical functioning of the automation but also by variables that support a future economic comparison between alternatives. Table 14 organizes the suggested indicators for post-implementation monitoring.
Table 14. Suggested indicators for post-implementation monitoring
| Indicator | Purpose | Suggested periodicity |
| Average investigation time for deviation | Measure agility to reconstruct occurrences. | Monthly |
| Number of blocked batches | Evaluate impact of traceability on lock-ins. | Monthly |
| Divergence between predicted and actual consumption | Monitor dosage adherence and movement. | By order or batch |
| Number of recurring critical alarms | Prioritize causes of instability. | Weekly |
| Line breaks and pauses | Identify production bottlenecks and recurring causes. | Weekly |
| Manual interventions recorded | Monitor operational exposure and improvement opportunities. | Monthly |
| Technical support hours | Measure system maintenance cost. | Monthly |
| Reports consulted by management | Verify data usage in decision making. | Monthly |
Source: Original research results
Figure 7 presents a raw material reception screen, used as an example of an operational interface. The image illustrates the need to gather route, equipment, silo, status, sequence, recipe, and process values in a way that is understandable to the operator. The main takeaway associated with the figure is that the visual organization of the screen needs to follow the actual operational routine.
Figure 7. Example of raw material reception screen and transport route
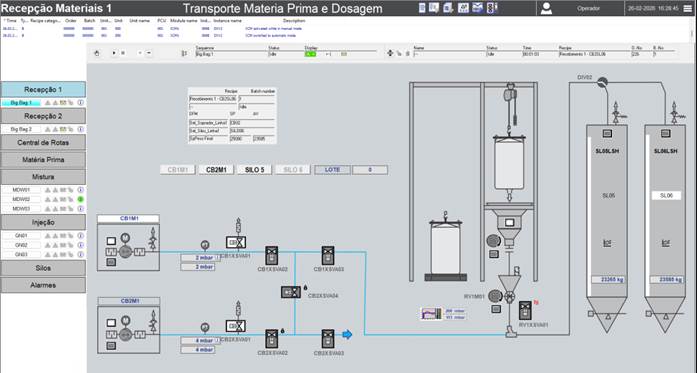
Source: Original research results
The results pointed to two conditions for implementation: starting with sufficient simplicity to reduce initial exposure and, at the same time, preserving the technical structure to allow future expansion without relevant rework. The decision between HMI and SCADA should not be treated as a purely technical or financial choice. The HMI, with lower initial exposure, can be a good entry step to validate local operation with less complexity. However, its managerial scope is limited when the company needs to consolidate history, traceability, reports, and comparison between lines. The SCADA, in turn, requires greater investment and care with governance, training, and standardization, but expands the factory’s analysis capacity by integrating production data, alarms, batches, downtimes, deviations, and indicators.
The core of the incremental analysis was to separate the decision to start from the decision to scale. Starting with a pilot HMI reduces initial risk, provided that this stage is built with standards compatible with a future supervisory layer. From this base, the evolution to the supervisory system on one line functions as information validation. After that, the expansion to more lines ceases to be an initial bet and becomes the repetition of an already tested solution. Thus, the recommended path is to advance in waves: define requirements, validate the pilot HMI, prepare the data structure, implement the supervisory system on one line, gradually expand, and measure the financial results with real operational data.
The techno-economic justification for automation depends on the combination of gradual implementation, risk management, and the ability to generate reliable information. Instead of treating HMI and supervisory systems as isolated choices, the analyzed cases showed that the HMI can validate local operation, while the supervisory system expands traceability, operational history, and the database necessary for future economic decisions. The HMI on a line assumed a role of operational validation, allowing for the correction of screens, alarms, nomenclatures, and routines before expanding the project’s exposure, aligned with ANSI/ISA-101.01-2015 (ISA, 2015).
The expansion to seven lines reduced the unit cost, but the incremental analysis was more important for the decision, according to Casarotto Filho and Kopittke (2010). Phased investment separates the decision to start from the decision to expand, preventing complete automation from being treated as a single outlay. Brealey et al. (2020) highlight that investment decisions depend on measurable benefits and estimable cash flows. The results indicate that, before calculating ROI, payback, NPV, or IRR, the company needs to create measurement capacity, and the supervisory system acts as infrastructure to transform losses, downtimes, rework, and investigation time into comparable data.
The supervisory system in a production line proved relevant as an information validation step, converging with Boyer (2004) by relating supervisory systems to the acquisition, monitoring, and organization of data from distributed processes. Traceability was one of the clearest differentiators between local automation and automation with supervisory control, aligned with Aung and Chang (2014) and ISO 9001:2015 (ISO, 2015). Tracing means reconstructing events, supporting audits, investigating deviations, analyzing consumption, and controlling raw materials. Operational safety is also part of the justification, approaching ISO 45001:2018 (ISO, 2018), by reducing manual interventions, organizing alarms, and recording critical events.
The stakeholder analysis showed that the same investment can be perceived in different ways by production, quality, maintenance, safety, engineering, and financial management, which aligns with the PMI (2021) on value delivery and stakeholder management. The findings indicate that the technical-economic justification for automation depends not only on the comparison between total costs but on the construction of an implementation path in waves: pilot HMI, preparation for supervisory, supervisory on one line, subsequent expansion, and financial measurement. This sequence combines financial prudence, operational learning, traceability, and data generation, offering a secure way to defend medium and long-term investments in factories that still rely on manual routines.
The results indicated that starting with a pilot line reduces the project’s initial exposure and allows for the correction of screens, alarms, nomenclatures, permissions, and routines before expanding the scope. The pilot functions as a learning and technical validation stage, and an alignment between operations, maintenance, quality, safety, engineering, and financial management. The expansion to seven lines presented an advantage in diluting fixed costs, but the lower average cost per line is not sufficient to define the best alternative. The decision must consider the organization’s maturity to sustain the solution, train users, maintain records, validate reports, handle backups, address alarms, and utilize the generated data in the decision-making process. The multi-criteria analysis reinforced that the most suitable alternative balances investment, implementation risk, safety, quality, traceability, user adoption, and the potential for generating reliable data.
The definition of financial indicators was another important point. ROI, payback, NPV, and IRR are useful, but depend on consistent measurements of losses, downtime, rework, scrap, alarms, blockages, investigation time, and raw material consumption. The supervisory system’s contribution is to create the necessary record base for future economic evaluation to be more robust and less dependent on informal estimates. As a practical contribution, the work proposed a phased implementation roadmap, starting with the HMI on one line, preparing the architecture for future integration, validating the supervisory system on one line, and expanding to the other lines only after proving the technical and operational adherence of the solution. This path transforms a complex investment decision into verifiable steps, with acceptance criteria, less uncertainty, and better communication between the involved areas.
In summary, automation must be justified as a planned evolution of industrial management. In factories with manual routines, the HMI can represent the first step to organize operations, while the supervisory system expands the capacity to record, compare, and decide. Phased implementation proved to be the most prudent path, allowing to start with less exposure, learn from the pilot, preserve the possibility of expansion, and build data to support more consistent financial decisions in the medium and long term.
4. Conclusion
This study sought to technically and economically justify medium and long-term investments in industrial systems automation, comparing implementation via Human-Machine Interface (HMI) and supervisory systems in a pilot line and seven production lines, with an emphasis on factories still reliant on manual processes. It was found that the HMI contributed to organizing and standardizing local operation, reducing improvisation and creating a standard for process interaction. In turn, the supervisory system expanded the capacity to record information, track histories, generate reports, support audits, and investigate bottlenecks, such as recurring pauses and consumption deviations. The main contribution of this work lies in proposing a phased implementation roadmap, which transforms a complex investment decision into verifiable steps, combining financial prudence, operational learning, traceability, and reliable data generation.
The research demonstrated that the justification for investing in automation should not be limited to immediate financial return, but should consider the reduction of uncertainties, losses, operational risks, and costs that accumulate over time. Phased implementation, starting with a pilot HMI and evolving to the supervisory system, proved to be the most prudent path, allowing for validation of local operation, preparation of the data structure, and building a robust foundation for future financial assessments. As a limitation, the study used reference cases and estimated costs, without monitoring a real implementation. For future studies, it is suggested to apply the model in a real industrial environment, measuring indicators before and after automation, and expanding the analysis to other segments, including maintenance and technological update costs, deepening the measurement of benefits generated by the supervisory system.
Bibliographic References
Aung, M.M.; Chang, Y.S. (2014). Traceability in a food supply chain: safety and quality perspectives. Food Control 39: 172-184.
Boyer, S.A. (2004). SCADA: supervisory control and data acquisition. 4. ed. Research Triangle Park, NC, EUA: ISA.
Brealey, R.A.; Myers, S.C.; Allen, F. (2020). Princípios de finanças corporativas. 13. ed. Porto Alegre, RS, Brasil: AMGH.
Casarotto Filho, N.; Kopittke, B.H. (2010). Análise de investimentos: matemática financeira, engenharia econômica, tomada de decisão, estratégia empresarial. 11. ed. São Paulo, SP, Brasil: Atlas.
Freeman, R.E. (1984). Strategic management: a stakeholder approach. Boston, MA, EUA: Pitman.
Gil, A.C. (2017). Como elaborar projetos de pesquisa. 6. ed. São Paulo, SP, Brasil: Atlas.
Groover, M.P. (2019). Automation, production systems, and computer-integrated manufacturing. 5. ed. New York, NY, EUA: Pearson.
International Organization for Standardization [ISO]. (2015). ISO 9001:2015: quality management systems – requirements. Geneva, Suíça: ISO.
International Organization for Standardization [ISO]. (2018). ISO 45001:2018: occupational health and safety management systems – requirements with guidance for use. Geneva, Suíça: ISO.
International Society of Automation [ISA]. (2015). ANSI/ISA-101.01-2015: human machine interfaces for process automation systems. Research Triangle Park, NC, EUA: ISA.
Kerzner, H. (2017). Project management: a systems approach to planning, scheduling, and controlling. 12. ed. Hoboken, NJ, EUA: Wiley.
Project Management Institute [PMI]. (2021). A guide to the project management body of knowledge (PMBOK Guide). 7. ed. Newtown Square, PA, EUA: Project Management Institute.
Yin, R.K. (2018). Case study research and applications: design and methods. 6. ed. Thousand Oaks, CA, EUA: Sage.
Article originating from the Final Course Work of the Specialization in Project Management at POLI USP PRO
To learn more about the course, click here.