
August 24, 2026
Factors Associated with the Quantity of Lands in Strategic Card Game Decks
Bruno Gebara Ichinoseki Penatti; Igor Pinheiro de Araújo Costa
DOI: 10.22167/2675-6528-202601753
Article derived from a Course Conclusion Work (TCC), with content based on the student’s original work and adapted to the editorial format of the E&S Magazine with the support of the ResumeAI tool, an artificial intelligence solution developed by Instituto Pecege for textual synthesis and organization.
Summary
The definition of the number of lands in custom-built strategic card game decks is crucial for competitive performance. The objective was to analyze the factors associated with the number of lands in competitive ‘decks’, through the estimation and comparison of multiple linear regression models, evaluating the contribution of structural variables and interaction terms. A database of 39,287 ‘decks’ with positive performance in championships was used, obtained by web scraping and enriched with variables such as average mana cost, draw and ramp cards, presence of ‘companion’, deck archetype, and number of colors. The model was estimated by Ordinary Least Squares. The results indicated that the number of lands did not depend solely on traditional factors, but also varied according to the archetype’s logic and its interaction with the number of colors. The proposed specification increased the R² from 0.40 to 0.57 on the training set and presented a lower mean absolute error in all seven archetypes analyzed and in seven out of eight land count ranges. It was observed that the unrestricted model was more accurate in 57.30% of the ‘decks’ in the test set, compared to 42.70% of the reference model. It was concluded that the incorporation of strategic variables, especially the archetype and its interaction with the number of colors, resulted in consistent predictive gain, offering an approach more sensitive to the differences between strategies for building competitive ‘decks’ and a useful tool for estimating the ideal number of lands. Keywords: Data analysis; Data science; Game strategy; Predictive modeling; Multiple regression.
1. Introduction
Since its launch in 1993, the strategic card game “Magic: The Gathering” has captivated millions of players globally. A central issue for competitive performance in this universe is determining the ideal number of lands in a deck, or “deck”, as it is commonly referred to by players. Lands are the fundamental resource of the game, as they allow players to generate mana, the energy needed to cast other cards and execute their strategies.
Initially, a simple heuristic, known as the “rule of thumb,” suggested that a “deck” should contain approximately one-third lands, one-third creatures, and one-third other spells. However, with the evolution and sophistication of the game and the competitive scene, this rule has become progressively insufficient to guide the construction of effective “decks” (Garfield, 2013). The complexity lies in the fact that each player builds a unique “deck,” which combines specific resources and answers, where lands are essential for mana generation and for executing plays that lead to victory.
The definition of the quantity of lands involves a delicate balancing problem. An excess of lands can ensure resource availability throughout the game, but reduces the proportion of cards that generate advantage and end the game. On the other hand, an insufficient number of lands compromises the execution of plays, preventing the player from using the cards drawn. In competitive environments, failure to make “land drops” in the early turns often results in loss of time, tempo, and, often, the game itself.
The relevance of this problem is amplified by the magnitude of “Magic: The Gathering” as a global phenomenon. The game is recognized as the first modern “trading card game”, with over fifty million players and a presence in more than one hundred and fifty countries (Hasbro, 2026). Unlike games with fixed rules, such as chess, “Magic” allows for the personalized construction of “decks”, which transforms it into a highly dynamic and experimental system, with over thirty-seven thousand seventy-seven unique cards cataloged (Scryfall, 2026).
The growth of the competitive landscape, driven by the digitalization of matches and online platforms, has enabled the systematic recording of results. This abundance of data has allowed mathematics and statistics to become central to understanding “deck” building decisions, enabling the transition from stochastic analyses to data-driven empirical approaches.
Despite the advances, previous predictive models, which use variables such as average mana cost (CMC), the quantity of cheap draw cards (Cheap_draw), the quantity of cheap ramp cards (Cheap_ramp), and the presence of ‘companion’, do not fully capture the complexity of building competitive “decks”. It is observed that not all variables act linearly on the number of lands; for example, CMC can exhibit curvature beyond a certain threshold. Strategic variables such as the number of colors and the “deck” archetype have shown low explanatory power in isolation, but gain significant relevance in interaction, altering the mana requirement according to the strategic proposal (Kutner et al., 2004; Gujarati, 2011).
This gap in understanding, especially regarding the non-linear effects and interactions between strategic variables, justifies the need for a more in-depth study. A model that incorporates these nuances can offer a representation more aligned with the heterogeneity observed in competitive “decks”, contributing to a more complete understanding of the composition of the mana base. Given this context, the present study aims to analyze the factors associated with the quantity of lands in competitive “decks”, through the estimation and comparison of multiple linear regression models, evaluating the contribution of structural variables of the “deck” and the incorporation of interaction terms between strategic variables to expand the explanatory power of the model.
2. Material and Methods
The research was characterized as a quantitative study, with an econometric methodological approach, aiming to analyze the factors associated with the quantity of lands in competitive decks of the game “Magic: The Gathering”. The central objective was to estimate and compare multiple linear regression models to understand how structural variables of the decks contribute to the composition of the mana base, seeking to identify empirical patterns of successful construction.
The unit of analysis consisted of competitive card decks, referred to as “decks”, from the game “Magic: The Gathering”. The initial database was obtained from the Kaggle platform, compiled by Karsten (2022), and comprised 95,143 “decks” with positive performance in tournaments. The selection of these “decks” was based on the premise that lists with a higher win rate reflect more efficient construction choices, focusing on 60-card decks in the competitive standard format.
The explanatory variables included the average mana cost (AMC), a continuous quantitative variable, and the number of cheap draw (Cheap_draw) and cheap ramp (Cheap_ramp) spells, both discrete, defined for cards with a mana cost of two or less. The presence of the “companion” mechanic was treated as a dichotomous categorical variable. Modal double-faced cards (MDFCs), playable as lands or spells, were categorized as mythic or non-mythic to analyze their partial contribution as lands.
To improve the model, a data enrichment step was performed, as the variables for number of colors and archetype were not originally present. Web scraping, automated with the Macro Recorder software, was used to extract detailed information from “decklists” from available hyperlinks. This procedure allowed the collection of additional data for 39,287 “decks” out of the initial 95,143, forming a consistent subset for modeling. The unavailability of links for some “decks” limited the complete collection.
From the “decklists” collected via web scraping, Excel formulas were developed to identify the archetype of each “deck” based on its name and constituent cards. The archetypes were categorized into ‘Aggro’, ‘Control’, ‘Midrange’, ‘Combo’, ‘Ramp’, ‘Tempo’, and ‘Lands’, and incorporated into the model as dummy variables, with ‘Midrange’ serving as the reference category (Wooldridge, 2012). The number of colors was treated as a quantitative variable, identified by the presence of colors in the deck’s cards, to avoid multicollinearity.
For the estimation and comparison of the models, the enriched database was randomly divided into two subsets: 95% of the observations were allocated to the training of the econometric models, and the remaining 5% were reserved for testing. This division followed the logic of the “hold-out” method or “validation set approach”, which allows evaluating the model’s performance on data not used in training (Kuhn; Johnson, 2013). The analysis and estimation of the models were performed in the Spyder 3.13 software, using the Python programming language.
The determination of the weight of MDFCs in the total land count was a crucial step. Initially, the database was divided into “decks” with and without MDFCs. A linear regression was fitted to the sample of “decks” without MDFCs to estimate the expected amount of pure land. Then, the difference between the predicted and observed lands in the “decks” with MDFCs was calculated. An auxiliary Ordinary Least Squares (OLS) model was then used to estimate the coefficients representing the average land fraction associated with each type of MDFC (mythic and non-mythic).
With the estimated MDFC weights, the dependent variable ‘Lands_mdfc’ was constructed, representing the adjusted number of plots, summing pure plots to the weighted contribution of MDFCs. Karsten’s (2022) model was replicated via OLS in Python, using ‘Lands_mdfc’ as the dependent variable and ‘CMC’, ‘Cheap_draw’, ‘Cheap_ramp’, and ‘companion’ as explanatory variables. Subsequently, the model was extended with the inclusion of a quadratic term for ‘CMC’ and interaction terms between ‘Quantity_of_colors’ and ‘Archetype’, to capture nonlinearities and conditional effects.
3. Results and Discussion
The research results were structured to present and discuss the findings related to the factors influencing the quantity of lands in competitive decks of strategic card games. Initially, a reference model was established, followed by the introduction of strategic variables and interaction terms. The comparative analysis between the models allowed the identification of the contribution of the new variables to the predictive capacity and the understanding of deck heterogeneity. Finally, the applicability of the model to different deck sizes was explored, consolidating the interpretation of the findings. Model parameters proposed by Karsten
To establish a point of comparison, a baseline model inspired by Karsten (2022) was estimated. This model used the training set, which comprised 37,322 observations from the filtered sample. The results indicated an R² of 0.399, meaning that approximately 39.9% of the variation in the amount of adjusted land (Lands_mdfc) was explained by the variables included in the specification. Although this is a relevant result, it also suggests that a significant portion of the variation is still not captured by this simpler set of regressors.
The F-test of the baseline model demonstrated statistical significance (p<0.001), confirming that, together, the explanatory variables contribute significantly to the prediction of the dependent variable. Additionally, all individual variable coefficients were statistically significant, indicating that the probability of their true effects being null is very low. The estimated model equation, which relates the number of lands to the average mana cost (CMC), draw cards (Cheap_draw), ramp cards (Cheap_ramp), and the presence of a companion, is presented below.
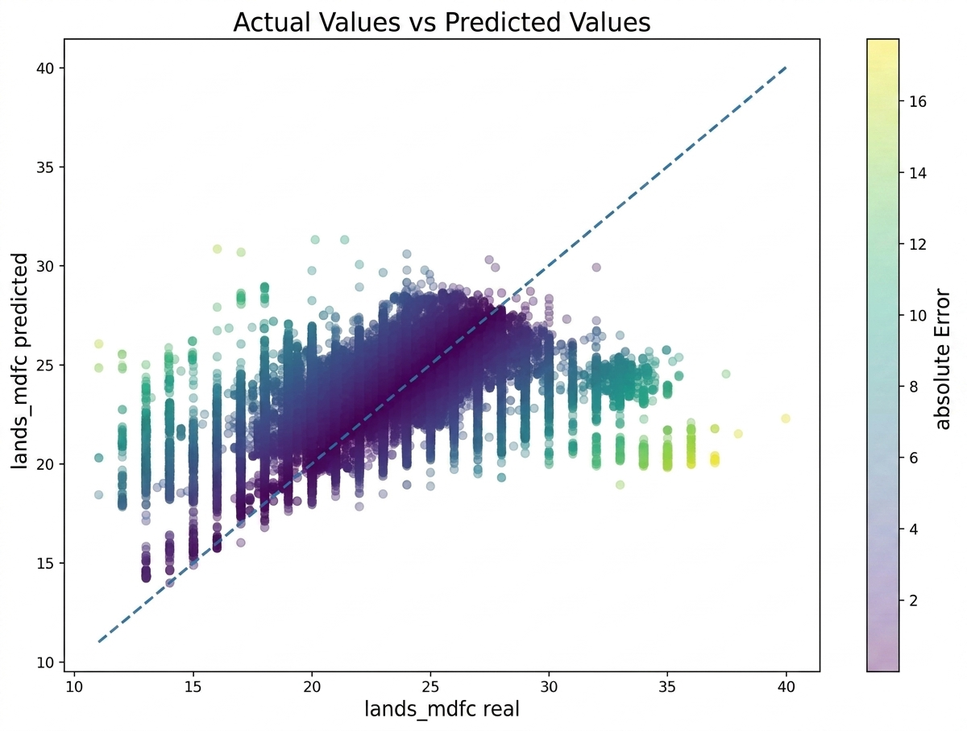
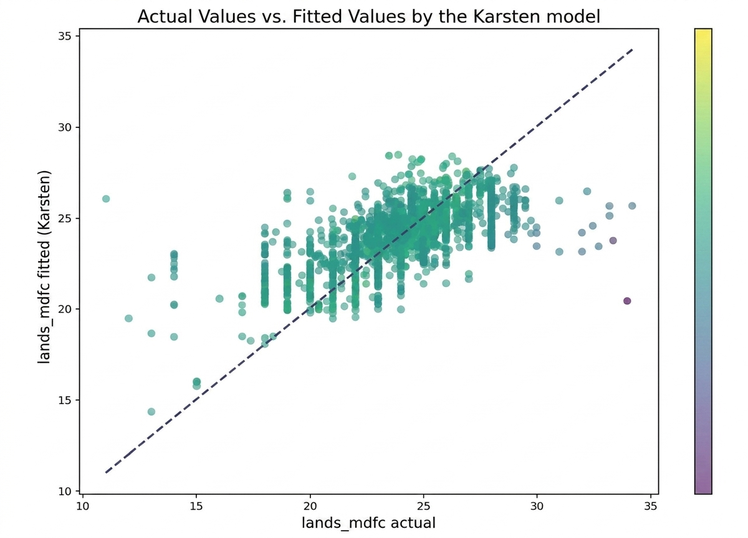
The replication of Karsten’s model was considered successful, as the estimated coefficients were consistent with the values reported by the author, even with a step-by-step description of the methodology. To assess the quality of the fit, the actual values and the predicted values of the model were compared. Figure 1 illustrates this comparison, showing that the model captures the general trend of the data, but still presents dispersion.
Figure 1. Actual Values and Fitted Values of Lands_mdfc in Karsten’s model.
Source: Elaborated by the author, 2026.
It was observed that Karsten’s model adjustment is more effective in the central range of the distribution, specifically between 20 and 28 fitted terrains. At the extremes, the model tends to overestimate decks with few terrains and underestimate those with many terrains. This pattern suggests that, from certain higher values of terrains, the relationship may cease to be purely linear, indicating the need to incorporate variables that were not initially considered.
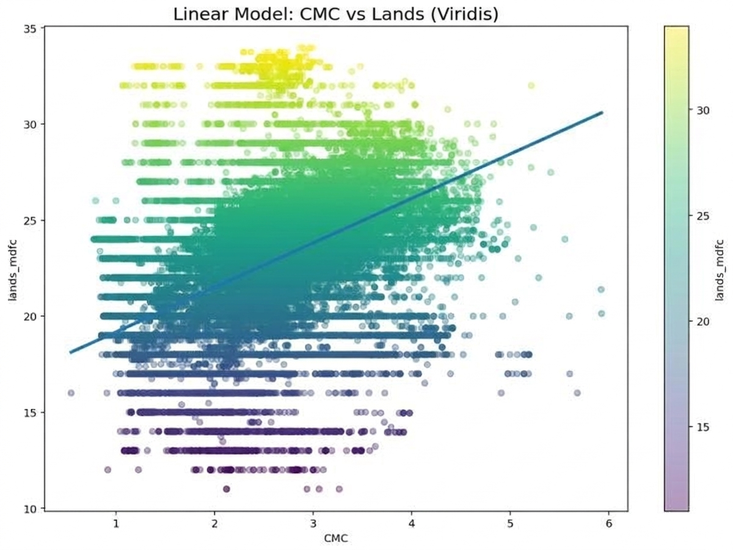
Figure 2 demonstrates the linear relationship between the average mana cost (AMC) and the number of lands adjusted in the initial model. It is noted that, from approximately 28 lands onwards, the linear model does not adequately follow the observed behavior. This limitation indicates that the relationship between AMC and the number of lands is not strictly linear across the entire data spectrum, which justifies the inclusion of more complex terms.
Figure 2. Relationship between the average mana cost (AMC) and the number of adjusted lands in the linear model.
Source: Elaborated by the author, 2026.
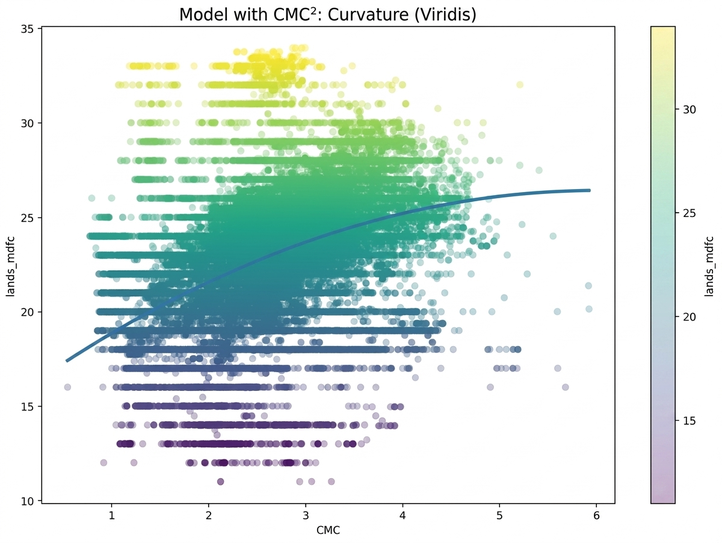
To enhance predictive capability, a quadratic term was introduced for the average mana cost (CMC²). Figure 3 shows that this inclusion imposes a curvature that smooths the growth at higher CMC values, partially deviating from the previous linear visual pattern. This modification is crucial for capturing the observed nonlinearity in the relationship between CMC and the number of lands, making the model more flexible.
Figure 3. Relationship between the average mana cost (CMC) and the number of adjusted lands in the model with a quadratic term.
Source: Elaborated by the author, 2026.
Despite the inclusion of the quadratic term, the comparison between the correlation matrices revealed a limited gain in R², which went from 0.395 to 0.404. This increment, although small in practical terms, indicates that the new specification added little explanatory power. The correlation between CMC and CMC² proved to be extremely high, reaching 0.9835, which highlights strong multicollinearity between these variables. In other words, the model began to incorporate two very similar variables, generating little additional explanatory capacity and increasing instability in the interpretation of the coefficients.
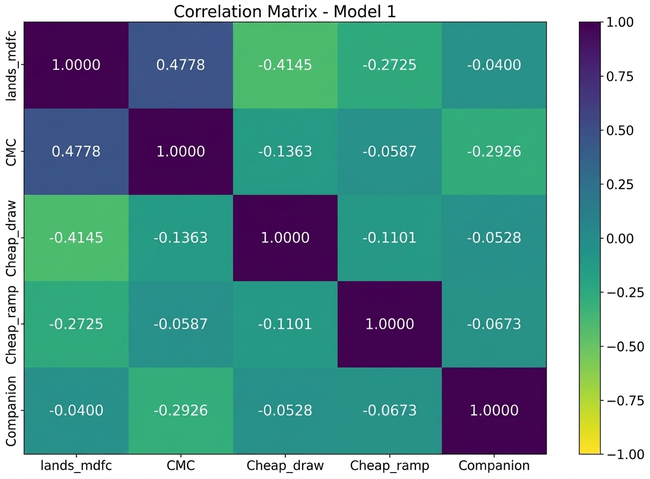
Given this, it was understood that the main limitation of the model did not lie solely in the functional form between CMC and terrains, but in the absence of variables capable of capturing structural differences between the decks. For this reason, the research was redirected to the mapping of archetypes. Figure 4, which presents the correlation matrix of the quadratic model, shows that, although the R² is lower (0.395) compared to Karsten’s model, it exhibits low multicollinearity between its independent variables.
Figure 4. Correlation matrix of the quadratic model variables.
Source: Elaborated by the author, 2026.
Figure 5, which presents the correlation matrix of Karsten’s model variables, shows that the correlations between the explanatory variables are relatively low. This result was decisive in redirecting the analysis, allowing the incorporation of variables such as archetypes and number of colors. The objective was to explain the change in the linear behavior of the model beyond 27 terrains, seeking a more faithful representation of the complexity of competitive decks.
Figure 5. Correlation matrix of Karsten Model variables.
Source: Elaborated by the author, 2026. Unrestricted final model parameters with archetypes and colors
In the final model estimation stage, the number of colors, archetypes, and interaction terms between these dimensions were incorporated. Using the same training base of 37,322 observations, the unrestricted model achieved an R² of 0.567. This means that 56.7% of the observed variation in Lands_mdfc is now explained by the new specification, representing a significant gain in explanatory power compared to the baseline model, whose R² was 0.399.
This expressive gain suggests that the inclusion of archetypes and the interaction with the number of colors captured a significant part of the heterogeneity among decks that previously remained hidden. The unrestricted model’s F-test was also statistically significant (p<0.001), indicating that, together, the explanatory variables robustly contribute to explaining the dependent variable. This result validates the approach of expanding the model to include strategic characteristics of the decks.
The most relevant result of the unrestricted model is the finding that the interaction terms between the number of colors and the archetype showed statistical significance in all cases. This indicates that the effect of the number of colors on the quantity of lands is not uniform across decks, varying according to the adopted strategy. In other words, adding a color to an Aggro, Combo, Ramp, or Lands deck does not produce the same impact on the mana base.
The estimated coefficients for each archetype in the unrestricted model were defined in comparison to the Midrange archetype, which served as the reference category. For the other archetypes, the archetype coefficient should be interpreted as an intercept shift relative to Midrange, while the color modifier indicates how the effect of the number of colors changes in that specific group. Thus, the total effect of colors in each archetype results from the sum between the general color coefficient and the respective interaction term.
The data indicated that the Midrange archetype, used as a reference, presented a total color effect of 0.6391. For the Aggro archetype, the total effect was -0.0357, while for Combo it was 1.3505. Control registered 0.3789, Lands 2.4478, Ramp -0.4686, and Tempo 0.3547. These values show the complexity of the interaction between the number of colors and the archetype in determining the number of lands, evidencing that mana necessity is highly dependent on the deck’s strategy. Comparison between the unrestricted model and Karsten’s model
After the estimation of the unrestricted model, a detailed comparison was made with the linear model inspired by Karsten. The test set, composed of 1,965 observations, was used for this comparison. The analysis focused on five main perspectives: number of observed wins, win percentage, mean absolute error (MAE), root mean square error (RMSE), and test R². These criteria allowed for a comprehensive evaluation of each model’s performance.
Table 2, which synthesizes the general comparison of the models, revealed that the unrestricted model obtained a test R² of 0.563127, significantly higher than Karsten’s model R² of 0.418491. In terms of observed wins, the unrestricted model won in 1,126 decks, while Karsten’s model won in 839. This corresponds to 57.3% of the observations for the proposed model, versus 42.7% for Karsten’s model. These results indicate that the inclusion of archetypes, number of colors, and interaction terms expanded the model’s ability to capture patterns that Karsten’s linear formulation could not fully represent.
In terms of Mean Absolute Error (MAE), the unrestricted model presented a value of 1.313389, lower than the MAE of 1.490426 from Karsten’s model. Similarly, the RMSE of the unrestricted model was 1.789366, lower than the RMSE of 2.064428 from Karsten’s model. These error indicators reinforce the predictive superiority of the unrestricted model, demonstrating that it offers more accurate estimates of the quantity of lands in competitive decks. Observation-to-observation comparison
In the observation-to-observation comparison, the unrestricted model was more accurate in 57.3% of the decks in the test base, versus 42.7% for the reference model. This result reinforces that the incorporation of strategic variables, especially the archetype and its interaction with the number of colors, translated into consistent predictive gain. In-depth analysis by subtopics allowed for the identification of the nuances of this performance. Comparison by archetype
The disaggregated comparison by archetype, according to Table 3, revealed a consistent pattern: the unrestricted model presented lower average absolute error in all analyzed archetypes. For the Midrange archetype, the unrestricted model won 256 times, against 166 wins for Karsten’s model, reducing the average error from 1.39 to 1.16. In the Ramp archetype, the unrestricted model obtained 124 wins against 43 for Karsten’s model, with the average error reduced from 2.65 to 1.82. For Aggro, the unrestricted model won 450 times, against 368 for Karsten’s model, also with a lower average error.
The Combo archetype, however, presented a distinct scenario. Karsten’s model won 67 times and the unrestricted model 66, indicating that the win frequency was practically tied, with a slight numerical advantage for Karsten’s model. However, the unrestricted model’s mean absolute error was 1.95, compared to 2.01 for Karsten’s model. This suggests that, in Combo, the proposed model may not win as frequently, but when it does, it tends to produce greater gains or compensate for this difference.
For the Lands archetype, the unrestricted model won more often and substantially reduced the average error, going from 5.45 to 3.15. This behavior converges with the logic of the model itself: decks whose mana base deviates from the average tend to benefit more from a specification that incorporates archetype, number of colors, and interactions between these variables. The results suggest that the advantage of the unrestricted model is not concentrated in just one subset of the sample, but extends across aggressive strategies, slower ones, and decks with archetypes whose land structure is more particular.
Figure 6, which compares the actual and predicted values by the unrestricted model, shows that the “fitted values” of the unrestricted model remain more adherent to the reference line, suggesting greater predictive capacity compared to Karsten’s model. Additionally, the color scale reinforces this interpretation by indicating a predominance of observations where the error of the unrestricted model is lower than the error of Karsten’s model. This superiority is reinforced by the differences found in Figure 7.
Figure 6. Comparison between the actual values and the values predicted by the unrestricted model, and comparison of model errors.
Source: Elaborated by the author, 2026.
Figure 7, which compares the actual values and those predicted by Karsten’s model, shows that the unrestricted model presents a lower mean absolute error compared to Karsten’s model. This advantage is particularly notable in the land ranges where Karsten’s model has shown greater difficulty in predicting accurately. The analysis of errors between the models reinforces the robustness of the proposed approach.
Figure 7. Comparison between the actual values and the values predicted by Karsten’s model, and comparison of model errors.
Source: Elaborated by the author, 2026. Comparison by range of adjusted number of lots
Table 4, which compares model errors by terrain band, revealed that the unrestricted model was superior in seven of the eight bands analyzed, both by the criterion of number of wins and by the majority of average error cases. The only exception was the band of 25 to 26 adjusted terrains, where Karsten’s model won more often (389 versus 247) and presented a lower average error (0.93 versus 1.08). In the other bands, the unrestricted model showed a consistent advantage.
This difference is especially strong in the lower ranges, such as less than 20 lots and between 21 and 22 lots, and becomes more pronounced as the number of lots moves away from the center of the distribution. For example, between 29 and 30 lots, the unrestricted model won 63 times, compared to only 2 wins for Karsten’s model, in addition to reducing the average error from 3.36 to 2.125. A similar pattern appears in the 31-32 and 33+ ranges, where Karsten recorded no wins and still showed substantially higher average errors.
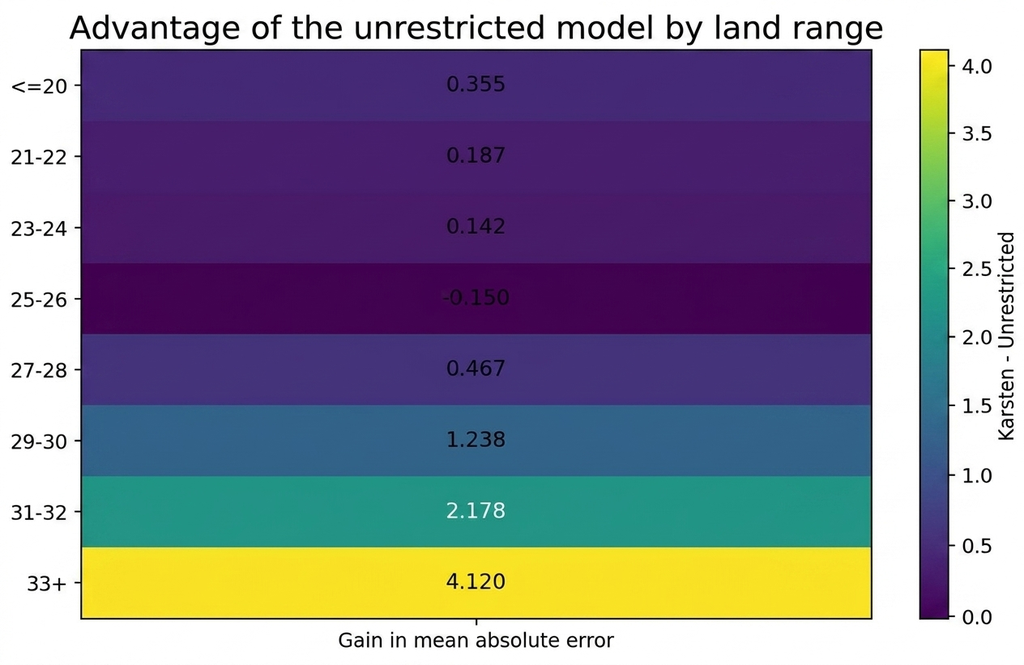
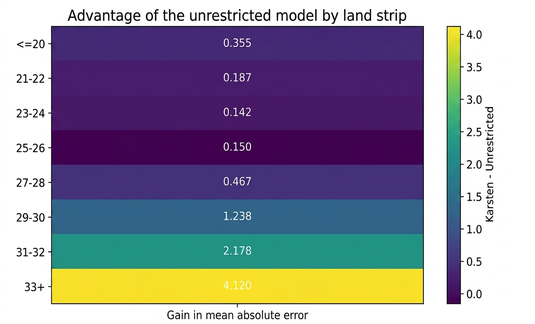
This result suggests that Karsten’s model remains relatively competitive in the more “normal” zone of the distribution, where the mana structure approaches the average pattern. In contrast, the unrestricted model seems to respond better precisely to decks that deviate from this central behavior, especially when the number of lands becomes more extreme. Figure 8 illustrates this advantage, showing the land ranges in which the unrestricted model showed a greater gain in mean absolute error.
Figure 8. Comparison of errors by band between models.
Source: Elaborated by the author, 2026.
Figure 8 shows, through warmer tones, the terrain ranges where the unrestricted model proposed in this work presented a greater advantage over Karsten’s model, that is, those where it obtained a lower mean absolute error. It is observed that this superiority becomes more intense in the higher terrain ranges, reinforcing the unrestricted model’s ability to handle heterogeneity and the specificities of non-standard decks. Applying the model to “decks” of 40, 60, and 100 cards
The final model estimated in this work was built from decks of 60 cards. However, following the logic proposed by Karsten (2022), it is possible to adapt it for decks of other sizes through proportional scaling of the coefficients. The central idea is that, when increasing or decreasing the deck size, the structural mana cost also tends to vary approximately in the same proportion. Thus, the general components of the model can be multiplied by the ratio between the new deck size and 60 cards.
The same principle used by Karsten was adopted: coefficients related to the general structure of the deck, such as intercept, CMC, and the number of cheap draw and acceleration spells, are adjusted proportionally to the deck size. Meanwhile, coefficients associated with cheap draw and mana acceleration spells are kept constant. This is because these cards exert a similar corrective effect on the mana base regardless of the total deck size, functioning as elements that reduce the need for lands by an approximately fixed magnitude.
This adaptation should be understood as an analytical approximation, and not as a specific re-estimation for each format. Nevertheless, the proposed adaptation is useful as a starting point, as it preserves the economic and statistical logic of the estimated model. Furthermore, it offers a consistent way to transport its results to contexts with different deck sizes, allowing the final equation to be used not only in traditional 60-card lists, but also in 40- and 100-card environments, with the due interpretative cautions.
From these formulas, an Excel calculator was developed, made available as supplementary material, which automates the application of the model and allows the player to quickly estimate the ideal number of lands for 40, 60, and 100-card decks. To do this, simply input the model’s input variables. This practical tool facilitates the use of the research findings by players and deck builders, making the theory accessible and applicable in the competitive context.
In summary, the results obtained in this study demonstrate that the quantity of lands in competitive Magic decks does not depend solely on traditional factors such as average mana cost, card draw, and mana acceleration. The analysis revealed that this quantity also varies significantly according to the archetype’s logic and how the number of colors combines with the deck’s strategy. The incorporation of these strategic variables and their interaction terms into the proposed model expanded the explanatory power and prediction accuracy, especially for decks that deviate from the average standard, responding more effectively to the heterogeneity observed in the competitive scene.
4. Conclusion
This study analyzed the factors associated with the quantity of lands in competitive decks of strategic card games, seeking to improve the understanding of mana base composition through the estimation and comparison of multiple linear regression models. It was found that traditional predictive models, although relevant, presented significant limitations, especially in representing decks with extreme quantities of lands and in capturing strategic heterogeneity. The incorporation of variables such as deck archetype and number of colors, along with their interaction terms, proved to be crucial. A significant gain in explanatory power was observed, with the R² of the proposed model increasing from 0.40 to 0.57 in the training set. In tests with unseen data, the unrestricted model outperformed the reference model in 57.3% of the decks, showing lower mean absolute error in all seven analyzed archetypes and in seven out of eight land quantity ranges. This approach, more sensitive to differences between strategies, offers a useful tool for estimating the optimal quantity of lands, materialized in a calculator that facilitates the practical application of the findings.
The main contribution of the work lies in demonstrating that the quantity of lands does not depend solely on basic structural factors, but is significantly modulated by the logic of the archetype and the interaction with the number of colors, providing a representation more aligned with the complexity of competitive decks. However, the study faced limitations due to the reliance on additional information for the classification of archetypes and colors, which restricted part of the database used in the advanced stages of modeling, and the classification of archetypes itself involves inherent simplifications. For future research, it is suggested to improve the classification of archetypes, explore more complex non-linear relationships, and expand the analysis to other competitive formats and environments, allowing for an even more comprehensive understanding of strategic choices in deck building.
Bibliographic References
Garfield, R. 2013. The creation of Magic: The Gathering. Disponível em: https://magic.wizards.com/en/news/making-magic/creation-magic-gathering-2013-03-12. Acesso em: 15 abr. 2026.
Gujarati, Damodar n.; Porter, Dawn C. Econometria Básica. 5. ed. Porto Alegre: AMGH, 2011.
Hasbro. 2026. Magic: The Gathering. Disponível em: https://investor.hasbro.com/magic-gathering. Acesso em: 15 abr. 2026.
Karsten, Frank. How Many Lands Do You Need in Your Deck? An Updated Analysis. TCGplayer, 2022. Disponível em: How Many Lands Do You Need in Your Deck? An Updated Analysis. Acesso em: 16 abr. 2026.
Kuhn, Max; Johnson, Kjell. Applied predictive modeling. New York: Springer, 2013.
Kutner, M.H.; Nachtsheim, C.J.; Neter, J. 2004. Applied linear regression models.
Scryfall. 2026. Search results for unique cards in Magic: The Gathering. Disponível em: https://scryfall.com/search?as=grid&dir=&order=released&q=unique%3Acards+name%3A%2F%5E.%2B%24%2F. Acesso em: 15 abr. 2026.
Wooldridge, J.M. 2012. Introductory econometrics: a modern approach. 5ed. Cengage Learning.
Article originating from the Final Course Work of the Specialization in Data Science and Analytics of the MBA USP/Esalq
To learn more about the course, click here and access the MBX Academy platform