
Marketing
December 02, 2025
Digital marketing strategies for e-commerce: case study in an industrial company
Authors: Jefferson Andrade Leite and Rafael Toassi Crispim
DOI: 10.22167/2675-6528-2025026
E&S 2025, 6: e2025026
In the era of information and the network society, technological transformations reconfigure social, cultural, and economic interactions on a global scale. For industries, this reality demands adaptation to a digital market where innovation and data mastery are critical factors of competitiveness[1].
In this scenario, new opportunities stand out, such as e-commerce Direct-to-Consumer (D2C), a model in which the industry itself sells directly to the final consumer through its digital channels, without intermediaries. This format gains relevance by allowing direct sales to the final consumer, by eliminating intermediaries in the value chain, reducing costs, increasing control over the customer experience, and accelerating revenue cycles[2,3].
According to data, e-commerce in Brazil grew 4.8% in 2023, totaling R$ 196.1 billion; since 2016, the volume has more than quintupled. In the industrial sector, in 2022, 40.4% of companies had an area dedicated to e-commerce; in 2023, this number increased to 66.7%, and 65% concentrated their sales in exclusively digital channels[4,5].
However, Brazilian industries face challenges in implementing D2C due to low digital maturity — more than half are in the initial stage of digitalization — as well as a scarcity of qualified professionals, weaknesses in data-driven management, uncertainties in structuring e-commerce teams, and logistical and digital marketing obstacles[2,6,7].
Among these challenges, digital marketing plays a relevant role, as it practically functions as the engine of the D2C business model, by attracting customers and maximizing conversion. However, gaps in digital maturity, processes, and skills hinder its execution in industries, especially regarding complex strategies for e-commerce[4,6,8].
Given this context, the objective of this research is to identify and discuss the digital marketing strategies implemented by an industrial company, as well as to measure their effects on D2C e-commerce in terms of traffic generation and sales. From a theoretical point of view, the study is based on the analysis of digital marketing indicators for e-commerce, focusing on organic and paid marketing strategies[8].
This research was characterized as a single case study[8] and enabled an in-depth analysis of a specific phenomenon, with the identification of patterns, causal relationships, and insights that are difficult to obtain by other methods. It adopted a descriptive approach[10], based on the observation, recording, and analysis of facts, with the purpose of offering a detailed and precise description of the investigated object.
To achieve the objective, criteria were defined for the selection of the industry: (i) established D2C e-commerce channel; (ii) successful track record in implementing digital marketing strategies for e-commerce; (iii) presence in multiple digital channels; (iv) practice of data analysis and marketing metrics; and (v) recurring investment in digital advertising.
Based on these criteria, Company A was selected, a traditional Brazilian industry, which had approximately 1,800 employees, headquarters in São Paulo (SP) — the main research location — and factories in Mogi das Cruzes (SP) and Manaus (AM). With over 60 years of operation and an approximate annual revenue of R$ 2 billion, it had five Business Units (BUs).
A BU was chosen, with about 150 employees and annual revenue of around R$ 500 million, focused on the food-service market. At the end of 2020, the BU began its digital transformation by launching a D2C e-commerce platform for the sale of ice cream machines, with the objective of increasing brand visibility, revenue, reach, and channel diversification.
After the implementation of e-commerce, logistics began to manage shipping, inventory, and policies; finance took over payments, gateway, risk analysis, and financial rules; and marketing became responsible for the website, visual communication, content, data, metrics, and evolution plan. This configuration aligns with the Hybrid report, on the challenges of the industry in e-commerce[4], according to which 35.7% of industries allocate e-commerce under the responsibility of the marketing department. The direct operation of the channel involved four professionals: two marketing analysts and one coordinator, in addition to an Information Technology (IT) analyst.
Data collection was based on two main sources, between 2020 and 2022: (i) direct observation and (ii) analysis of internal documents. Document collection focused on reports, dashboards, and a database with information from the marketing and sales areas, obtained through different tools, such as Google Analytics (e-commerce and blog), RD Station (CRM and email marketing), Meta Business Suite (Instagram), and reports from third-party advertising agencies, while sales data were extracted from commercial reports[9].
The data analysis was performed using the methodology of evaluating digital marketing Key Performance Indicators (KPIs), as suggested by Kotler and Carboni[8]. The digital marketing indicators, their formulas, and the selected data sources are presented in Table 1 below:
Table 1. Indicators, formulas for analysis and data source
| Indicator | Formula | Data source |
| ROI (Return on Investment) | ROI = ((Revenue generated – Investment made) / Investment made) × 100 | Revenue generated: Commercial Report Investment made: Marketing Database |
| CAC (Customer Acquisition Cost) | CAC = Total invested in marketing and sales actions / Number of acquired customers | Number of acquired customers: RD Station Investment made: Marketing database |
| CPL (Cost Per Lead) | CPL = Total invested in lead generation campaigns / Number of leads generated | Number of leads generated: RD Station Investment in campaigns: Marketing database |
| CVR (Conversion Rate) | CVR = (Number of sales / Total number of leads) × 100 | Number of sales: RD Station and Commercial Report Number of leads generated: RD Station |
| Sales | Total number of transactions carried out | RD Station and Commercial Report |
| Prospects | Total number of leads captured | RD Station |
| Sessions | Counting the total number of sessions on a website | Google Analytics |
| Representativeness of sessions | (Number of sessions of a specific channel / Total number of sessions) × 100 | Google Analytics |
| Bounce rate | (Number of single-page sessions / Total number of sessions) × 100 | Google Analytics |
| Average session duration | Total time of all sessions / Total number of sessions | Google Analytics |
| Engagement rate | (Total interactions / Total impressions or followers) × 100 | Meta Business Suite |
| CPC (Cost Per Click) | CPC = Total invested in ads / Total number of clicks | Total ad investment: Advertising agency report, Meta Business Suite Clicks: Advertising agency report, Meta Business Suite or Google Analytics |
| Impressions | Total number of times an ad or content was displayed | Advertising agency report, Meta Business Suite or Google Analytics |
| Clicks | Total number of registered clicks | Advertising agency report, Meta Business Suite, Google Analytics or RD Station |
The strategies implemented by Company A were identified. Next, the main indicators were organized into a detailed table, and the trend of KPIs was analyzed to identify patterns and variations that impacted traffic and sales performance. Finally, the evidence and results were discussed in light of the literature.
The company classified digital marketing strategies into paid marketing and organic marketing, in line with the literature[11]. Paid involves direct investments, while organic encompasses tactics that generate results without direct financial expenditure. This classification was adopted to facilitate communication with internal stakeholders and reduce the barrier of technical jargon.
Table 1 presents the quarterly schedule of digital marketing strategies and channels implemented by the company to leverage e-commerce results.
Table 1. Digital marketing strategies implementation schedule
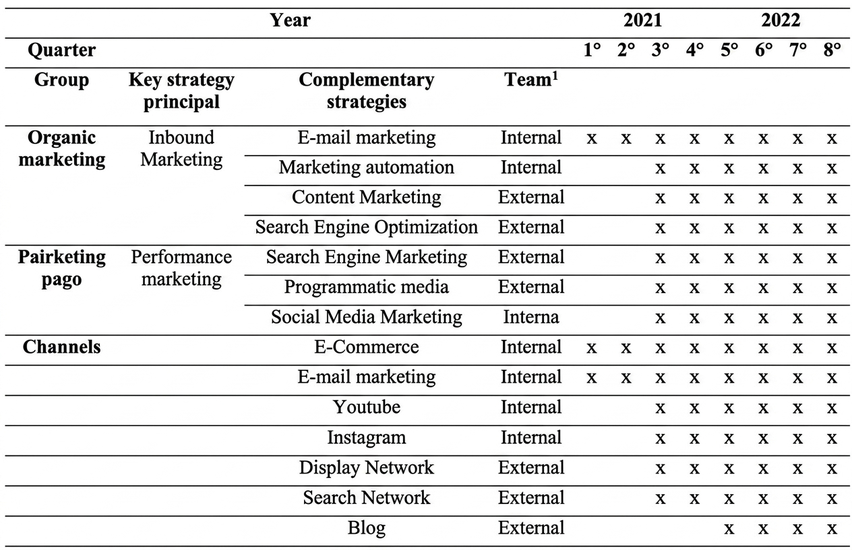
Note: ¹Internal team: Conducted by the internal marketing team; External team: Conducted by a specialized third-party agency.
For the analysis of the KPIs of the strategies of this research, Table 2 was elaborated, based on internal documents of Company A[8].
Table 2. Selected indicators for analysis
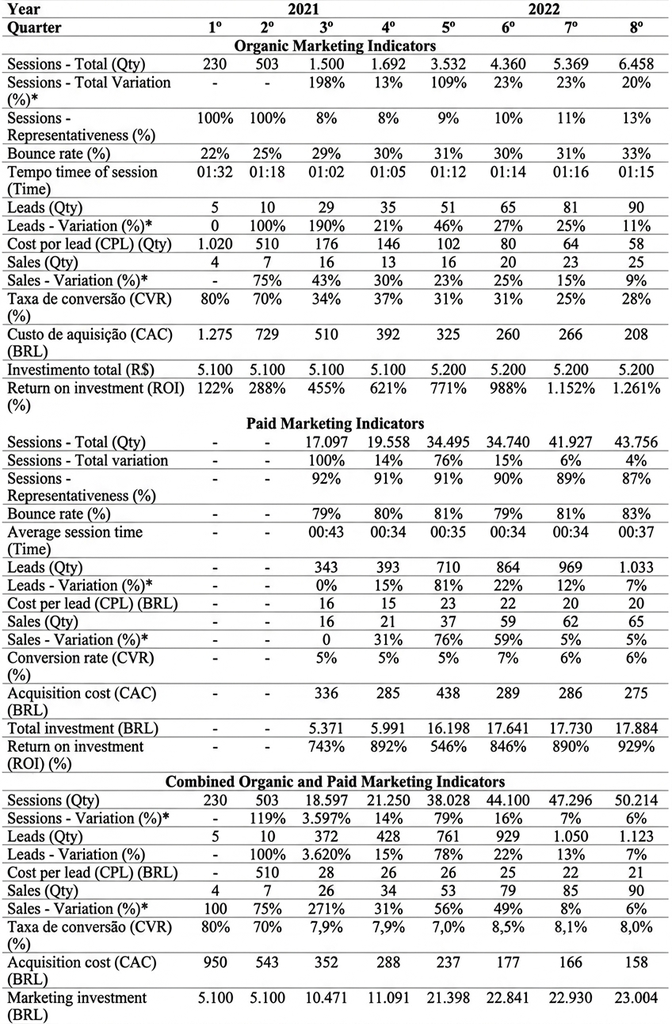
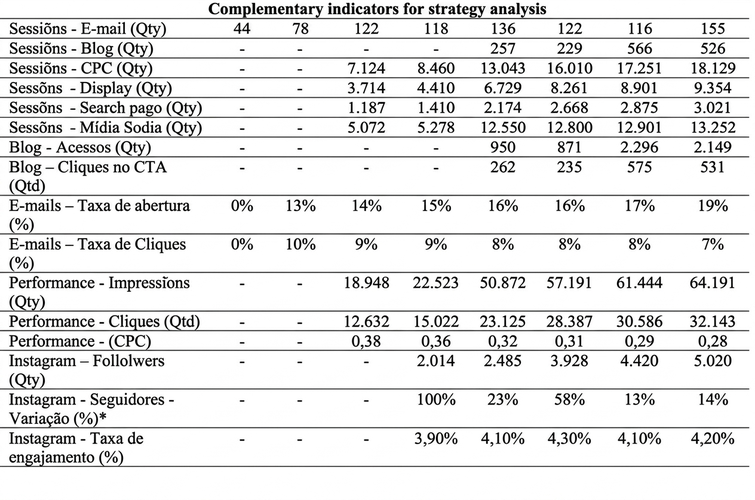
Note: * (%) Variation indicates the percentage variation in relation to the previous quarter.
The main organic marketing strategy was inbound marketing. Figure 1 represents how Company A applied this methodology to attract, convert, close, and retain customers throughout the buying journey[12].
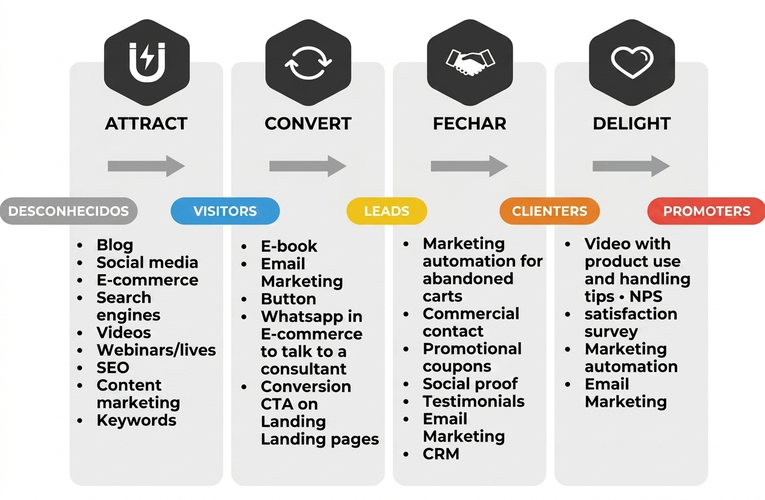
Source: Original research results.
The main paid marketing strategy was performance marketing, complemented by Search Engine Marketing (SEM), programmatic media, and Social Media Marketing (SMM). At the top and middle of the funnel, the focus was on awareness campaigns via programmatic media — with the purchase of specific audiences and the use of proprietary (“first-party”) audiences — in addition to SMM with paid campaigns and “lookalike” audiences of users who had already converted during the campaign.
At the bottom of the funnel, remarketing campaigns engaged and nurtured leads with higher conversion potential, while SEM campaigns prioritized the purchase of highly segmented “long-tail” keywords. According to Torres[13], dividing actions by funnel stages optimizes resources and maximizes ROI by effectively addressing customers at each stage. Figure 2 demonstrates how Company A used the marketing funnel methodology.
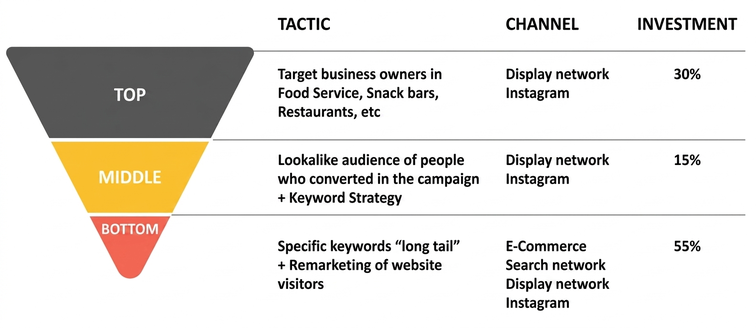
Source: Original survey results.
The analysis of organic marketing performance indicators revealed gradual growth, with high potential to generate qualified traffic, leads, and sales. In the attract stage, focusing on Search Engine Optimization (SEO), content marketing, and marketing automation, Company A expanded organic traffic, which represented 11% of the total and increased by 330% during the period. During the convert phase, lead generation was successful, with a 210% growth in organic leads and a 67% reduction in cost per lead, which demonstrates the effectiveness of content marketing and automated emails. In the close stage, sales increased consistently, with an average conversion rate of 31% and a 59% reduction in customer acquisition cost. Finally, in the delight stage, the company benefited from the automated sending of post-sale emails and satisfaction surveys[14].
Paid marketing strategies quickly boosted traffic and sales. At the top of the funnel, programmatic media and social media strategies attracted a significant volume of e-commerce visits, representing 89% of total sessions. In the middle of the funnel, SEM and programmatic media campaigns, combined with remarketing, generated leads and reduced CPL by 25% during the analyzed period.
In the final phase of the funnel, remarketing significantly impacted the conversion of leads into customers, and SEM, with the tactic of buying long-tail keywords, contributed to the reduction of customer acquisition cost. This pattern aligns with the literature, which indicates that paid media broaden reach and discovery at the top of the funnel, while organic marketing actions consolidate presence and traffic quality over time[11]..
Paid marketing provided scale and speed for immediate awareness and discovery, but indicated lower conversion (CVR ~5–7%). Organic marketing consolidated presence and search relevance, increased long-term traffic resilience, demanded lower investment, and presented superior conversion (CVR ~28–34%). The superiority of organic CVR reflects greater alignment with search intent and the advanced stage of the journey, which tends to elevate readiness for action[15].
Company A benefited from hiring specialized SEO and performance marketing agencies to conduct complex strategies, such as programmatic media, SEM, SEO, and blog content marketing, as such actions demanded resources and expertise not available in the internal team. Outsourcing complex capabilities is consistent with the principle of allocating specialized competencies to accelerate the learning curve and ROI[15].
The creation of a database with information about strategies allowed Company A to unify data dispersed across various platforms, which enabled more sophisticated analyses based on history and strengthened the integrated monitoring of digital marketing. According to Torres[13], this practice favors data-driven strategic decisions and strengthens the digital culture.
One of the main challenges was aligning the departments, especially finance, which faced difficulties with the payment gateway, installment sales, and credit approval. These obstacles were overcome through training promoted by IT in conjunction with suppliers and by cultural change efforts that encompassed marketing, sales, and other areas, which ensured the success of e-commerce. The alignment challenges between marketing, IT, and finance characterize digital transformation programs and require cross-functional governance and integration routines[7,6].
The deceleration of indicators in the last three quarters indicated that e-commerce has gone through the introduction and growth phases of the product life cycle and is approaching the maturity phase. This reinforces the relevance of the strategies that were essential to reach this level of stability and successfully lead e-commerce to the maturity stage[16].
The total marketing investment was R$ 122,015, of which 34% (R$ 41,200) corresponded to organic marketing and 66% (R$ 80,815) to paid marketing. The increase in investments followed the growth curve of traffic and sales and demonstrated that both were proportionally related.
In total, the company billed R$ 6,426,000 through e-commerce. Of this billing, net revenue was R$ 1,069,740, and the average ticket reached R$ 17,000.
The total ROI grew from 603% in Q3 to 1,103% in Q8. Thus, for all marketing investment made, the company obtained a return equivalent to 10 times the invested amount, a value considered optimal by the senior management of Company A, as it surpassed other sales channels of the BU. Sales between 2020 and 2021 totaled 378 units — 118 originated by organic marketing and 260 by paid marketing — with a total growth of 246%. E-commerce sales accounted for 32.6% of total sales across channels. For comparison, in the same period, sales via representatives grew by 40% and represented 30.5% of the total, while the internal sales channel grew by 325% and accounted for 37.0% of the total. According to senior management, these results were positive and notable, as, in two years, the e-commerce channel surpassed the representative channel in percentage growth.
The ROI reflects both the economy per unit (high average ticket and margin capture in the direct channel) and the operational gains (drop in CPL/CAC and increase in CVR) resulting from recurring optimizations[8].
The case study revealed that the adoption of digital marketing strategies allowed the company to generate traffic, increase lead capture, and improve sales performance, resulting in a high return on investment (ROI).
Organic marketing and paid marketing strategies played complementary and crucial roles in the success of the digital strategy. Organic was fundamental for building a qualified and sustainable long-term audience. Whereas paid—especially the performance marketing strategy—stood out for providing excellent results in terms of traffic generation and immediate sales.
During the implementation of the strategies, the company underwent a significant cultural transformation and adopted a data-driven approach in marketing decisions.
This process included the integration of analysis tools and the creation of a database, which allowed the team to make more informed decisions based on precise metrics. The cultural shift improved e-commerce efficiency, reduced costs, and increased conversion, in addition to fostering a mindset of continuous innovation, in which constant learning and adaptation to new trends became part of the marketing team’s routine.
Paid marketing provided scale and speed at the top of the funnel (≈89% of sessions), with lower CVR (5–7%) and progressive reduction of CPL/CAC. Organic consolidated traffic quality and resilience (representativeness ≈11%, CVR ≈28–34%, CPL –67%) and indicated better alignment with search intent and the advanced stage of the journey. Together, the efforts increased ROI from 603% (Q3) to 1,103% (Q8) and expanded e-commerce revenue to R$ 6.426 million in the period[15,8].
Finally, e-commerce has become an important low-cost sales channel for the BU. Digital marketing proved to be fundamental for the launch and introduction of e-commerce in the market, as it increased traffic and sales, which surpassed the results of other channels.
Table 2 summarizes the learnings obtained from each strategy and clearly shows how other industrial companies can apply this knowledge in their digital marketing strategies for e-commerce.
Table 2. Synthesis of results and learnings
| Inbound Marketing |
| • Can generate a lot of qualified traffic • Sustainable long-term results with low investment • Considerably complex implementation, as it requires a lot of alignment with internal stakeholders • The creation of a database for tracking metrics is essential |
| E-mail marketing and marketing automation |
| • Marketing automation allows for increased operational team efficiency • Low implementation complexity and low investment • Excellent channel for nurturing leads at all stages of Inbound marketing • Automatic audience segmentation • Effective as a remarketing tool |
| Content Marketing |
| • Requires in-depth study and research to ensure the relevance of the created content • Creating content is a complex task; experimenting with different formats is crucial to achieve assertiveness • Maintaining uniform and consistent communication across all channels is fundamental • It can generate a lot of qualified traffic |
| Search Engine Optimization (SEO) |
| • Allows organic positioning in search engine results • It is a complex strategy to execute • Can generate a lot of qualified traffic |
| Performance marketing |
| • Enables rapid growth of access and sales • It is a complex strategy to execute • The creation of the database for monitoring metrics is essential • It can generate a lot of traffic, however less qualified when compared to organic traffic • The return on efforts is realized more quickly compared to organic marketing |
| Search Engine Marketing |
| • Allows the brand to be immediately present in search engines • Using long-tail keywords is positive in saturated markets • Among paid marketing strategies, it stands out for having good conversion • It is a complex strategy to execute |
| Programmatic media |
| • High reach with precise segmentation • Offers constant optimization, leading to reduced waste of financial resources • High capacity to generate traffic • Great for remarketing • It is a complex strategy to execute • Using first-party data based on the best customer profile allows for higher conversions |
| Marketing for Social Media |
| • A channel that allows for high learning about the target audience • Powerful strategy to increase brand visibility and engage the audience • A/B tests and experiments are fundamental to achieving success • Low implementation complexity, but requires constant investment |
The research aimed to identify the digital marketing strategies implemented by an industrial company and measure their effects on direct-to-consumer e-commerce in terms of traffic generation and sales. The case study showed that the combination of organic and paid initiatives, guided by performance indicators, an analytical culture, and continuous improvement cycles, improved traffic quality, increased sales conversion, and boosted the digital channel’s financial return.
As a practical contribution, the work offers a set of actionable guidelines for teams with intermediate digital maturity and highlights the importance of data-driven governance and management. Among the limitations, the focus on a single case and the restricted time window are acknowledged. Future research can compare organizations with different levels of digital maturity, evaluate customer retention and lifetime value effects, and test new levers, such as digital influence, multi-touchpoint attribution, and the application of artificial intelligence in journey optimization.
REFERENCES
[1] Castells, M. 2009. A sociedade em rede: a era da informação, economia, sociedade e cultura. 9 ed. Rio de Janeiro, RJ: Paz e Terra.
[2] E-commerce Brasil. 2023. Tecnologia de marketing: empresas estão gastando cada vez mais e obtendo cada vez menos resultados. Mas há uma solução para isso. São Paulo, SP. Disponível em: https://www.ecommercebrasil.com.br/artigos/tecnologia-de-marketing-empresas-estao-gastando-cada-vez-mais-e-obtendo-cada-vez-menos-resultados-mas-ha-uma-solucao-para-isso. Acesso em: 29 ago. 2024.
[3] Híbrido. 2021. Desafio da indústria no e-commerce. 1 ed. São Paulo, SP. Disponível em: https://www.hibrido.com.br/wp-content/uploads/2020/08/RELATORIOD2C.pdf. Acesso em: 24 abr. 2024.
[4] Híbrido. 2023. Desafio da indústria no e-commerce. 3ed. São Paulo, SP. Disponível em: https://lps.hibrido.com.br/relatorio-industria-ecommerce. Acesso em: 24 abr. 2024.
[5] Ministério do Desenvolvimento, Indústria, Comércio e Serviços (MDIC). 2024. E-commerce no Brasil cresce 4% e alcança 196 bilhões em 2023. Brasília, DF. Disponível em: https://www.gov.br/mdic/pt-br/assuntos/noticias/2024/setembro/e-commerce-no-brasil-cresce-4-e-alcanca-r-196-bi-em-2023. Acesso em: 21 out. 2024.
[6] McKinsey Brasil. 2019. Transformações digitais no Brasil: insights sobre o nível de maturidade digital das empresas no país. São Paulo, SP. Disponível em: https://www.mckinsey.com/br/~/media/mckinsey/locations/south%20america/brazil/our%20insights/transformacoes%20digitais%20no%20brasil/transformacao-digital-no-brasil.pdf. Acesso em: 10 jan. 2024.
[7] Confederação Nacional da Indústria (CNI). 2023. Mapa estratégico da indústria 2023–2032: o caminho para a nova indústria. Brasília, DF. Disponível em: https://www.mapadaindustria.cni.com.br/download. Acesso em: 24 ago. 2024.
[8] Kotler, P.; Carboni, G. 2023. A new path to digital marketing. 1 ed. Milão, Itália: Versace Publishing.
[9] Yin, R.K. 2004. Estudo de caso: planejamento e métodos. 2ed. Porto Alegre, RS: Bookman. Disponível em: http://maratavarespsictics.pbworks.com/w/file/fetch/74304716/3-YIN-planejamento_metodologia.pdf. Acesso em: 14 abr. 2024.
[10] Barros, A.J.S.; Lehfeld, N.A.S. 1986. Projeto de pesquisa: propostas metodológicas. 4ed. Petrópolis, RJ: Vozes.
[11] Gabriel, M. 2010. Marketing na era digital: conceitos, plataformas e estratégias. 1ed. São Paulo, SP: Novatec Editora.
[13] Torres, C. 2009. A bíblia do marketing digital: tudo o que você precisa saber sobre marketing digital e negócios na internet. 1ed. São Paulo, SP: Novatec.
[14] Halligan, B.; Shah, D. 2010. Inbound marketing: seja encontrado usando o Google, a mídia social e os blogs. 1ed. Rio de Janeiro, RJ: Alta Books.
[15] Turchi, S. 2018. Estratégias de marketing digital e e-commerce. 2ed. São Paulo, SP: Atlas.
[16] Las Casas, A.L. 2016. Marketing digital: conceitos, aplicações e estratégias. 1ed. São Paulo, SP: Atlas.
COMO CITAR
Leite, J.A.; Crispim, R.T. E&S 2025, 6: e2025026. Estratégias de marketing digital para e-commerce: estudo de caso em uma empresa industrial. Revista E&S. 2025; 6: e2025026.
ABOUT THE AUTHORS
 Jefferson Andrade Leite – Digital Business Specialist. Rua Eugênio Iori, 293, Centro, 12120-107, Tremembé, São Paulo, Brazil.
Rafael Toassi Crispim – Doctoral student and researcher. Avenida Prof. Luciano Gualberto, 908, Butantã, 05508-010, São Paulo, SP, Brazil.