
Customer Expectation
Agricultural Machinery
Customer Needs
Service Provision
Quality
August 02, 2021
How to incorporate customer expectations into the services of an agricultural machinery dealership
DOI: 10.22167/2675-6528-20210018
E&S 2021, 2: e.20210018
Nelson Cerino Franco Junior; Leandro Maria Gimenez; Thiago Libório Romanelli; Marcos Milan
The purchase of agricultural equipment, whether it is a tractor or an implement, is a decision that depends on several factors, from brand preference to expected performance. The important thing is that the customer feels they have acquired equipment that met and exceeded their needs and expectations. In the case of agricultural machinery, the purchase is normally made at dealerships. These, in addition to sales, provide services such as inspection and maintenance, sale of parts and used equipment, among others. They also sponsor or participate in field demonstrations for product promotion, make available articles associated with the brand or the dealership itself, and can be considered the manufacturer’s front line. They are where the actions happen and are a source of knowledge about the market, current and potential customers.
Identifying and understanding market needs are fundamental points to ensure the survival and growth of the business not only of the dealership but also of the manufacturer. For Noriaki Kano, customer needs are associated with three quality requirements: mandatory (expected or basic quality); linear (linear quality); and attractive (attractive quality) (Figure 1).
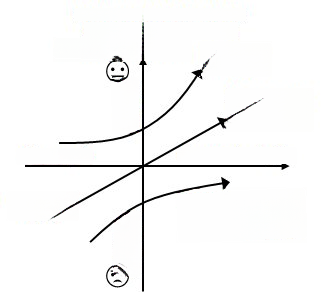
Figure 1. Quality requirements associated with customer needs
Mandatory requirements must be present in the product or service, and in this case, the customer’s perception is neutral. However, if the requirements are absent, the customer notices immediately and can become very dissatisfied. The appropriate behavior of the dealership salesperson is expected, and if it doesn’t happen, the customer’s mood will change. Linear requirements are associated with performance, and the better the salesperson’s service, the greater the satisfaction. Attractive requirements, on the other hand, are those that surprise because the customer does not expect to find them, for example, a loyalty program with discounts on products and services. Depending on the situation and over time, attractive quality items can become mandatory. It is always necessary to develop attractive features to win preference. In the surveys conducted, customers generally only remember requirements associated with linear quality, product or service performance. Those associated with mandatory quality are assumed to be there, and regarding attractive quality, they are unaware of the possibility of its existence.
Understanding the needs requires incorporating them into the product or service. This was the challenge Yoji Akao faced when, in the 1970s, he realized that it was necessary to incorporate customer needs into the product from the design phase. A series of ideas and concepts developed in the environment of Total Quality Management (Company Wide Quality Control – CWQC) at the time gave rise to the Quality Function Deployment (QFD) tool. QFD assists in transforming what the customer desires, but cannot adequately express, into engineering language, presented as technical characteristics. These characteristics are deployed throughout the entire process using matrices, from design to product or service acquisition, incorporating customer needs in the different phases. The first matrix, called the house of quality, due to its roof-like shape at the top, is used to translate customer needs into technical characteristics (Figure 2).
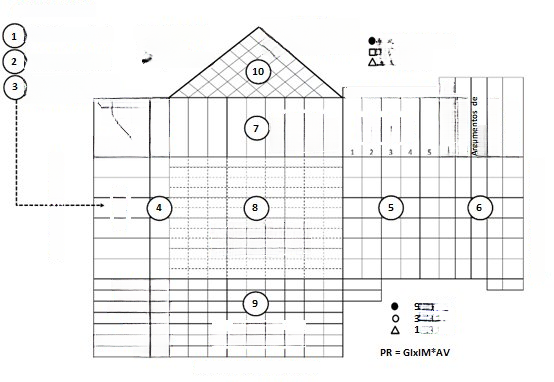
Figure 2. Quality House
For the construction of the house, the first activity is the choice of the team that will develop it. The team must be composed of experienced people, covering diverse areas, from marketing to production. In certain cases, it is necessary to have an external element to the company, a facilitator, to guide the application of the tool. Forming a multidisciplinary team is a way to “break down barriers” that exist between departments and unite knowledge from various areas. After the team is defined, it is time to choose the product or service (1), and the recommendation is to start with something simple, but that represents a challenge. After the choice, it is necessary to define the target market for the product or service (2), and establish the items related to customer needs called “WHAT’s?”, required quality (3). Here, it is good to remember that the customer does not express themselves in technical terms and that the items must cover the requirements proposed in the Kano model to meet the mandatory, linear, and attractive quality.
The degree of importance (4) is obtained through a customer survey in which they define which items of required quality are most important to be met, which is done by assigning points. Next, in the same survey, they provide opinions on the positioning of the company’s product/service in relation to competitors, the so-called competitive “benchmarking” (5). By analyzing the degree of importance and the positioning of the required quality items against the competition, the team now works to establish what should be improved and by how much (Improvement Plan) (Figure 2). The improvement index is obtained by dividing the value of the item’s improvement plan by the company’s current assessment, which is obtained in the “benchmarking”. The sales argument is a weight assigned to express the benefits of each required quality item, according to the team’s opinion. Those considered attractive quality are candidates for receiving a higher score. The multiplication of the degree of importance, the improvement index, and the sales argument defines the absolute and relative (%) weight for the “WHAT´s”, thus defining the order of importance of each planned quality item (6).
Now it is time for the team to work on the “HOW´s” (7), the technical, measurable characteristics that will meet the “WHAT´s”. If one of the quality requirements for a tractor is that it must be comfortable, one of the many technical characteristics that make the tractor convey a sense of comfort to the customer is the noise level, measured in decibels (dB).
Once the technical characteristics are defined, the team’s next step is to establish the correlation, if it exists, between each “WHAT” item and each “HOW” item. Values are assigned to identify whether the correlation is strong, medium, weak, or nonexistent. These values are multiplied by the relative weight obtained in the planned quality and, with this, this number or indicator incorporates, in addition to the importance, the “benchmarking” and the benefits, the potential that each “HOW” item has to meet each “WHAT” item (8).
The sum of the values for each column that represents a “HOW” establishes the priority, through the absolute and relative (%) weights that each “HOW” has to meet the “WHAT´S.” Thus, the technical characteristics that meet the customers’ needs are prioritized. The new specifications for the product or service, designed quality, are established based on the importance and comparison of the company’s current technical characteristics of the product/service with those of the competition, technical “benchmarking”* (9).
In the “roof of the house” the analysis involves the technical characteristics, “HOWs”, (10) and the team must verify if there are correlations between them and, if they exist, establish how they are affected, positively or negatively. With this, it is possible to evaluate if, by altering the value of a HOW, it will not bring reflections, positive or negative, in other characteristics. The house of quality allows a complete evaluation of the product or service and to establish the values to be assumed in the project.
One of the first records of QFD’s use was in Japan in 1979 for the project of a pickup truck door. In 1983, the tool arrived in the United States and Europe, and by 1984, its application in the automotive industry in these locations was already known. In 1989, it was introduced in Brazil during the international quality control congress. Applications occur in various sectors such as automotive, steel, food, education, IT, medicine, civil construction, among many others. In the education sector, for example, QFD was used to analyze an MBA program, and in the food sector to define the characteristics of a pasta to meet consumers seeking healthy food alternatives.
In the agriculture segment, as application examples, work focused on the development of implements, tomato varieties, coffee seedlings, charcoal for barbecue, and soil preparation can be cited. One of the applications in this segment, in the services area, involved a tractor dealership. For this purpose, a team was formed at the dealership consisting of six people, involving the commercial, services, customer support, and intelligence areas, and an external member, a facilitator. The purpose of the work was to define the most important technical characteristics for the services area. The dealership’s area of operation was considered the target market. With the team, service, and client defined, the next step was to develop the items of the required quality.
A total of thirty-four items were developed, of which 47.1% were related to the commercial area, 26.5% to services, 17.6% to administration, and 8.8% to parts. After surveying customers, the five main items for the degree of importance were: “good service quality”; “good price for parts”; “good parts availability”; “speed of service”; “good labor price”. In the competitive evaluation (“competitive benchmarking”) carried out between the dealership and three competitors representing different manufacturers, the quality items required that stood out the most were: “marketing of products with technology adequate to the producer’s profile”; “marketing of quality products”; “good relationship with the salesperson”; “team’s knowledge about the product”; “good dealership location/access”. Two items classified among the top five in degree of importance received the lowest scores in relation to the competition: “good labor price” and “good parts availability”. A suggestion for this case is that actions be evaluated and implemented to improve these two items.
Regarding the planned quality, the “WHAT’S” items classified as most important were in order: “technical follow-up and guidance of the product”; “good relationship with the seller”; “commercialization of quality product”; “fair price for purchasing a new tractor”; and “good price for parts”. It is important to highlight that planned quality incorporates customer opinions, degree of importance and improvement index, and the team’s perception of benefits, sales argument. The improvement index is formed by the improvement plan and the value obtained in the competitive evaluation.
For the item “product technical support and guidance”, the team understood that it needed to be improved to face the competition and, as it is associated with the company’s marketing and customer loyalty, it stands out as an excellent sales argument. The decision was to apply a high value to the improvement plan and the sales argument, and for this reason, the item ranked first in planned quality, although it was not among the top five in terms of importance.
Based on the required quality, the team defined fifty-two technical characteristics, “HOW´s” to meet the required quality “WHAT´s”. Of the 1768 possibilities, 539 (30.5%) showed correlations and were scored. By multiplying the correlation values by those obtained in the planned quality and subsequently summing these results for each “HOW” item (columns), the most important technical characteristics were identified: “customer loyalty percentage”; “average training time for salespeople and mechanics”; “punctuality in the delivery of the purchased tractor”; “density of trained mechanics”; “number of complaints regarding service”. The “customer loyalty percentage” showed correlation with 32 of the 34 required quality items, “WHAT´s”, which indicates its importance for meeting customer needs.
In the “HOW versus HOW” evaluation, the “customer loyalty percentage” obtained 24 positive correlations, indicating that if this characteristic improves, it will positively affect 24 others. “The number of seller complaints” negatively affects 12. The team must evaluate the implications when modifying the technical characteristics, HOWs. The completion of the work enabled, among other results: a better understanding of the dealership’s customer needs; identification of the importance of sales professional training for the business; the need to monitor competitor performance and review pricing policies.
The use of the QFD tool allows for the development of a product or service that meets customer desires, increasing integration between company departments and reducing the timelines and costs of a new or improvement project. In addition to the customer’s opinion on the items that make up the product or service, it aids in structuring the knowledge of the team members and allows for an assessment of the competition. The risks of failure in its application are mainly associated with an inexperienced team and the rush to finish the work.
References
Akao, Y. 1997. QFD: Past, Present, and Future. International Symposium on QFD. Linköping. Suécia.
Cheng, L. C.; Scapin, C. A.; Oliveira, C. A. de; Krafetuski, E.; Drumond, F. B.; Boan, F. S.; Prates, L. R.; Vilela, R. M. 1995. QFD: Planejamento da Qualidade. Fundação Christiano Ottoni. Belo Horizonte, MG, Brasil.
Franco Junior, N.C. 2017. Atributos básicos relacionados aos produtos e serviços de uma concessionária de máquinas agrícolas para atender as necessidades dos clientes. Tese. Universidade de São Paulo – Escola Superior de Agricultura “Luiz de Queiroz”. Piracicaba, SP, Brasil
Govers, C.P.M. 1996. What and how about quality function deployment (QFD); Int. J. Production Economics, 46-47: 575-585.
Peccinelli, M.C. 2019. Características de um produto saudável e prático para atender as novas tendências de alimentação de consumidores que buscam melhor qualidade de vida. Dissertação. Universidade de São Paulo – Escola Superior de Agricultura “Luiz de Queiroz”. Piracicaba, SP, Brasil.
Pitman, G.; Kumar, J.M.A.; Cheng, C.H. 1995. QFD application in an educational setting: a pilot field study. International Journal of Quality & Reliability Management, 12(6): 63-72.
Como citar
Franco Junior, N.C; Gimenez, L.M.; Romanelli, T.L.; Milan, M. Como incorporar as expectativas dos clientes aos serviços de uma concessionária de máquinas agrícolas. Estratégias e Soluções, 2: e.20210018.
Sobre os autores
Nelson Cerino Franco Junior, Doutor em Engenharia de Sistemas Agrícolas pela Escola Superior de Agricultura “Luiz de Queiroz” – Universidade de São Paulo (USP), Piracicaba, SP
Leandro Maria Gimenez, professor do Departamento de Engenharia de Biossistemas da Escola Superior de Agricultura “Luiz de Queiroz” – Universidade de São Paulo (USP), Piracicaba, SP
Thiago Libório Romanelli, professor do Departamento de Engenharia de Biossistemas da Escola Superior de Agricultura “Luiz de Queiroz” – Universidade de São Paulo (USP), Piracicaba, SP
Marcos Milan, professor do Departamento de Engenharia de Biossistemas da Escola Superior de Agricultura “Luiz de Queiroz” (ESALQ) – Universidade de São Paulo (USP), Piracicaba, SP
Editorado por: Edson Pereira da Mota
Link para download: https://cms.revistaes.com.br/wp-content/uploads/2021/08/18.pdf