
Bot
Project Management
Financial Institution
Hybrid Methods
June 17, 2021
Project management using hybrid methods in information technology of a Financial Institution
DOI: 10.22167/2675-6528-20210005
E&S 2021.2: e.20210005
Fernando Rocha Moreira e Gressa Amanda Chinelato
With the advancement of technology and competitiveness in the financial sector, financial institutions are increasingly seeking space through the internet, providing better products and more robust mobile applications, making competition increasingly fierce (Moreira et. al, 2020).
With this competition, data and information losses can cause these institutions to stop profiting or incur incalculable losses. Today, it is extremely necessary to take care of the backup processes of financial organizations, which has ceased to be carried out through physical media, such as tape backups (Fonseca et al., 2010).
Given this scenario, the objective was to develop bots to initiate the automatic data backup process of a system that performs the monthly accounting closing of a financial institution. The case study was carried out in a large financial institution with over 90,000 employees, present in Brazil and abroad.
To create this hybrid project management methodology, it was necessary to:
- create a visual model through a Project Model Canvas-[PMC] (Finocchio Junior, 2013);
- adopt concepts of Agile Methodologies such as Scrum (Beck et al, 2001; Sutherland et al, 2009; Vallerão, 2013);
- develop the Kanban Board and Burndown Chart for project monitoring (Arafeen and Saugata, 2009);
- adopt concepts contained in the PMBOK such as Gantt Chart, Risk Analysis, Program Evaluation and Review Technique – (PERT), Critical Path Method – (CPM) and Probabilistic (Novais et al, 2011; PMI, 2017).
The Canvas fields were filled through a brainstorm with the specialists, working on the fields: justification, objective, timeline, benefits, products, requirements, stakeholders, teams, and constraints (Table 1).
Table 1. Canvas for the development of a solution for the backup process in a financial institution
| Justification | Need for backup process automation |
| Objective | Financial risk mitigation, data loss, human error |
| Schedule | Period less than 40 hours |
| Benefits | Process automation and risk mitigation in general and time saving |
| Product | Creation of the bot for performing automatic backups |
| Requirements | Definition of technical details for bot creation |
| Interested parties | Survey of all project stakeholders, from the team, agency employees, suppliers, and clients |
| Teams | Listing of all analysts with their assignments |
| Restrictions | Do not make changes in the production environment directly and without testing |
| Premises | Bot only performs the backup and does not proceed with the monthly closing without authorization from an analyst |
The project was initiated on the last business day of November 2019. To define the Delivery Groups field, a survey of the activities that should be carried out was performed. For this, a Project Breakdown Structure (PBS) (Figure 1) was built, the delivery priority order was defined (Table 1), and a network diagram to illustrate this preference order of deliveries (Figure 2).
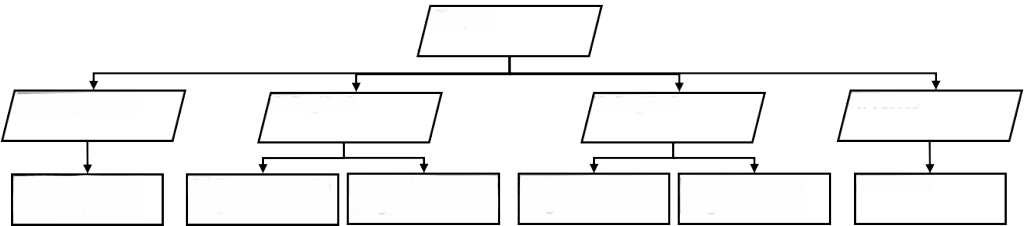
Figure 1. Work Breakdown Structure (WBS)
Table 1. Activities defined in the project according to the raised priorities
| Activity | Predecessor |
| 1. Planning with the team | |
| 2. Region 1 Documentation | 1 |
| 3. Implementation of Region 1 | 2 |
| 4. Region 2 Documentation | 3 |
| 5. Region 2 Deployment | 4 |
| 6. Test | 5 |

Figure 2. Network diagram
For the Timeline field, the estimate was calculated using PERT/CPM techniques (Table 2) and then the Gantt Chart was established with the analysts allocated to their respective activities (Figure 3). A Burndown chart was also developed (Figure 4), where the black line shows the project execution estimate, and a Kanban board was built with activities divided into sticky notes, containing the fields: To Do, Doing, Done, and Blocked.
Table 2. Program Evaluation and Review Technique (PERT) Calculation with project completion estimate and Variance
| Activity | PERT | Variance |
| ———hours——— | ||
| Planning with the team | 5,6 | 0,1 |
| Region 1 Documentation | 4,0 | 0,1 |
| Region 2 Deployment | 3,8 | 0,2 |
| Region 2 Documentation | 10,6 | 1,0 |
| Region 2 Deployment | 10 | 1,2 |
| Test | 3,5 | 0,0 |
| Sum | 37,4 | 2,7 |
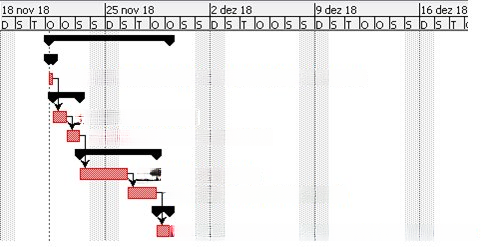
Figure 3. Gantt Chart
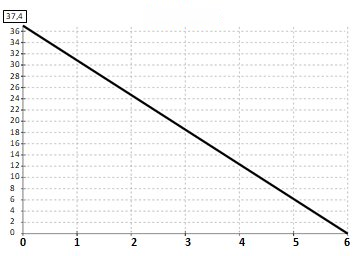
Figure 4. Burndown Chart
To fill in the Costs field: a value of R$ 7,185.82 was entered, calculated according to the Analysts’ value/hour (Table 3) and by the total value obtained per activity according to how the analysts were allocated per activity (Table 4).
Table 3. Analysts with their respective hourly work values
| Analyst | Hourly rate |
| BRL hour-1 | |
| Analyst 1 | 54,00 |
| Analyst 2 | 54,00 |
| Analyst 3 | 74,00 |
| Analyst 4 | 54,00 |
| Analyst 5 | 74,00 |
_
Table 4. Value of each activity and the total project execution
| Activity | Value |
| BRL | |
| Planning with the team | 1.729,80 |
| Region 1 Documentation | 506,88 |
| Region 2 Deployment | 687,96 |
| Region 2 Documentation | 1359,36 |
| Region 2 Deployment | 1823,64 |
| Test | 1078,18 |
| Sum | 7.185,82 |
To fill in the Risk Group field, the probability of project success was calculated, finding Z=1.6, a value equivalent to a 94% chance of the project being completed on time using the normal distribution table. The peak of the graph was 37.4 hours, which refers to the estimated deadline for project completion (Figure 5). Quantitative Risk Analysis was also performed using PERT to estimate the Probability of any risk occurring and, consequently, the Expected Value calculation (Table 5).
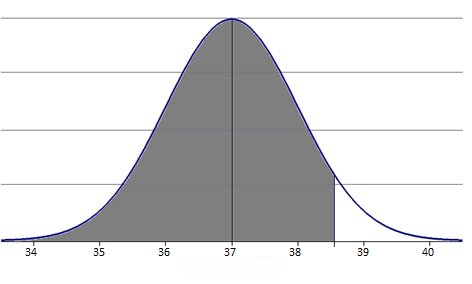
Figure 5. Area of the probability of the project being executed in 40 hours
Table 5 Quantitative analysis of data risks considering Category
| ID | Risk | Probability (P) | Impact (I) | Expected Value P x I | Delay |
| % | ——————-BRL——————- | hours | |||
| 1 | Documentation failure – Region 1 | 36,7 | 506,88 | 185,86 | 1,46 |
| 2 | Bot assembly failed – Region 1 | 10,8 | 687,96 | 74,82 | 0,41 |
| 3 | Documentation failure – Region 2 | 36,7 | 1359,64 | 498,43 | 3,88 |
| 4 | Bot assembly failed – Region 2 | 10,8 | 1823,64 | 197,56 | 1,08 |
| Sum | 956,97 | 6,84 | |||
After all the survey conducted and activities completed, the project started on November 21, 2018, and was concluded midday on November 28, 2018, with production successfully initiated on the last business day of November 2018. The project’s objective was achieved, meeting the requirement of a period less than 40 hours (Table 6) (Figure 6).
Table 6. Comparison of what was estimated with what was performed in time
| Activity | PERT(Estimated) | Completed | Estimated value | Amount spent |
| ———— hours ———– | ————- BRL ———— | |||
| Planning with the team | 5.6 | 6,0 | 1.729,80 | 1.858,89 |
| Region 1 Documentation | 4,0 | 2,0 | 506,88 | 254,50 |
| Region 2 Deployment | 3,8 | 1,6 | 687,96 | 293,53 |
| Region 2 Documentation | 10,6 | 10,0 | 1.359,36 | 1.279,73 |
| Region 2 Deployment | 10 | 11,29 | 1.823,64 | 2.058,89 |
| Test | 3,5 | 3,5 | 1.078,18 | 1.078,18 |
| Sum | 37,4 | 34,39 | 7.185,82 | 6.823,72 |
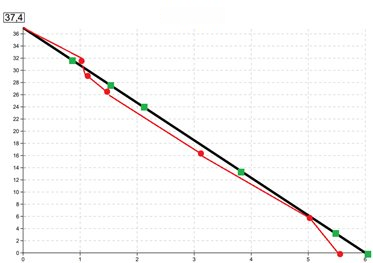
Figure 7. Burndown after project execution
*the black line shows the estimate and the red line the project execution time
When considering works such as Melo and Ferreira (2010) that applied the Extreme Programming [XP] methodology, a gain in speed was observed, but difficulty in effecting an organizational culture change, which did not happen in this work due to the use of hybrid methods.
The work of Andrade and Taiti (2012), focused on software creation using PMBOK techniques, brought benefits such as human resources, costs, and risk management; however, the absence of an agile methodology compromised deliveries due to a strong focus on documentation.
The use of hybrid methods corresponded to expectations, bringing results close to the estimated ones, which did not compromise the project execution. The estimates and results obtained through techniques proved efficient in neither overestimating nor underestimating the risks and duration of the project, thus this entire set contributed to the project’s success.
References
Andrade, S.; Tait, T.F. 2012. Uma aplicação do guia PMBOK na gestão de projetos de software. Revista Brasileira de Computação Aplicada, 4(1): 2-11.
Arafeen, M. J.; Saugata, B. 2009. Improving Software Development Using Scrum Model by Analyzing Up and Down Movements on The Sprint Burn Down Chart – Proposition for Better Alternatives. J. Digit. Content Technol. its Appl., 3: 109-115.
Beck, K.; Beedle, M.; van Bennekum, A.; Cockburn, A.; Cunningham, W.; Fowler, M.; Grenning, J.; Highsmith, J.; Hunt, A.; Jeffries, R.; Kern, J.; Marick, B.; Martin, R.C., Mellor, S.; Schwaber, K.; Sutherland, J.; Thomas, D. 2001. Manifesto for Agile Software Development Manifesto for Agile Software Development. Disponível em: <https://agilemanifesto.org/iso/ptbr/manifesto.html> Acesso em: 10 jun. 2018.
Finocchio Júnior, J. 2013. Project Model Canvas: gerenciamento de projetos sem burocracia. Elsevier/Campus. Rio de Janeiro, RJ, Brasil.
Fonseca, C.E.C.; Meirelles, F.S.; Diniz, E.H. 2010. Tecnologia bancária no Brasil. FGV, RAE, São Paulo, SP, Brasil.
Melo, C.; O.; Ferreira G.R.M. 2010. Adoção de métodos ágeis em uma Instituição Pública de grande porte – um estudo de caso. In: Proceedings of the Brazilian Workshop for Agile Methods (WBMA 2010) in the Brazilian Conference on Agile Methods (Agile Brazil 2010): 112-125. Disponível em: <http://www.agilcoop.org.br/files/WBMA_Melo_e_Ferreira.pdf> Acesso em: 08 maio 2018.
Moreira, R.F.; Nunes, R.R.; Giozza, W.F.; Nze, G.A. 2020. Optimization of the performance of an online payment application by the improvement of its infrastructure. In: 2020 15th Iberian Conference on Information Systems and Technologies (CISTI). IEEE, Sevilha, Espanha.
Novais, I.F.; Jorge, E.M.F.; Junior, C.P.C.; Souza, D.T. 2011. Gerenciamento de Projeto Otimista (GPO): Um Método que integra PERT/CPM à CCPM. Revista de Gestão eProjetos, 2(2): 150-165.
Project Management Institute [PMI]. 2017. A guide to the project management body of knowledge (PMBOK). 6 ed. Project Managemente Institute. Newtown Square, PA, EUA.
Sutherland A.C.; Sutherland J.; Hegarty C. 2009. Scrum in Church: Saving the World One Team at a Time. In: 2009 Agile Conference, Chicago, p. 329-332. IL, USA,
Vallerão, A.G.; Roses, L.K. 2013. Monitoramento e controle de projetos de desenvolvimento de Software com o Scrum: avaliação da Produção Científica. Revista de Gestão e Projetos – GeP, 4(2): 100.
Como citar
Moreira, F.R.; Chinelato, G.A. Gerenciamento de projetos usando métodos híbridos na tecnologia da informação de uma Instituição Financeira. Estratégias e Soluções, 2: e.20210005.
Sobre os autores
Fernando Rocha Moreira – Graduado em Sistemas de Informação (UFV) e Especialista em Gestão de Projetos (USP).
Gressa Amanda Chinelato – Mestre em Fitopatologia (USP) e Especialista em Agronegócios (USP).
Editorado por: Edson Pereira da Mota
Link para download: https://cms.revistaes.com.br/wp-content/uploads/2021/08/11.pdf