
Analyst
Scientist
Data
Engineer
Skills
Labor Market
Professionals
Vacancies
January 22, 2025
The most in-demand data analysis skills in the job market
DOI: 10.22167/2675-6528-20240033
E&S 2025, 6: e20240033
Déborah Lima Scalioni e Renato Máximo Sátiro
Due to digital transformation, boosted by the advent of the pandemic, companies generate enormous amounts of data every day. In this context, competitiveness among companies has increased in the search for data analysis professionals who possess the necessary skills in the area. Data engineer and data scientist jobs are among the most sought-after occupations in 2020, with annual growth rates of 78% and 75%, respectively[1]. These professionals are responsible for building the entire data infrastructure and implementing methods to capture, process, and perform preventive and predictive analyses within the organization. Correct manipulation of large volumes of data can generate powerful insights for the company, guiding it towards better decision-making[1].
However, this substantial growth of the area, associated with its multidisciplinarity, generated confusion regarding what the expected skills of these professionals are, and regarding basic definitions of tools, methods, and functions. Such misunderstandings end up generating high costs for employers and professionals, who need to deal with the lack of clarity in job descriptions during selection processes[2].
In this sense, it is observed that employers seek professionals who combine practical and cognitive skills in data analysis, computing, and business, with social competencies and specific personality traits. The demand for these skills varies according to the job level and the responsibilities involved. However, many executives recognize that candidates rarely possess all the desired competencies, which forces them to invest in additional training to adequately prepare these professionals for the roles[3]. In other words, it is observed that organizations’ search for professionals with technical and behavioral skills is driven by their fundamental role in the digital transformation process, as they provide information that supports quick and assertive decision-making, ensuring that companies remain competitive in the market.
When addressing this topic, Dubey and Gunasekaran[4] listed some examples of what these competencies are. The so-called hard skills are the technical skills that can be learned, such as statistics, forecasting, optimization, finance, financial accounting, marketing; while soft skills are skills that are more linked to personality, such as leadership, teamwork, listening, learning, positive attitude, communication, interpersonal relationships, patience, and passion.
In the areas of analysis and data science, there is a plurality of career possibilities and positions for these professionals, such as: Data Analyst, Data Engineer, Data Scientist, Data Architect, Big Data Engineer, Machine Learning Specialist, etc. There are several possible paths and various skills, which may or may not coincide. For the context of this work, it was necessary to narrow down this broad universe, and for this, frameworks were used as a reference, which listed and categorized the knowledge in data used to elaborate the list from which analyses were developed here[1],[5].
Another point also taken into consideration was that the digital age and social distancing, caused by COVID-19, expanded the use of online tools in recruitment and selection processes, as this modality became the main means of attracting candidates for most companies. Among the main drivers of this adoption are: ease for candidates, process speed, scalability, and reach. Furthermore, being able to react more quickly to competitors, attracting candidates ahead of the competition, can be another competitive advantage for organizations[6].
Due to the relevance of digital tools in the job market, this work aimed to analyze the described process and provide concrete information to professionals and companies about the most relevant skills for job openings in the data market, with a greater focus on the roles of data analyst (data analyst), data engineer (data engineer), and data scientist (data scientist), which are currently the most sought-after positions by Brazilian companies. Due to its widespread use and reference position as a professional network, LinkedIn was chosen as the data source for the development of this analysis.
The methodology used was divided into four stages. In the first moment, data was extracted through the web scraping process. Next, a descriptive analysis of the collected data was performed; in this stage, the main skills sought in the area were selected and categorized, with the aim of verifying the characteristics of the published vacancies. In the third moment, the association between the skills in question was measured. Finally, text mining techniques were used to understand the context and extract significant information from the textual fields, determining the most used words and phrases.
Tabela 1. Síntese dos métodos utilizados no trabalho
| Method | Description |
| Web data extraction | Automated extraction of data from websites to collect information about published job openings, including textual fields and other information. |
| Descriptive analysis | Selection and categorization of the main skills sought in job openings, verifying relevant characteristics and patterns in the collected data. |
| Measure of association | Evaluation of the relationships between the identified skills, in order to understand how they are connected or frequently associated. |
| Textual data mining | Analysis of textual fields to identify the most used words and phrases, understanding the context and extracting significant information. |
Web data extraction
Web scraping is a technique used to extract data from the internet and store it for later use or analysis[7]. It has been widely used for collecting large volumes of data, especially due to the large amount of data generated online daily. In this work, it was chosen to use it because it is a technique of easy customization and automation, and to implement it, the Selenium library and the Python language were used.
The research conducted on the job postings section of the LinkedIn platform was done in six distinct searches, using the keywords “analista de dados”, “data analyst”, “engenheiro de dados”, “data engineer”, “cientista de dados” and “data scientist”, and defining the location filter as Brazil. The intention of using these criteria was to cover the maximum number of job postings in the data area, even those published in another language, which are quite common in some multinational companies.
The platform’s job posting page displays more results as the user scrolls down the browser; however, after six repetitions of this process, the loading stops being automatic, and to access more results, the user needs to click the ‘view more jobs’ button. Based on this dynamic and in order to optimize the data collection process, a loop was created that simulated the user’s interaction with the platform, considering the total number of jobs and the quantity of new jobs shown per click. After collecting all available jobs, a second loop was generated using the tag from the side list (‘li’) to capture the most relevant information for each job — such as title, link, company, location, and date. For the remaining information, such as job description, experience level, job type, role, and industry, it was necessary to click on the title of each job to obtain the details in a tab on the right side of the screen (Figure 1).
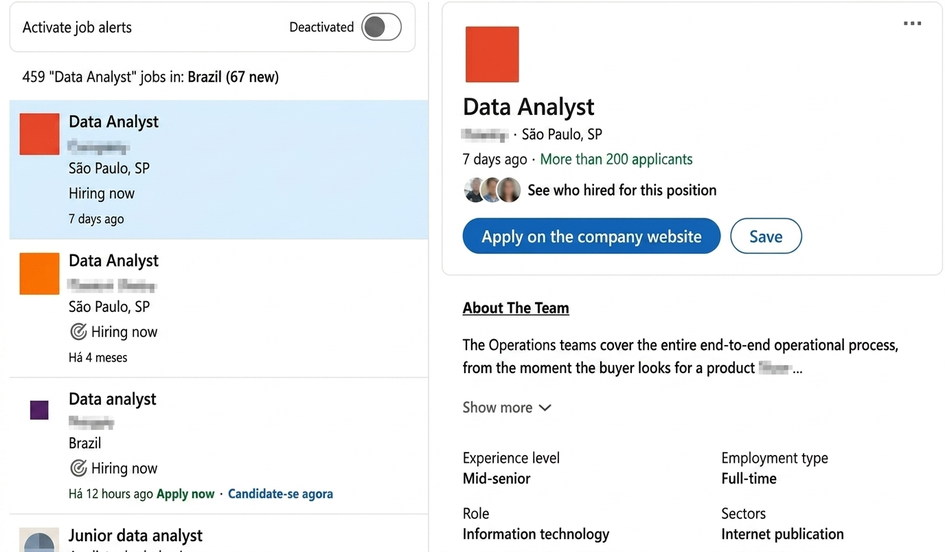
Source: LinkedIn
After collection, the data were structured into dataframes, combined into a single set, and submitted to the cleaning and duplicate removal process. At the end of this process, a dataset composed of 2498 unique publications was obtained.
Data analysis
Descriptive analysis is a technique used to synthesize and group data or perform comparisons between data groups[8]. Given the qualitative nature of the data collected on LinkedIn, this technique was used because it is the most suitable for understanding the characteristics in the distributions, allowing the identification of numerical groupings such as percentages, indices, and averages.
The data analysis covered the exploration of several variables, such as location, type, seniority level, sector, company, and contract type. Furthermore, as the objective was also to identify the particularities of each role within the data area, a classification named “position” was created. In order to identify the particularities of each one, as well as of the area as a whole, several comparative analyses were performed between the positions, both separately and jointly.
As descriptive tools for data representation, graphs and tables were used, presenting the information clearly and in an easily interpretable way.
Association between skills
Initially, it was necessary to delimit the scope of the research. For this purpose, and based on the references consulted, the main technical and behavioral competencies required for data professionals were selected. In order to facilitate the analysis, these skills were grouped and categorized as follows:
- Database: ETL, ELT, SQL, SQL Server, Oracle, Postgres, MySQL, NoSQL, Cassandra, MongoDB, Data Warehouse.
- Dashboard and Reports: Power BI, Tableau, Qlik, Business Objects, Excel, D3, Matplotlib, plotly.
- big data : Hadoop, Spark, Hive, Pig, HBase.
- Programming: Python, Scala, C/C++, C#, Java, .NET, HTML, PHP, Javascript.
- Statistics: R, SAS, SPSS, Stata, MATLAB, Regression, Probability.
- Cloud: Cloud, AWS, Azure, GCP.
- Behavioral: Leadership, communication, relationship, presentation, organization.
To measure the association between the selected skills, an algorithm was used to identify the presence of each term in the description field of the published vacancies. In some cases, different versions of each term were considered (e.g.: Power BI, PowerBI, and PBI; Data Warehouse and DW), as well as translations for vacancies published in English (e.g.: comunicação and communication). The dataframe returned by the algorithm was composed of binary columns and analyzed using the “Phi Coefficient” — also known as the “Matthews Correlation Coefficient” (MCC) —, a technique widely used in different areas for measuring the association between binary variables[9].
Textual data mining
Text mining is the process of extracting relevant information from unstructured data sources, such as texts, to identify keywords and patterns. This technique transforms texts into numerical variables, allowing their analysis with statistical methods. In the present case, n-gram analysis, which detects recurring word sequences in a text, was used to explore the “title” and “description” textual fields in more detail[9].
Based on the categorization of skills and the application of the aforementioned techniques, the main characteristics of job openings in the data market were presented, with a primary focus on verifying which were the most requested skills and if there were differences between the competencies sought in different roles of data analysts, engineers, and scientists. Furthermore, through text analysis techniques, the analysis allowed for the identification of relationships between different skills and the most frequent word combinations. The results obtained can assist students and professionals in guiding their educational decisions and providing a basis for a more assertive job search.
Descriptive analysis
Through the descriptive analysis of the data, we sought to understand and synthesize its main characteristics. The analysis of the job titles presented a great plurality of terms. For the creation of the position field, some data treatments were necessary, such as: removal of special characters, conversion to uppercase and to Portuguese, in addition to standardization of seniority level terms. Thus, it was found that 34.2% of the opportunities were directed to data engineers, 22.3% to data analysts, and 12.9% to data scientists. The remaining opportunities were classified in the “other” category, which included software engineers, machine learning engineers, and business analysts (Figure 2).
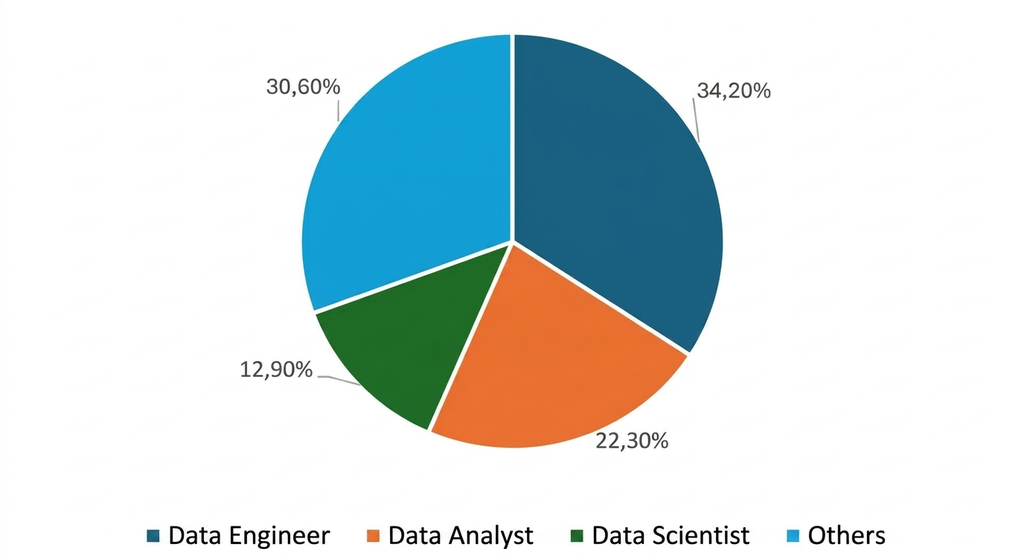
Source: Original research results
As this is information that could be provided at different levels (city, state, or even country), it was also necessary to process the location column, separating it into city and state levels. It was observed that the greatest availability of job openings was in the state of São Paulo, with 50.7% (Figure 3). However, 209 job openings were classified at the country level and therefore did not appear in the state distribution graph, a factor due to many job openings in the area being remote.
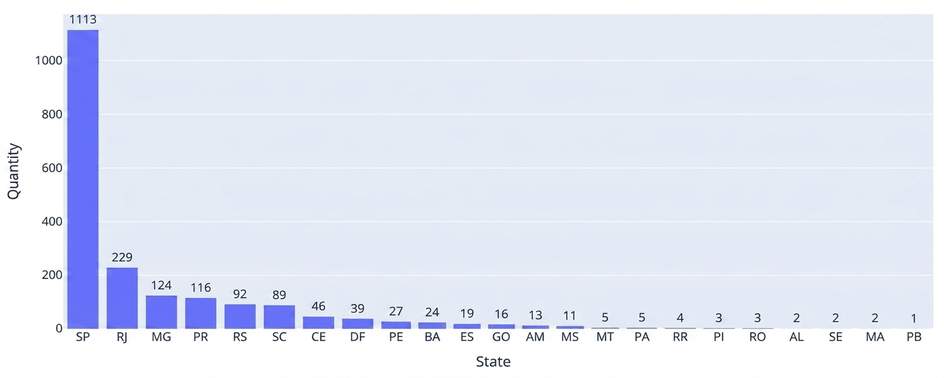
Source: Original research results
In the distribution of vacancies by municipality chart, 447 vacancies that were not classified at the city level were disregarded. It was observed that São Paulo led among the 20 cities with the most opportunities in the data area (Figure 4).
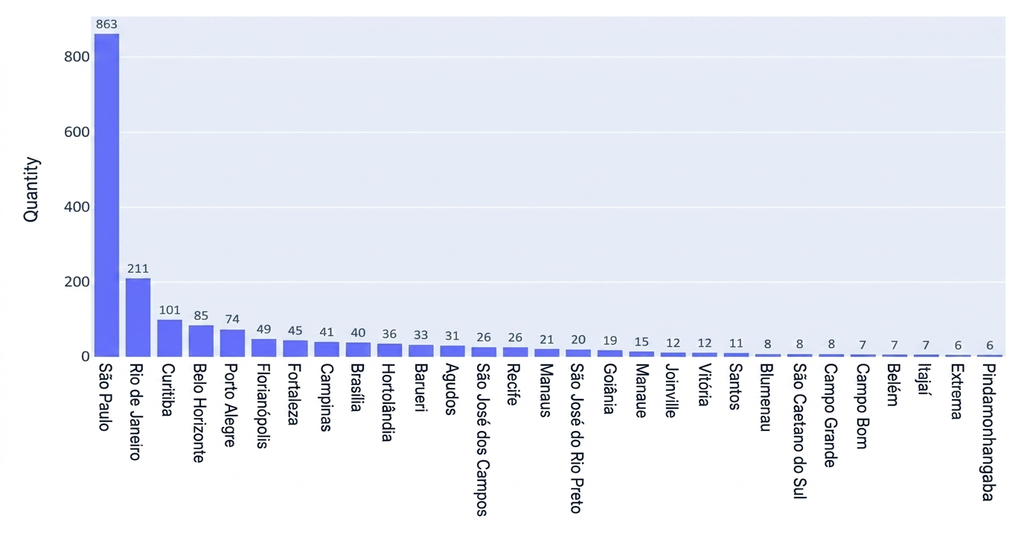
Source: Original survey results
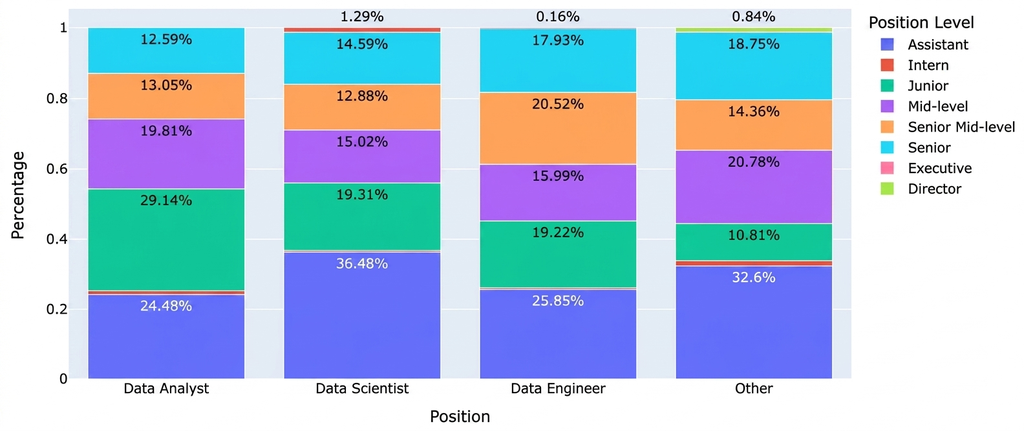
When analyzing the seniority level of job postings, it was observed that the information regarding the position is often not filled in or is filled in incorrectly in the platform’s postings. This can be observed, for example, in postings classified as Assistant level, but with a title or description specifying a mid-level or senior position. In order to minimize this problem, the “position level” field was generated to check if the seniority level was specified in the job posting’s title or description and, when not, if the field provided by the tool itself was used. Even with the implemented treatment, a considerable number of postings still remained with a null or incorrectly indicated seniority level.
Disregarding null data, the distribution of seniority levels for available positions was analyzed (Figure 5). It was observed that the junior level is more significantly representative for the data analysis role (29.14%) than for others. In contrast, the mid-level and senior levels were concentrated in positions intended for data engineers (38.45%), while positions for data analysts and scientists were in an intermediate position (between 15% and 17%) for senior levels. One of the hypotheses raised is that data analysis is an entry point to the field, while data engineering is a role that requires more technical knowledge, leading companies to seek more senior professionals. It is important to note that the “other” category presented a significant number of positions at high levels by allocating roles with high seniority, such as tech lead or machine learning engineers.
Source: Original survey results
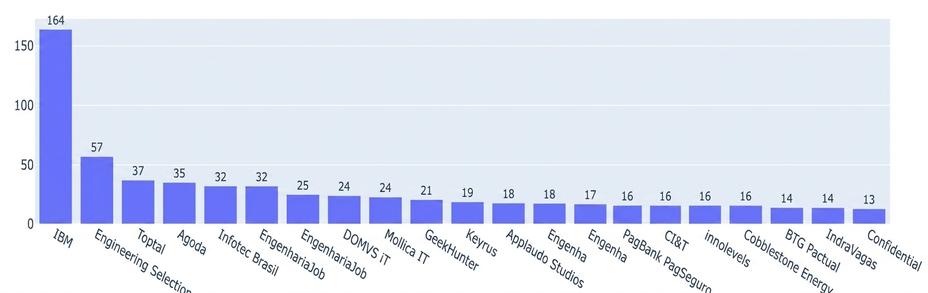
In the analysis of job distribution by companies in the data market, IBM stood out with the largest number of job openings, with more than double the positions published by the second-place company (Figure 6).
Source: Original survey results
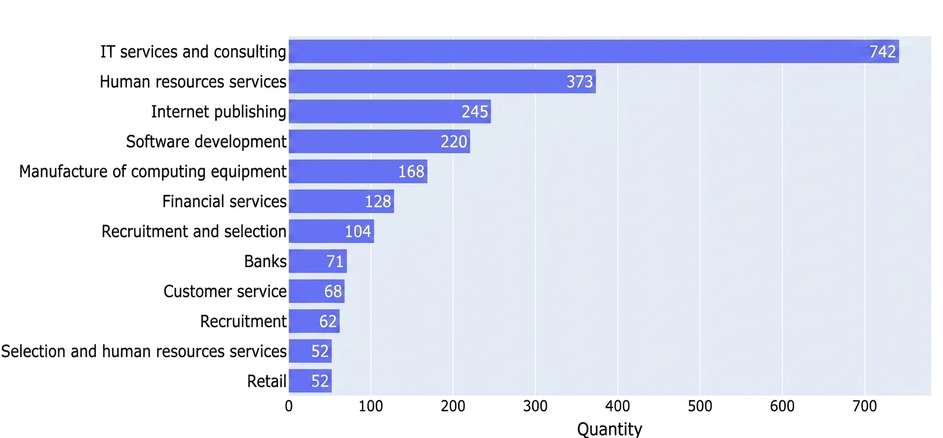
Regarding the sectors, those that presented the highest number of open vacancies were the IT services and consulting sector and human resources companies (Figure 7). This data highlights the growth that IT consultancies have been showing in recent years. Furthermore, it also emphasizes the role of human resources companies, which are hired by companies from various segments to seek qualified professionals in the market.
Source: Original survey results
Regarding the type of work and role, these did not generate relevant information for the analysis. However, when analyzing the created categories, the observed results corresponded to expectations, and the categories “Programming and Databases” were the most sought after, with at least one of the skills listed in them present in more than 65% of the vacancies. The categories “Cloud”, “Dashboards and Reports”, “Behavioral Skills” and “Big Data” also had a significant presence, with values close to 50% (Table 2).
| Category | Quantity | In percentage (%) |
| Programming | 1785 | 71.46 |
| database | 1669 | 66.81 |
| Cloud computing | 1259 | 50.40 |
| Behavioral | 1235 | 49.44 |
| Dashboards and Reports | 1198 | 47,96 |
| big data | 694 | 27.78 |
| Statistics | 579 | 23.18 |
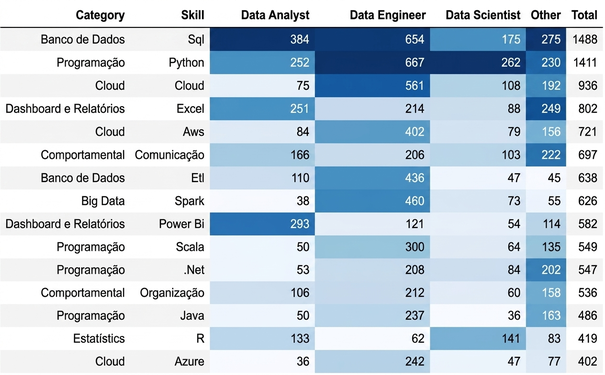
Observing the distribution of individual skills, it is seen that the five most sought-after were: SQL, Python, Cloud, Excel, and AWS (Table 3). It was possible to note that SQL and Python had a significant presence for all roles, but their positions varied according to each role. It was perceived that data analyst was the only one in which Python did not appear in first place, falling behind SQL and Power BI; while for data engineer and data scientist, Python led and SQL appeared in sequence. Another highlight is that Cloud, AWS, ETL, Spark, Scala, Java, and Azure skills were more present for the data engineer role, Power BI for the data analyst, and R for data scientist and data analyst. Curiously, communication and organization, two behavioral competencies, were among the 15 most sought-after competencies, suggesting that companies seek professionals who, in addition to technical knowledge, can communicate well and are organized.
Source: Original survey results
Next, seeking to understand the occurrence of more specific competencies for each position, the representativeness of each skill within each position was calculated, and for this, different weights were necessary, as the number of vacancies returned in the searches was different for each position.
In the position of data analyst, Power BI stood out in relation to the others, with 61.95% against 16.64%, 19.65% and 1.75% in the positions of engineer, scientist and others, respectively (Table 4). Two other data visualization tools that also appeared were Tableau and Qlik.
| Skill | Analyst_% | Engineer_% | Scientist_% | Other_% |
| power bi | 61.95 | 16.64 | 19.65 | 1.75 |
| table | 59.56 | 17.89 | 20.76 | 1.78 |
| qlik | 51.98 | 27.77 | 19.17 | 1.08 |
| html | 51.94 | 12.99 | 27.51 | 7.56 |
| sql server | 49.25 | 35.19 | 13.14 | 2.42 |
In the HBase requirement, 92.30% of the positions were directed to data engineers. Cassandra, ELT, Hive, and Data Warehouse were also part of the most requested skills for data engineers, as, in general, skills related to databases and big data carry more weight in engineer roles (Table 5).
| Skill | Analyst_% | Engineer_% | Scientist_% | Other_% |
| Hbase | 2.76 | 92.30 | 4.74 | 1.197419 |
| Cassandra | 11.73 | 77.80 | 8.08 | 1.064810 |
| Elt | 19.56 | 73.63 | 5.32 | 1.149562 |
| Hive | 7.74 | 71.46 | 20.43 | 1.335699 |
| A data warehouse | 15.37 | 69.16 | 14.62 | 1.267120 |
In the case of data scientists, it was observed that skills related to statistics and visualization packages stood out, with most of them having a delta of approximately 80% compared to others. It is also noteworthy that Stata presented 95.94% of opportunities aimed at this position (Table 6).
| Skill | Analyst_% | Engineer_% | Scientist_% | Other_% |
| Stata | 0.00 | 0.00 | 95.94 | 4.06 |
| Plotly | 6.77 | 0.00 | 93.23 | 0.00 |
| Regression | 7.15 | 1.1 6 | 90.72 | 0.98 |
| Probability | 6.48 | 2.53 | 89.29 | 1.70 |
| Matplotlib | 5.76 | 9.36 | 84.25 | 0.63 |
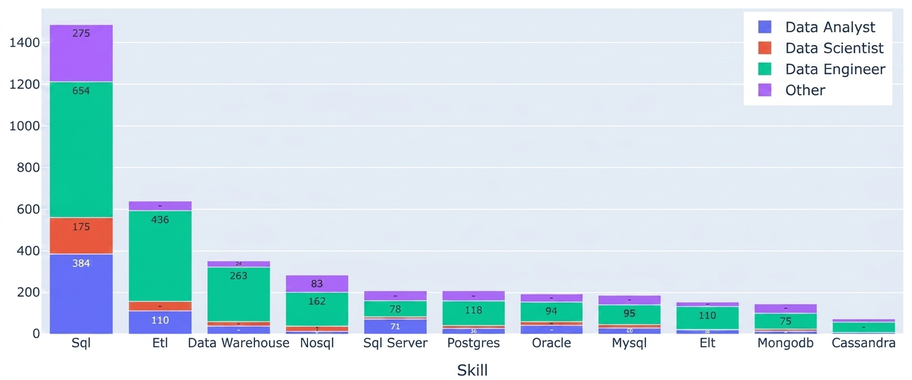
Finally, the most sought-after skills in each category were explored, and it was observed that, for databases, SQL stood out as the most popular (Figure 8). Of the total 2,498 job openings analyzed, 1,488 of them showed a preference for a candidate with knowledge or experience with SQL (Figure 8).
Source: Original survey results
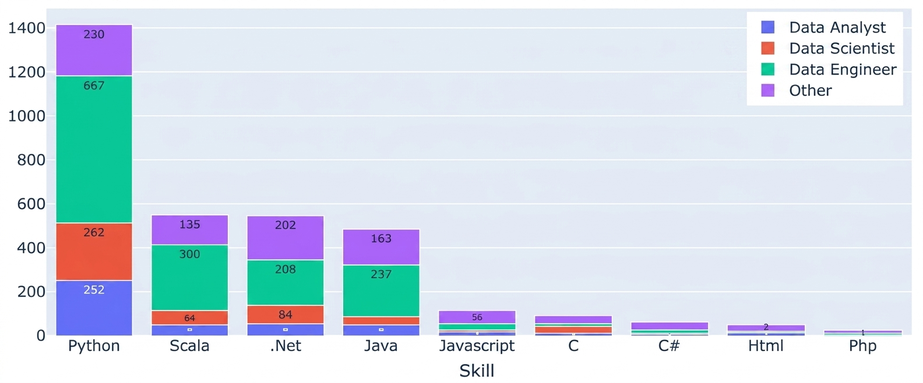
In the programming category, it was also possible to observe the predominance of one language over the others. Out of a total of 1,411 programming positions, 56.49% mentioned Python, a number more than twice as high as Scala (549 positions), which came in second (Figure 9). If R, allocated in the statistics category, were also considered for programming, it would occupy fifth place (419 positions), behind Java (486 positions).
Source: Original survey results
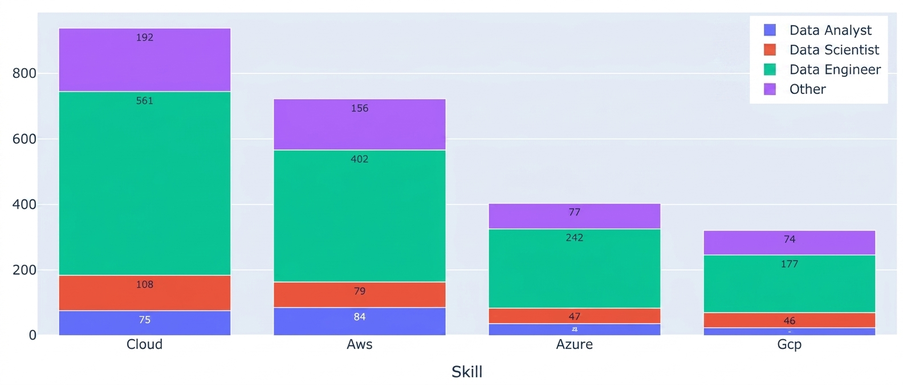
For the cloud category, we also chose to analyze the word itself, to check if the skill would also be cited without platform specification. The term cloud appeared 936 times, followed by the platforms AWS (721 times), Azure (402 times), and GCP (320), reflecting the market share of the Brazilian cloud market (Figure 10).
Source: Original survey results
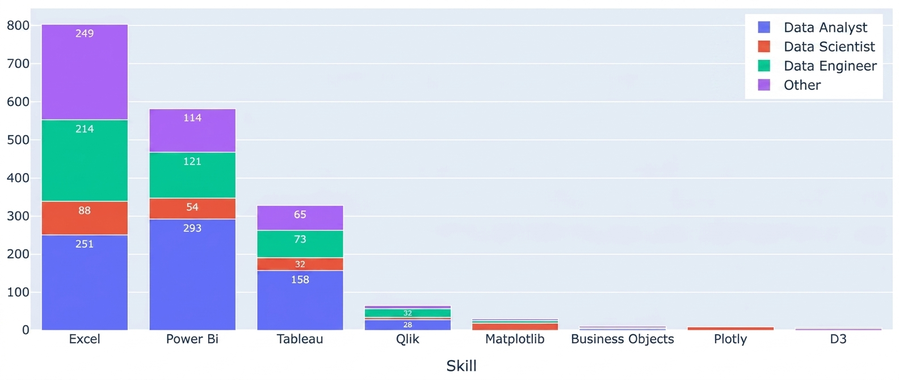
In the category of dashboards and reports, the most popular were Excel, Power BI, and Tableau, and, as expected, they were more numerous for data analyst positions. They also had a high volume of appearance for “other” positions, likely related to business analyst positions, a role for which knowledge of data visualization and analysis tools is required, especially Excel, seen as the entry point to this area (Figure 11).
Source: Original survey results
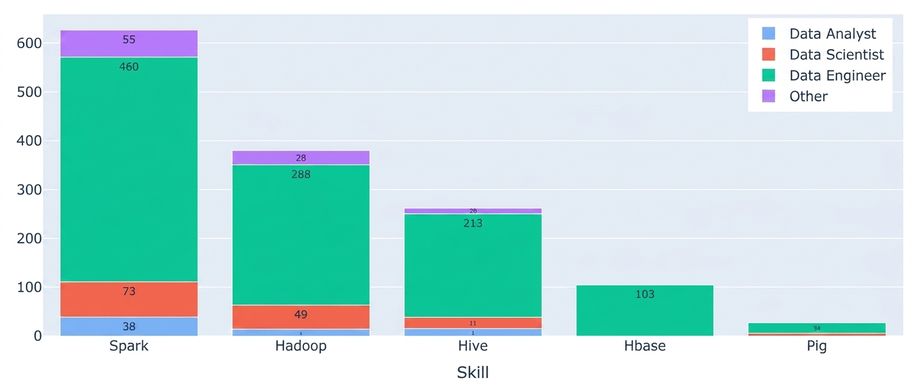
In the big data category, Spark, Hadoop, and Hive were observed to stand out as the most sought-after skills. It is important to note that these are, by far, the most requested for data engineers (Figure 12).
Source: Original survey results
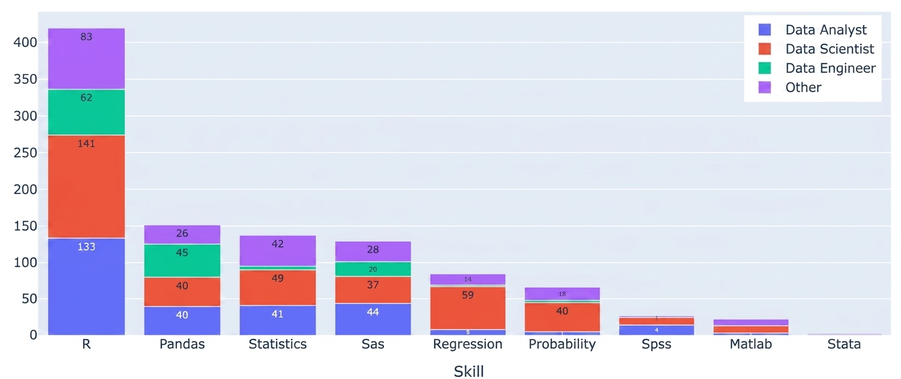
In the statistical category, statistics was also analyzed as a skill. It was among the four most popular skills for the category, with 5.5%, along with R, which led with 16.77%. Pandas (6%) and SAS (5%) came in second and fourth place, respectively (Figure 13). In this category, it was possible to observe that the value levels for data scientists were greater than or equal to those in other categories — which did not happen in other categories, corroborating the importance of statistics for these roles.
Source: Original survey results
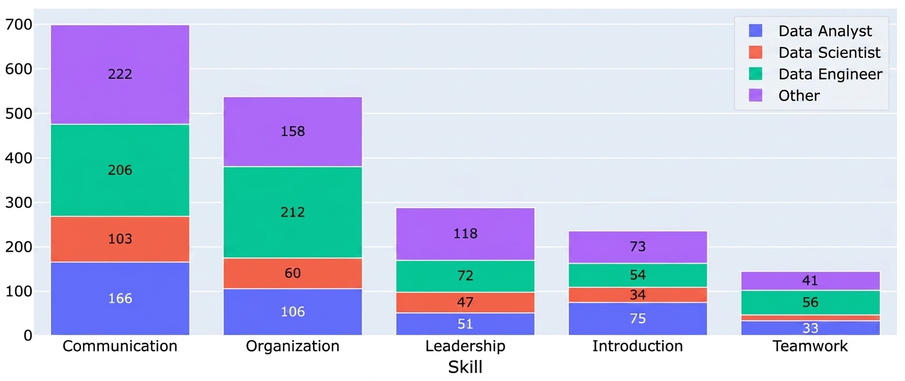
Finally, among the behavioral skills, communication and organization stood out as the most predominant (Figure 14).
Source: Original survey results
Association between skills
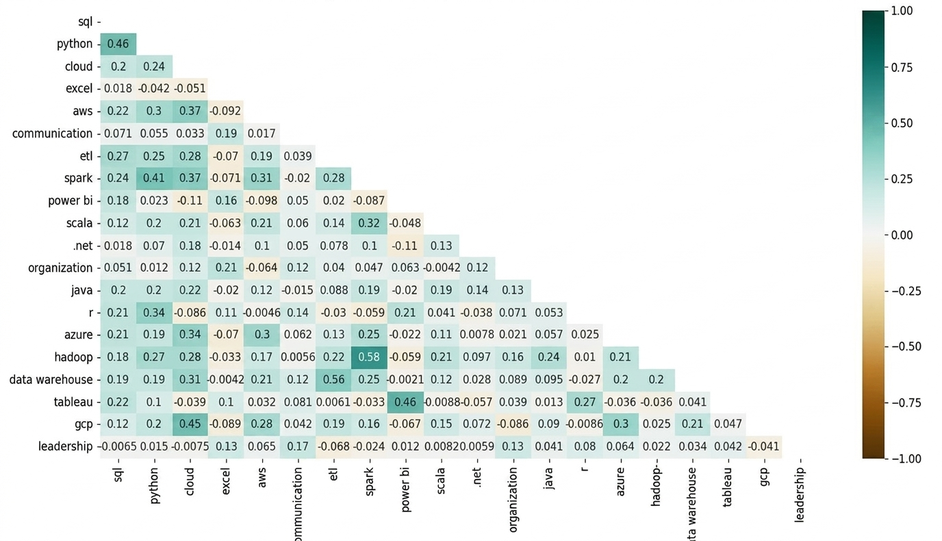
To analyze the association between skills, the top twenty were considered, and it was possible to identify strong positive correlations between some of them. The greatest of these associations was observed between Hadoop and Spark, different technologies, but considered structural for the big data category. In the same vein, Spark and Python also had strong relationships, demonstrating that Python is widely required in conjunction with Spark. Power BI and Tableau had a prominent association and, as they are analogous tools, the hypothesis was generated that companies are flexible regarding which BI tool the candidate needs to have experience with, leading to the conclusion that they are requested separately, not together. The association between Python and SQL reaffirmed the importance of mastering both skills in the current data market. The high correlations between cloud and cloud platforms, such as GCP, did not differ from expectations and, therefore, were not considered as sources of insight. The remaining associations were moderate or weak (Figure 15).
Source: Original survey results
Textual data mining
In order not to limit the analysis to only the pre-selected skills, text mining was also performed to search for unknown information that could be useful within the publications. For this, the Tidytext library was used to search for n-grams, that is, the occurrence of word sequences in the title and description textual fields. The treatments performed were: converting all words to lowercase; removing punctuation, special characters, and “stopwords”, in English and Portuguese — common words to the languages, but that did not add to the analysis, such as, for example, articles and prepositions (o, a, em, no).
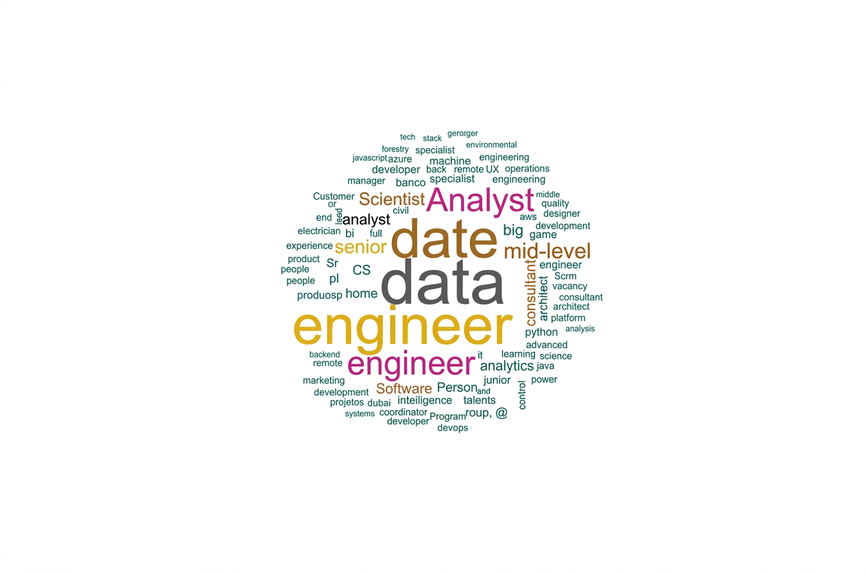
The unigrams from the job titles, which are the main individual words found, were visually represented in a word cloud (Figure 16) to give greater prominence to the most frequent words. Overall, the words “dados”, “engenheiro”, “analista”, “cientista”, and their English variations, were the most prominent. The high occurrence of English terms shows the importance of also searching for jobs using keywords in this language.
Source: Original research findings
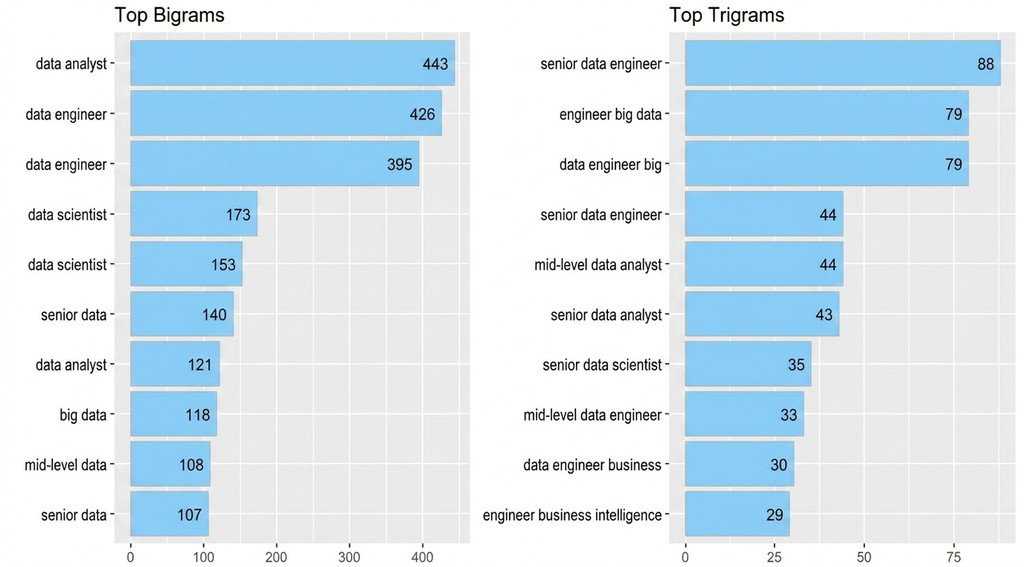
Bigrams and trigrams showed which were the most frequent two- and three-word combinations in the text (Figure 17). Most of the combinations in the job titles corresponded to the positions that received the most focus in this work: data analysts, scientists, and engineers, and their respective levels — with the exception of big data and
business intelligence, which are variations of the data job titles and also proved to be relevant.
Source: Original research results
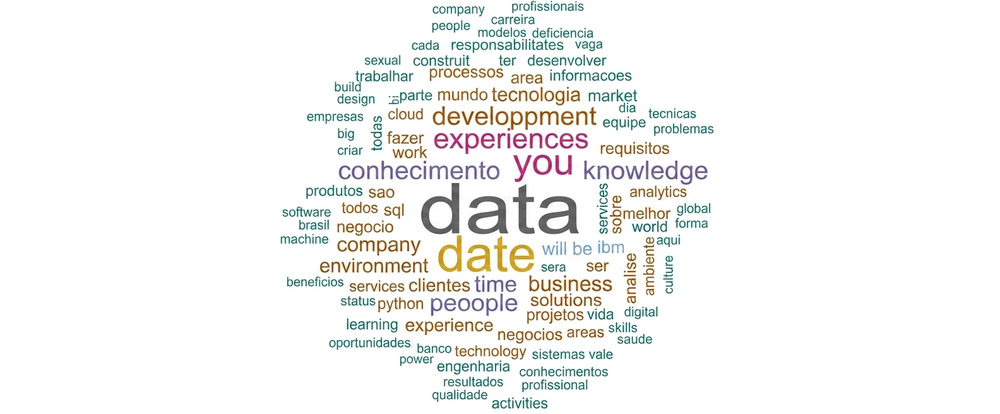
In the word cloud corresponding to the job description (Figure 18), Python and SQL stood out, skills that were identified in this work as the most requested in the data area. The high occurrence of the terms “team”, “business”, “people”, “clients”, “requirements”, “processes”, and “projects” highlights the importance of data professionals also developing skills in processes and projects, as well as interpersonal skills for relationships with people, teams, and clients.
Source: Original survey results
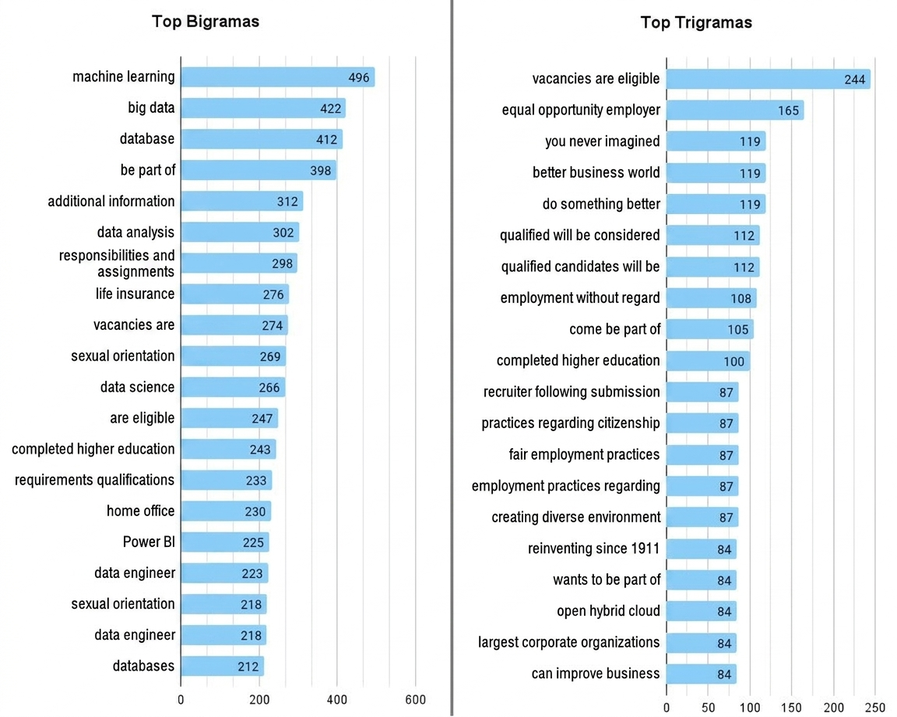
To analyze each position separately, only the description field was used, as it generated more relevant information (Figure 19).
Source: Original research results
It was observed to be opportune to also generate an analysis of the n-grams of the job descriptions for each position separately. The trigrams did not return interesting information and, for this reason, were not considered.
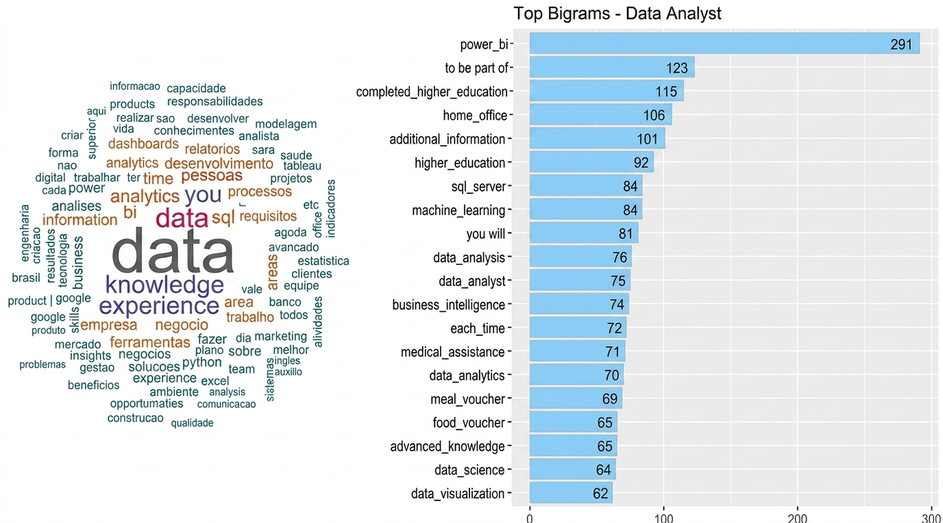
For the data analyst positions, technical analysis and visualization skills, such as Power BI, dashboards, SQL; data that corroborated the findings previously described in this study (Figure 20) were highlighted.
Source: Original survey results
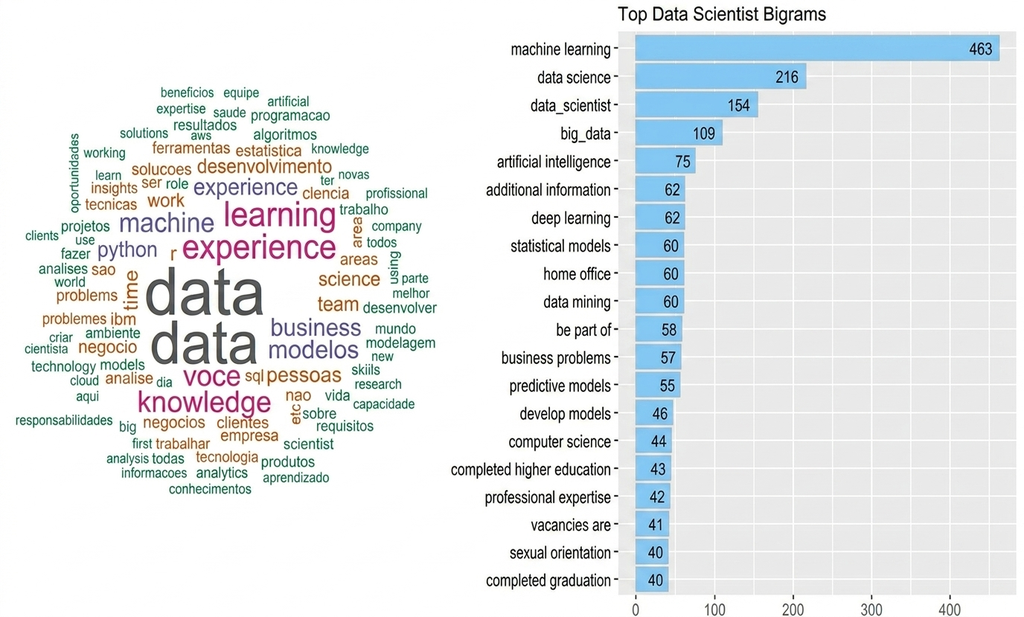
Regarding the opportunities for data scientists, the highlighted terms were: “Machine learning”, “data science”, “big data”, “artificial intelligence”, “deep learning”, “statistical models”, and “predictive models” (Figure 21).
Source: Original research results
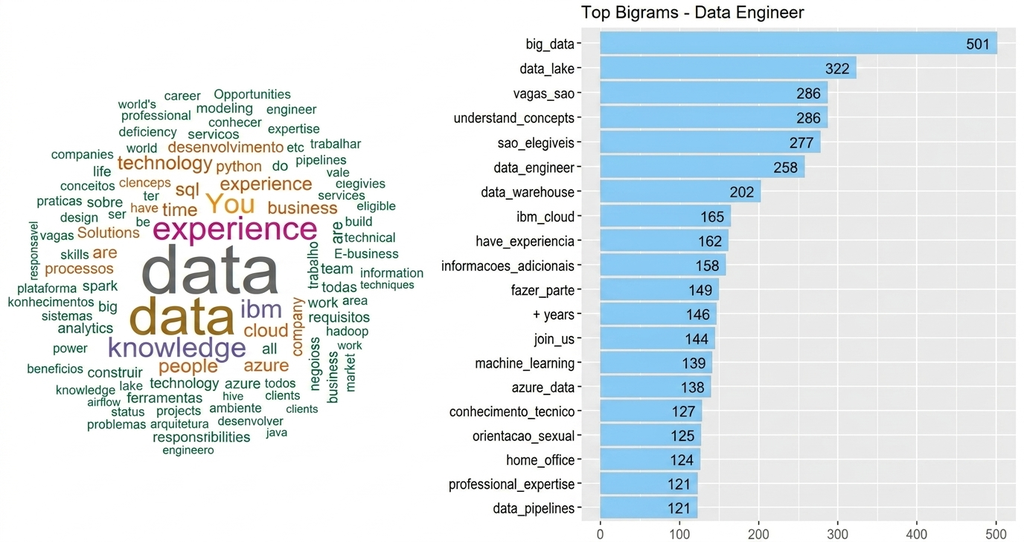
In the positions designated for data engineers, the highlighted terms were: “big data”, “data lake”, “data warehouse”, “data pipeline” and terms related to “cloud” (Figure 22).
Source: Original survey results
Personal management in organizations is a complex task, influenced by various internal factors, such as culture, strategy, and technology, as companies are configured as interdependent systems, in which people play a central role. Using data from LinkedIn job postings, it was possible to identify the main specific technical skills, in addition to behavioral competencies that are crucial in all IT roles. Skills such as Python and SQL stood out as essential for any career in the field, information that can help professionals and students prepare for the job market.
However, it was observed that there is still a lack of clear definition regarding positions and assignments, an important factor for defining roles, helping employees understand their role within the company, and guiding candidates in acquiring demanded skills. The main objective of this study was to offer initial insights on the topic and, from this, propose the possibility of future research exploring market trends and professional profiles in the IT area, as this is a constantly evolving scenario.
References
[1] LinkedIn. 2020. Emerging Jobs Report Brazil. Disponível em: https://business.linkedin.com/content/dam/me/business/en-us/talent-solutions/emerging-jobs-report/Emerging_Jobs_Report_Brazil.pdf. Acesso em: 10 mar. 2022.
[2] Fayyad, U.; Hamutcu, H. 2020. Toward Foundations for Data Science and Analytics: A Knowledge Framework for Professional Standards. Harvard Data Science Review, 2(2).
[3] Persaud, A. 2021. Key competencies for big data analytics professions: a multimethod study. Information Technology & People 34(1). 178-203. https://doi.org/10.1108/ITP-06-2019-0290.
[4] Dubey, R.; Gunasekaran, A. 2015. Education and training for successful career in big data and business analytics. Industrial and Commercial Training 47(4), 174–181. https://doi.org/10.1108/ICT-08-2014-0059.
[5] Verma, A.; Yurov, K.; Lane, P.; Yurova, Y. 2019. An investigation of skill requirements for business and data analytics positions: A content analysis of job advertisements. Journal of Education for Business 94. 1-8. https://doi.org/10.1080/08832323.2018.1520685.
[6] Pellaes, A. 2021. A adoção de ferramentas de atração e recrutamento online pelas organizações no Brasil: um estudo sobre motivações e impactos. Brazilian Journal of Business 3(4), 3192–3207. https://doi.org/10.34140/bjbv3n4-027
[7] Zhao, B. 2017. Web Scraping. In: Schintler, L., McNeely, C. (eds) Encyclopedia of Big Data. Springer, Cham. https://doi.org/10.1007/978-3-319-32001-4_483-1
[8] Reis, E.A.; Reis, I.A. 2002. Análise Descritiva de Dados. Relatório Técnico do Departamento de Estatística da UFMG.
[9] Chicco, D.; Jurman, G. 2020. The advantages of the Matthews correlation coefficient (MCC) over F1 score and accuracy in binary classification evaluation. BMC Genomics. 21(6). https://doi.org/10.1186/s12864-019-6413-7
How to cite
Scalioni D.L.; Sátiro R.M.; The most requested data analysis skills in the job market. E&S Journal. 2025; 6: e20240033.
About the authors
Déborah Lima Scalioni – Specialist in Data Science and Analytics. Rua Antônio Jordão, 443, Residencial Jardim Califórnia, ZIP Code: 13857-000, Estiva Gerbi, SP, Brazil
Renato Máximo Sátiro – Federal University of Goiás – UFG. Doctor in the Graduate Program in Administration. Avenida Esperança s/n, Samambaia Campus – Rectorate Building. 74690-900 Goiânia, GO, Brazil.