
Income Concentration
Productive Diversification
Indices
Labor Market
January 29, 2024
Labor market quality: intermediary of the relationship between productive diversification and income inequality
DOI: 10.22167/2675-6528-20230115
E&S 2024, 5: e20230115
Jaqueline Moraes; José Erasmo Silva
Studies on the diversification of the productive structure have as a pioneer the work developed by Frenken et al.[1], which measures the impact of diversification measures (related and unrelated), further explored below, on traditional labor market metrics such as unemployment, productivity, and employment levels. Moraes[2] proposes an approach to the relationship with the quality of the Brazilian labor market, measuring how related variety (hereinafter RV) and unrelated variety (hereinafter UV) affect different quantiles of the quality distribution in the states. It was possible to conclude that UV has more influence on the equalization of labor markets, which, in a way, corroborates the result found in Hartmann et al.[3], which points to an increase in the skill premium among workers in regions that diversify into unrelated activities, influencing the income distribution of the area.
Based on these results, another complementary and intermediate approach was proposed, designed to test the relationship between labor market quality and income inequality in Brazilian states. Moraes[4] argues that the impact of increased quality is negative for states that are more unequal and that, when considering the Gini, Mehran, and Piesch indices as indicators of inequality, the effects are even greater. However, these were separate analyses. The objective of this work is to unite the two ends — diversification of the productive structure and income inequality — through the quality of the labor market, offering an additional, structural component to explain the effects and impacts. To this end, this work will use a structural equation model, analyzing the direct and indirect effects of UV, specifically, on income inequality. The indirect effect is the impact of UV on the Labor Market Quality Index (IQMT), and the direct effect concerns the action of UV on inequality indices.
To achieve the objectives of this study, data from the Continuous National Household Sample Survey (PNADc), conducted by the Brazilian Institute of Geography and Statistics (IBGE), with quarterly data from the first interview, were used for the period from 2012 to 2020. Based on this data, the UV and income inequality (Gini, Mehran, and Piesch) indicators, in addition to the IQMT, were created. The UV indicator was calculated using data from the National Classification of Economic Activities Household 2.0 (CNAE Household 2.0), presented in the Continuous PNAD at the state level. The calculation is as shown in Equation (1):

where: is the participation of economic sectors, which is the sum of the participations of economic activities of the sectors in terms of participation in employment.
The inequality indicators follow the traditional measurement proposed by Hoffmann[5] and were calculated for the states. They are indicators associated with the Lorenz curve and the line of perfect equality, such as the Gini index (G), the Mehran index (M), and the Piesch index (P). The IQMT is a latent index created from selected variables, using principal component analysis (PCA). The variables used to compose the IQMT are present in Table 1. It is assumed that the principal component is the latent factor that measures labor market quality and will be used as the IQMT.
Table 1. Variables used for the calculation of the employment quality index, divided by dimensions

Source: Original survey data with information from PNAD Contínua.
Note: *This variable compares two variables: hourly wage for hours actually worked × 4.3 (weekly wage) and the minimum wage of the reference year/172 (weekly minimum wage).
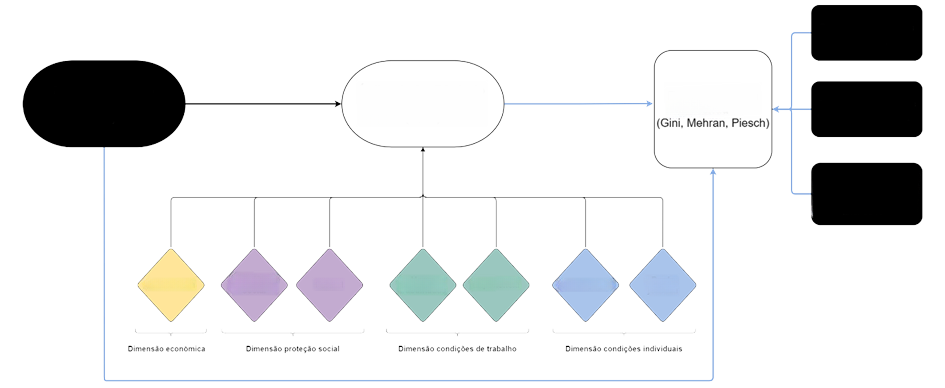
To study the proposed relationship, the structural equation model (SEM) was used, following the logic presented in Figure 1. In addition to the main variables (UV, IQMT, and income inequality), control measures were included: proportion of people with higher education, proportion of women in leadership positions (“proxy” for the glass ceiling phenomenon), and proportion of employed individuals in industry, the public sector, and financial services.
Figure 1. Proposed structural equation model for the article
Source: Original research results.
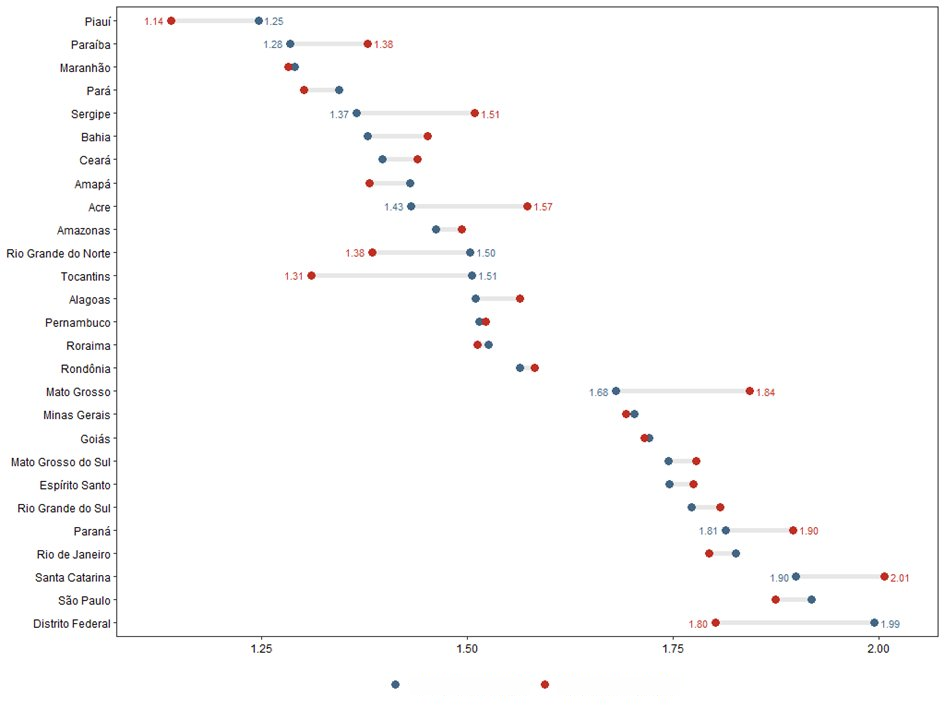
For this study, the hypothesis was assumed that the UV positively affects the IQMT — indirect effect —, and this negatively affects inequality. Furthermore, the UV negatively affects inequality — direct effect. Thus, the effect that the UV has on inequality is mediated by the IQMT. Control variables are also expected to have negative signs in their relationship with income inequality. The created IQMT has a Barlett’s test of sphericity statistic of 233.258, with 28 degrees of freedom and a p-value of 0.000. This indicates that the set of variables is adequate for factor analysis. The Kaiser-Meyer-Olkin (KMO) measure for the calculated IQMT was 0.8178, being classified as very good the overall adequacy of the factor analysis[6]. In Figure 2, it is possible to see the evolution of the IQMT for Brazilian states in the period from the first quarter of 2012 to the fourth quarter of 2020.
The results encompass some important phenomena. First, the Brazilian economy from 2012 to 2020 underwent enormous leaps. However, in terms of the labor market, between 2016 and 2017, there was the Labor Reform, which regulated new forms of employment, flexibilized remuneration mechanisms, and changed the functioning of the Labor Courts. In 2019, there was a large and important expansion in the number of informal jobs and atypical, partial, and intermittent formal contracts, which are regulated along with “home office” jobs, stemming from the Reform. These contracts became more evident in 2020, with the COVID-19 pandemic. As it was calculated up to the fourth quarter of 2020, this index cannot yet accurately capture the effects of the first year of the pandemic.
Figure 2. Evolution of the Gross Tax Burden for Brazilian states from the first quarter of 2012 to the fourth quarter of 2020
Source: Original research results.
The proposed SEM was estimated by two methods, namely: “maximum likelihood (ML)” and “weighted least square mean and variance adjusted (WLSMV)”. The decision criteria used for comparison in choosing the best model were the “confirmatory factor index (CFI)”, “Tucker-Lewis index (TLI)”, “root mean square error of approximation (RMSEA)” and “standardized root mean square residual (SRMR)”, in addition to the chi-square test statistic of the model[7],[8]. The values can be observed in Table 2.
Table 2. Estimated models adjustment measures
| Model | Measure | Estimator | CFI | TLI | RMSEA | SRMR | p-value | |
| 1 | Gini | WLSMV | 0,990 | 0,971 | 0,070 | 0,032 | 99,609 | 0,000 |
| 2 | Piesch | WLSMV | 0,990 | 0,971 | 0,070 | 0,032 | 99,609 | 0,000 |
| 3 | Mehran | WLSMV | 0,990 | 0,971 | 0,070 | 0,032 | 99,609 | 0,000 |
| 1 | Gini | ML | 0,821 | 0,462 | 0,287 | 0,087 | 243,317 | 0,000 |
| 2 | Piesch | ML | 0,813 | 0,438 | 0,287 | 0,082 | 243,317 | 0,000 |
| 3 | Mehran | ML | 0,838 | 0,515 | 0,287 | 0,092 | 243,317 | 0,000 |
For any of the inequality measures used as variables, the WLSMV estimator is preferable to ML. The following explores the results obtained in the three estimated models, which seek to explain the Gini index, Piesch index, and Mehran index.
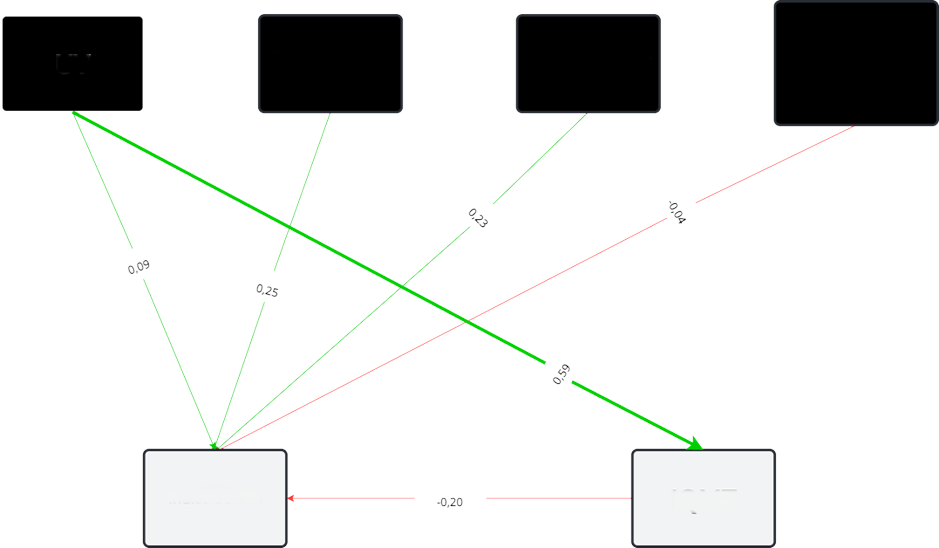
Unrelated diversification, at least directly, positively impacts income inequality. However, its much more positive effect on labor market quality indirectly impacts the Gini index through it, as can be seen in Figure 3. Thus, UV positively affects IQMT (as previously found[2]) — an indirect effect —, and this negatively affects inequality. However, it was expected that UV would negatively affect inequality — a direct effect —, and this did not happen. Nevertheless, it can be understood that, as this effect is permeated among workers, it occurs within the labor market and not within the region’s productive structure. In other words, when the authors[10] state that in more diversified economies individuals have more opportunities to learn and choose their occupations — contributing not only to the portfolio but also to making the economy less unequal —, this is related to the increase in the region’s labor market quality.
Figure 3. Structural equation model for the Gini index
Source: Original research results.
Furthermore, such a result manages to connect the dots from what was previously studied[2], demonstrating that UV more positively affects labor markets with lower associated quality and that the increase in the quality of jobs generated in a state seems to be able to decrease its income inequality[3]. All of this through the indirect impact of the diversification of the productive structure on the labor market, acting on income inequality.
Regarding the control variables, all pointed to effects contrary to what was expected. For this model, the proportion of employed in industry was not significant. The interpretation of the coefficients is such that a one-unit increase in the UV measure leads to an increase of 0.09 units in Gini, and 0.59 in IQMT, which in turn decreases the Gini index by 0.20 units, on average, ceteris paribus. A one-percentage-point increase in the proportion of people with higher education causes an increase in Gini of 0.25 units, and a one-percentage-point increase in the proportion of women in leadership positions causes growth in Gini by 0.23.
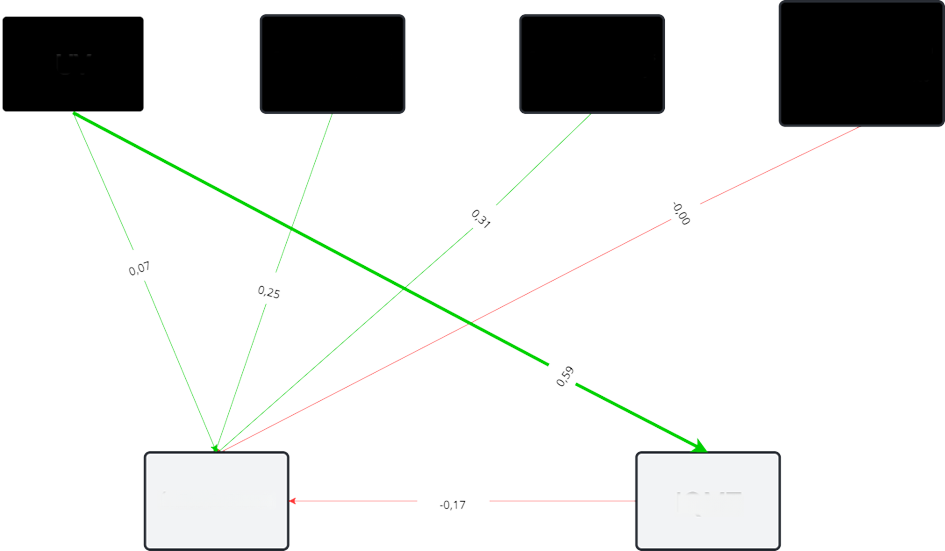
For the Piesch index, a large part of the conclusions remain, including the non-significance of the proportion of employed people in industry, as can be seen in Figure 4. What changes are the magnitudes of the estimated coefficients. Thus, an increase of one unit in the UV measure leads to an increase of 0.07 units in the Piesch index, and 0.59 in the IQMT, which, in turn, decreases the Piesch index by 0.17 units, on average, ceteris paribus. An increase of one percentage point in the proportion of people with higher education increases the Piesch index by 0.25 units, and an increase of one percentage point in the proportion of women in leadership positions increases the Piesch index by 0.31.
Figure 4. Structural equation model for the Piesch index
Source: Original research results.
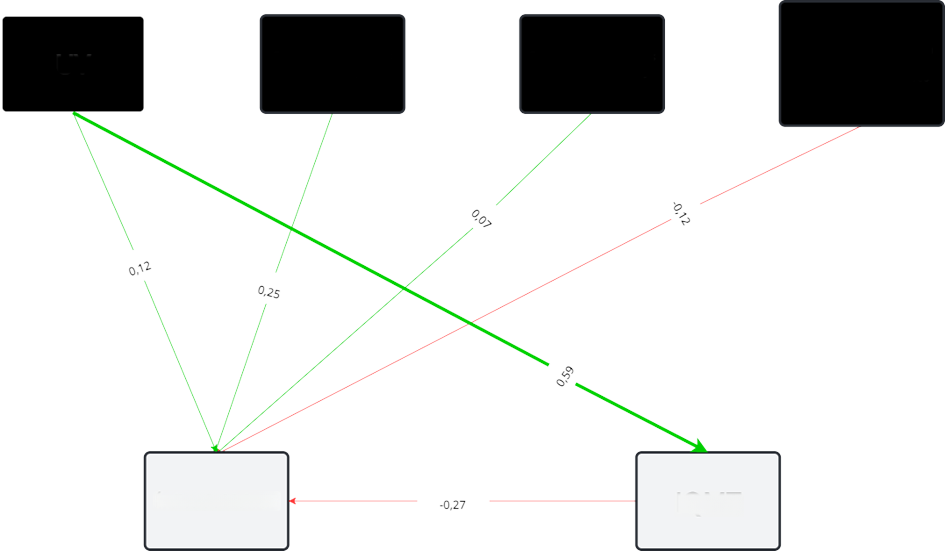
In the model of Figure 5, neither the variable of proportion of employed in industry nor the proportion of women in leadership positions proved significant. Following the same logic explored above, a one-unit increase in the UV measure leads to a 0.12-unit increase in the Mehran index, and a 0.59 increase in the IQMT, which, in turn, decreases the Mehran index by 0.27 units, on average, ceteris paribus. A one percentage point increase in the proportion of people with higher education increases the Mehran index by 0.25 units.
Figure 5. Structural equation model for the Mehran index
Source: Original research results.
Regarding the fit of these models, it can be said that they presented good quality measures. The CFI and TLI above 0.9 indicate that the model can improve the explanatory capacity of income inequality variability by more than 90%. In the estimated models, the CFI was 0.991, and the TLI was 0.973. The RMSEA and SRMR below 0.08 indicate that the model is well-adjusted, in the sense that the residuals left by it are low, granting them good predictive capacity. In the estimated models, the RMSEA was 0.070, and the SRMR was 0.032. Furthermore, the p-value of the models confers global significance to them.
The non-significance of the occupation variable in industry, public services, and financial services can be explained by the drop in the participation of these sectors in job creation in Brazil. Although the main driver of job creation in the country is the tertiary sector, these vacancies are not concentrated mainly in occupations within this area, but rather in vacancies in the accommodation, food services, and domestic services sectors. The main results of this study manage to connect the dots of what had already been studied, through the analysis of the indirect impact of the diversification of the productive structure on the labor market, acting on income inequality.
It is important to highlight that this work faced some limitations, natural to studies of this nature. Firstly, it is possible to rethink the variables considered in the creation of the IQMT, as well as propose better classification methods in the composition of the binaries. Secondly, it is important to rethink inequality in a multidimensional format — as already happens with poverty measures —, which takes into account not only income metrics. Thirdly, possibly these results would be different if isolated for large occupational classification groups, which would be highly relevant, considering that the shares in total employment are different among the groups, as was possible to perceive in the results of the work. Fourthly, and this is linked to any econometric work, the applied methodology can be rethought.
References
[1] Frenken K.; Oort F.V.; Verburg,T. Related variety, unrelated variety and regional economic growth. Regional Studies, Taylor & Francis. 2007; 41(5): 685–697. DOI: https://doi.org/10.1080/00343400601120296.
[2] Moraes J. Diversificação econômica e qualidade do mercado de trabalho no Brasil: uma abordagem de regressão quantílica para dados em painel (2012–2019) [Tese de Doutorado], Campinas (SP): Universidade Estadual de Campinas; 2020. Disponível em: https://repositorio.unicamp.br/acervo/detalhe/1128687. Acesso em: 31 out. 2023.
[3] Hartmann D; Guevara M.R.; Jara-Figueroa C.; Aristarán M.; Hidalgo C.A. Linking Economic Complexity, Institutions, and Income Inequality. World development. 2017; 93: 75–93. DOI: http://dx.doi.org/10.1016/j.worlddev.2016.12.020.
[4] Moraes J. Labor Market Quality and Income Inequality: An Approach of Quantile Regression for Panel Data for Brazil (2012–2018). In: Anais do IX Congreso de la Asociación Latinoamericana de Poblacion (ALAP); 2020. Disponível em: https://congresosalap.com/alap2020/resumos/0001/PPT-eposter-trab-aceito-0078-1.PDF. Acesso em: 31 out. 2023.
[5] Hoffmann R. Decomposition of Mehran and Piesch inequality measures by factor components and their application to the distribution of per capita household income in Brazil. Brazilian Review of Econometrics. 2004; 24(1): 149–171. DOI: https://doi.org/10.12660/bre.v24n12004.2706.
[6] Fávero L.P.; Belfiore P. Manual de análise de dados: estatística e modelagem multivariada com Excel, SPSS e Stata. Rio de Janeiro (RJ): Elsevier Brasil, 2017. 1187 p.
[7] Brown T.A. Confirmatory factor analysis for applied research. 2ed. Nova York (NY): Guilford Publications. 2015. 462 p.
[8] Kline R.B. Principles and practice of structural equation modeling. 4ed. Nova York (NY): Guilford Publications. 2015. 532 p.
Como citar
Moraes, J.; Silva, J. E. Qualidade do mercado de trabalho: intermediário da relação entre diversificação produtiva e desigualdade de renda. Revista E&S. 2024; 5: e20230115.
About the authors
Jaqueline Moraes  , Brazilian Micro and Small Business Support Service [SEBRAE] National Unit – Strategic Management Unit – Avenida Imperatriz Leopoldina, 550 – Vila Nova; CEP 13073-035 – Campinas/SP, Brazil.
José Erasmo Silva , MBA Data Science and Analytics Advisor Professor – Rua Maria Társia, 51 – Jardim Elite; CEP 13417-440 – Piracicaba/SP, Brazil.
Download link: PDF