
Fertilizers
Fertilizers
Market
Prices
February 11, 2022
Market trends in the fertilizer segment for grain production
DOI: 10.22167/2675-6528-20220020
E&S 2022,3: e20220020
Situational analysis
Kessler Teixeira Erthal; Edson Pereira da Mota
The COVID-19 pandemic generated a series of economic repercussions that impacted all sectors of the global economy[1]. The actions established to control the spread of the disease, such as social distancing and “lockdown”, generated negative impacts on the economy that were quickly perceived, a fact that led governments of many countries to take different measures to stimulate economies[2],[3].
An important reflection, which can be highlighted, was the search for food, driven by the prospect of prolonged confinement of people and the risk of inflation in agricultural products, which led countries to increase domestic stocks, such as grains (soybeans, corn, and wheat), in order to guarantee the food supply[4].
Agricultural production, in the primary sector of food security (animal or human), saw an increase in its demand and prices, especially for agricultural “commodities”[4]. Thus, it generated better selling prices for the rural producer, but it is important to note that the inputs necessary for production also experienced increases.
The high prices of agricultural “commodities” favored investments in technology and expansion, for example, the conversion of areas for agriculture, as well as the migration of pasture areas to grain cultivation. In both scenarios, these changes meant an increase in the consumption of fertilizers, mainly Nitrogen (N), Phosphorus (P2O5) and Potassium (K2O)[5], [6], [7], [8]. The fertilizer sector is responsible for 40 to 50% of grain production, thus, it became necessary to carry out careful analyses of these inputs within the production chain[9].
In Brazil, in recent years, the evolution in the use of fertilizers to increase agricultural production reflects the increase in productivity, due to the increasingly rational and technical use of these inputs. Brazilian agriculture, in the last 35 years, has had its cultivated area increased by 36.2% while production grew by 253%, with emphasis on the adoption of the second harvest and the increase in biotechnology used in crops, both driven by the use of fertilizers[10].
Regarding the changes in the fertilizer market, the consumption and prices of these inputs have been increasing, influencing the production chain of NPK raw materials. The increase in fertilizers began in 2017 and extended until mid-2019, representing a 38% increase in prices during this period due to the truckers’ strike in 2018, freight price controls, trade instability between China and the United States, and political-electoral problems that caused currency devaluation[11]. Shortly after this period, the pandemic declared in 2020 began.
In this context, the analysis of the COVID-19 scenario and its impacts on prices and the production of second-crop soybeans, corn, and wheat in the state of Paraná, in the face of increased demand for fertilizers, is fundamental to understanding the sector’s dynamics and allowing strategies to be outlined for greater predictability of market behaviors and, also, enabling assertive planning of agricultural activity.
Argus data and market information were used for the analysis of raw materials (fertilizers) sources of NPK, along with other relevant “commodities” such as Natural Gas representing oil. Relationships between fertilizers and commodities originating from agricultural production such as soybeans, corn, and wheat were also analyzed, crops with the largest regional coverage and fertilizer consumption.
For a complete analysis of production costs, the historical series of the National Supply Company (CONAB) was used, which employed the arithmetic mean to obtain the representativeness of fertilizers on the total cost (fixed and variable) of high-technology production for soybean, second-crop corn, and wheat cultures.
The study was conducted in the state of Paraná, with the following division: wheat – Capanema, Cascavel, Ubiratã, Londrina, Guarapuava, and Ponta Grossa; second-crop corn – Campo Mourão, Assis Chateaubriand, Francisco Beltrão, and Londrina; soybeans – Campo Mourão, Ponta Grossa, Guarapuava, Francisco Beltrão, and Londrina.
For the comparative analysis, “Cost and Freight” (CFR) Brazil prices were used for the standards: a) urea as the standard nitrogen source; b) monoammonium phosphate (MAP) as the source of (P2O5); and, c) potassium chloride (KCL) or muriate of potash (MOP). For the natural gas parameter, a reference from Houston (TX), United States (Argus Report) was used.
Regarding the average grain price values, the arithmetic mean was used for monthly prices in the period from February to July 2020, using the Secretariat of Supply of Paraná (SEAB)[12] as the source. It is noteworthy that the exchange rate variable was considered, as it directly interferes with the inputs and sale of grains; for this purpose, the Ptax selling rate (BACEN)[13] for the same period considered for the other variables was used. To obtain the exchange rates from 2019 to 2021, data up to July 30 was considered. The arithmetic mean of the Ptax and selling rates published by the Central Bank of Brazil was also used.
For CFR prices of Urea, (MAP) and (MOP), median values over weeks were considered. For the other variables analyzed, arithmetic means of the data were used for the consolidation of monthly results.
Following analyses, during the pandemic, some events altered the landscape in the fertilizer market, such as the drop in global urea production, linked to the increase in its worldwide consumption (mainly China). The closure of industrial plants with accumulated losses in Brazil, the North American taxation on phosphate products imported from Russia and Morocco, and finally, with the temporary closure of some (KCl) mines, associated with strong demand, brought a challenging scenario to the potassium market.
According to the consulting firm Argus, USD 1 mmbtu-1 of natural gas represented an increase of USD 33 t-1 in the price (CFR) of urea. For comparative purposes, according to studies by the Energy Research Company (EPE)[14], projects in Brazil are viable with gas prices of up to USD 7 mmbtu-1. Therefore, a scenario of increased demand and production costs for nitrogenous fertilizers creates real risks of a shortage of this element in the market.
Spikes in natural gas prices due to an arctic cold snap in the state of Texas, United States, led to a drop in oil and natural gas production and transportation, followed by increased consumption for space heating in mid-February 2021. Furthermore, increased nitrogen production in China to meet its domestic market demand caused an energy crisis[15] which reflected a 108% increase in gas consumption (Figure 1).
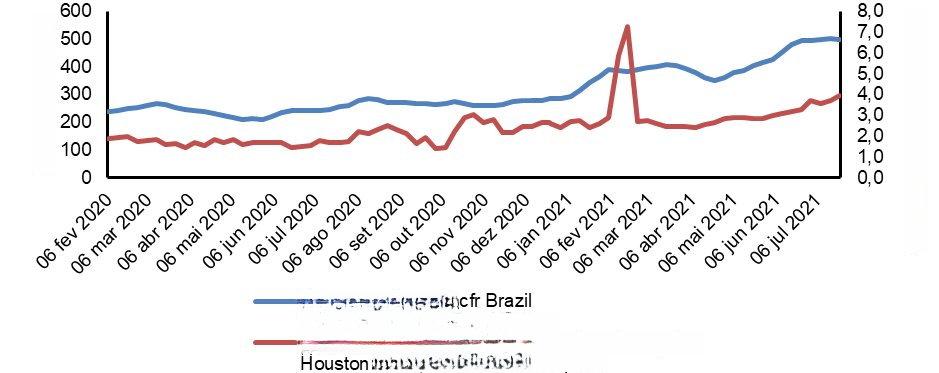
Figure 1. Oil values represented by natural gas and nitrogenous market, from February 2020 to July 2021
Source: Argus (2021)[16]
High-concentration phosphate fertilizers showed long price stability until early 2021, when international prices began a more intense upward trend. This movement was observed before the rise in natural gas prices in February 2021, making it impossible to establish a direct relationship between the two observed elements. A combination of external factors influenced the increase in phosphate product supply, such as limited availability for American buyers, reduced offers from major producers following the decision on taxes for products from Morocco and some Eastern European countries, the supply of the Chinese domestic market at the expense of exports, along with additional import demand from India and Brazil. For natural gas, a basic input in the production of ammonia used in the production of (MAP), in addition to the reasons discussed, the scarcity of the product in China was added due to temporary production restrictions aimed at curbing the advance of Covid-19 in the country[16]. It is worth noting the greater divergence between the curves observed from February 2021 onwards, reflecting the sharper rise in (MAP) (Figure 2).
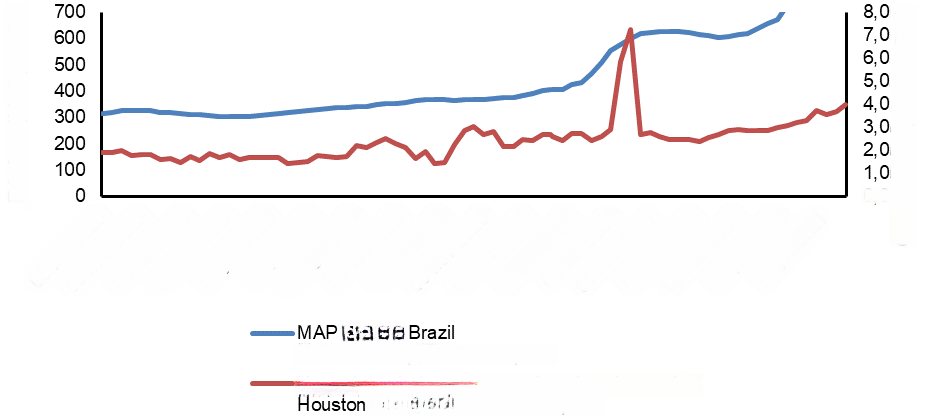
Figure 2. Oil values represented by natural gas and phosphate market, from February 2020 to July 2021
Source: Argus (2021)[16]
Regarding the potash market (MOP) in the evaluated period, stability in quotations was observed until early February 2021. Due to production reductions caused by the pandemic, associated with the closing of long-term supply contracts by producers from Eastern Europe and Israel, there was less supply. Import bans by the United States and the European Union on Belarus, reduced mine production in Canada, and strong global agricultural fundamentals indicate an increase in demand, driving up potassium prices worldwide[16] (Figure 3).
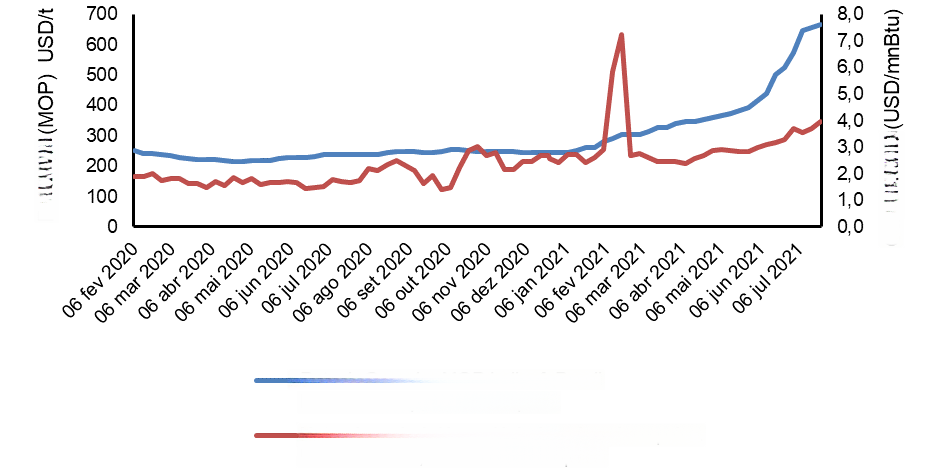
Figure 3. Oil values represented by natural gas and potash market, from February 2020 to July 2021
Source: Argus (2021)[16]
At the beginning of the pandemic, until mid-March 2021, there was an increase in the exchange rate of approximately 21% and 12% in Urea in the same period. From that period onwards, distinct trajectories became evident, with urea continuing to rise, reaching about a 40% increase by the first half of May, while the exchange rate showed a decrease of almost 11% in the same period. These actions contributed to the fluctuation of currencies worldwide and, specifically in Brazil, political factors were added to the pandemic, generating an environment of exchange rate instability[17].
The advance of vaccinations, combined with the momentary positive political environment, led to a 21% drop in the exchange rate in June 2021, compared to the previous month. This movement linked to political-sanitary factors continued to determine the currency’s fluctuations in the period from July 2020 to early July 2021[18]. Although the sector benefited from “commodity” prices, revenues tend to stabilize, with sales prices remaining stable, and production costs tend to rise [5],[6],[7],[8] (Figure 4).
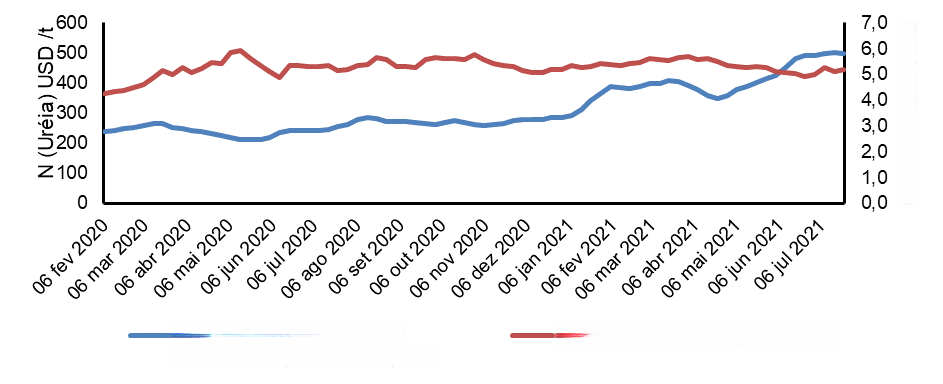
Figure 4. Nitrogen values and Ptax selling exchange rate, from February 2020 to July 2021
Source: Argus (2021)[16]
Considering the start of the pandemic period, the effects on the market were limited and approached market seasonality. However, the various events and factors throughout the year influenced high-concentration phosphate markets, resulting in a price escalation from December 2020 until March 2021, which led to an increase of approximately 63% or USD 240 t-1 (CFR). After a short period of stability and decline between April and May of the same year, a new wave of increases was observed, reaching around 100% growth in July 2021 compared to December 2020. However, the exchange rate remained with modest fluctuations, leading to the conclusion of low interaction between phosphates. Nevertheless, the appreciation of the real against the dollar, which began in mid-April 2021, suggests that it favored demand during that period, acting as an additional pressure factor on the prices of phosphate raw materials (Figure 5).
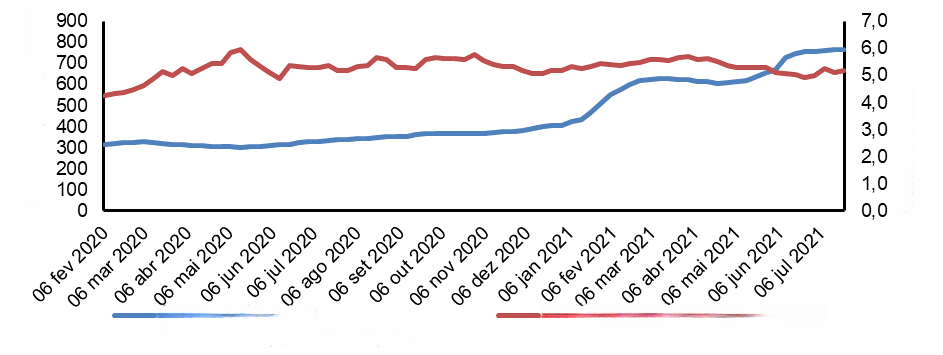
Figure 5. Phosphate values and Ptax selling exchange rate, from February 2020 to July 2021
Source: Argus (2021)[16]
The potash market, represented by (MOP), showed a long period of stability in values (CFR) with increased supply, as seen in May 2020. However, the scenario changed with global growth prospects. This movement intensified in June 2021 and remained high in the evaluated period. The intersection of the (MOP) (CFR) curves in relation to the exchange rate, which diverged, stood out as a consequence of a more intense effect on prices due to the dollar’s devaluation against the real. Furthermore, in the same interval, it stimulated new purchases of the input, which in turn favored the upward movement (Figure 6).
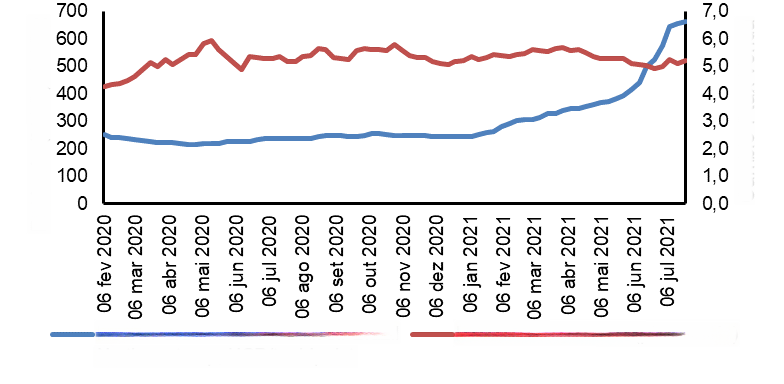
Figure 6. Potassium values and Ptax selling exchange rate, from February 2020 to July 2021
Source: Argus (2021)[16]
For Urea (CFR), with an 8% increase in the market, there was the influence of the average prices from Paraná for soybean, corn, and wheat crops between February and November 2020, with an accumulated increase of 89%, 71%, and 49%, respectively. However, in December, the upward trend began, which lasted until the end of March 2021, representing an increase of 43%. Another observed point was the recovery interval for urea prices, in the first cycle starting in March 2020 and reaching the same price levels at the end of July, i.e., 21 weeks. Comparatively, in March 2021, this interval was 11 weeks, which may indicate more restricted raw material supplies (Figure 7).
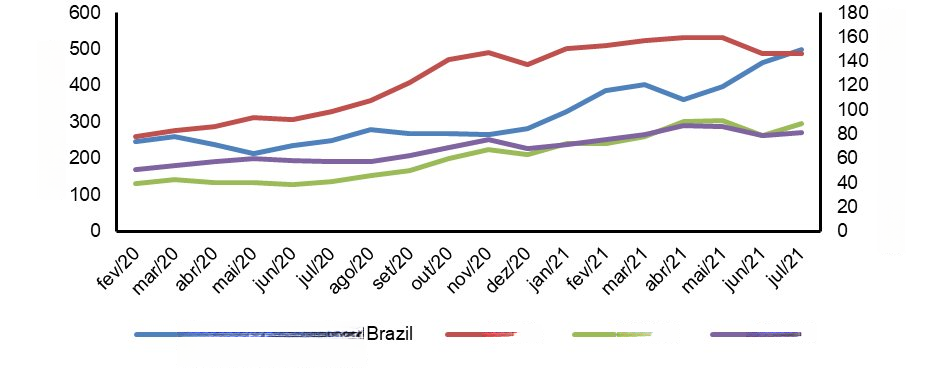
Figure 7. Nitrogen and commodities values, from February 2020 to July 2021
Source: Argus (2021)[16]
For the Phosphorus market, represented by (MAP), an average (CFR) of USD 321 was observed at the beginning of February, but with the increase in restrictions imposed by the pandemic from June 2020 onwards, there were constant increases in all evaluated months. A close relationship was noted with grain prices, especially soybeans, which in the period from June to November 2020, appreciated by 60%. From the same month until March 2021, MAP (CFR) saw an increase in international prices of around 68% (Figure 8).
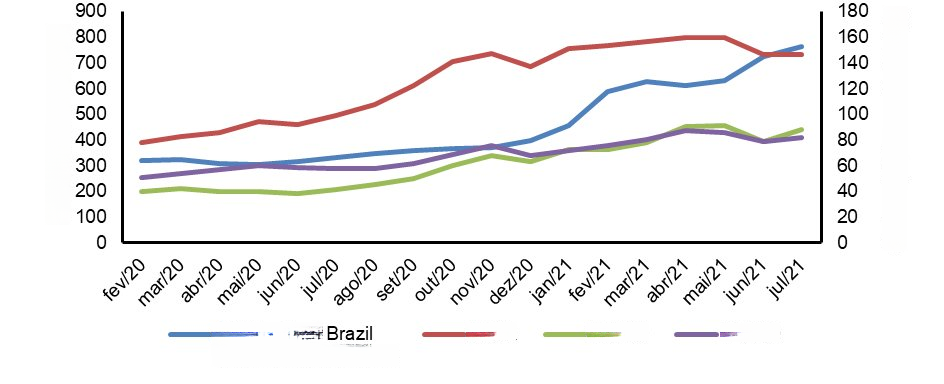
Figure 8. Phosphate and commodity values, from February 2020 to July 2021
Source: Argus (2021)[16]
It was observed in the period from February to December 2021 as stable with up to a 10% drop, similar to May 2020, in the potassium market. Therefore, in November and December 2020, and after reaching historical price records for soybeans, corn, and wheat, it showed a similar movement in (MOP). Restrictive actions adopted by the European Union on products from Belarus, including KCl, were the main driver of the market price increase[19]. From February to July 2021, there was an accumulated increase of 125% (Figure 9).
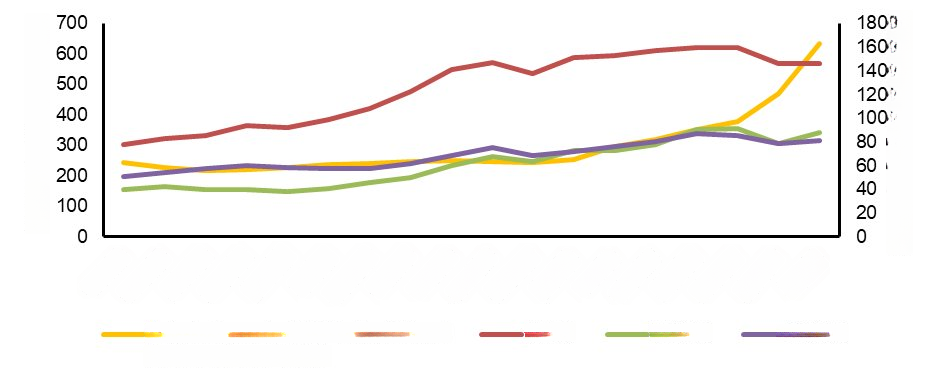
Figure 9. Potassium and commodities values, from February 2020 to July 2021
Source: Argus (2021)[16]
After analyzing the proposed variables, which influenced the grain market, the effects of fertilizers on the total cost of soybean production were illustrated (Figure 10). To aid in interpretation, the behavior of the exchange rate during the same evaluated period was also presented. Furthermore, the 19/20 harvest was considered as the period prior to the pandemic.
In 2019, NPK fertilizers represented on average 16% of the total cost of soybeans in the state of Paraná. Influenced by the increase in soybean prices in the domestic market, fertilizers reduced their participation in the total cost to approximately 15% in 2020. This period was marked by the devaluation of the real against the dollar, which reached almost 31%, ensuring an increase in revenue for producers. Finally, by July 30, 2021, the costs of macronutrients accounted for practically 18% of the total soybean crop[5],[6],[7],[8]. There was also an increase in the exchange rate, considering the average between February and the end of July 2021. As a result, the market anticipated purchases as a protective measure against the adverse environment, with soybeans being the crop that most represented this movement of anticipation in fertilizer acquisitions. Given the market events, there is a tendency for an increase in soybean production costs, which can be related to fertilizer costs (Figure 10).
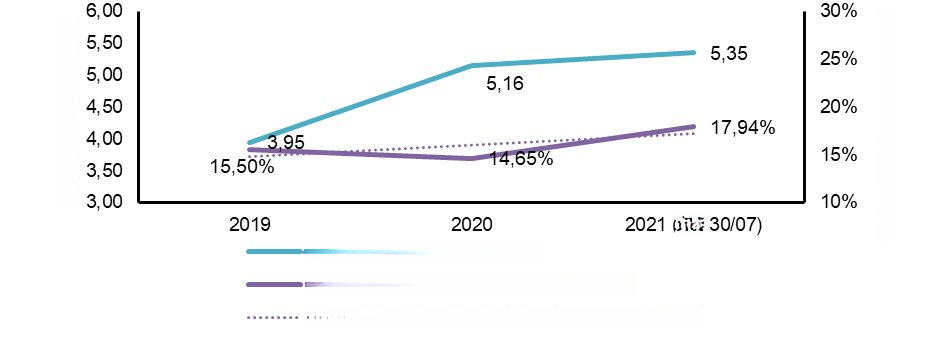
Figure 10. Representativeness of NPK cost on the total cost of soybean production compared to the annual average exchange rate, period from 2019 to July 2021
Source: Argus (2021)[16]; CONAB (2021)[5],[6],[7],[8]
Regarding the analysis of the relevance of fertilizers in relation to the total costs of the second-crop corn cultivation, an increase of more than 19% was observed before the pandemic period. The cereal benefited from the sudden increase in quotations, largely due to the rise of the dollar [5],[6],[7],[8], which caused the participation of fertilizers to fall to about 18%. However, in the 2021 harvest, it increased, reaching practically 26% (Figure 11), meaning a growth of more than 35% in the participation of fertilizers in the total cost of second-crop corn, compared to the 2019 harvest. Cardoso et al.[20] presented a study with a 44% reduction in the productivity of second-crop corn cultivated in Londrina – PR, due to delayed sowing, which resulted in less solar radiation, temperature, and water availability. Understanding the climatic risks and the trend of increasing costs of the main input for this crop requires greater cost control, planning for fertilizer purchase, and sowing time.
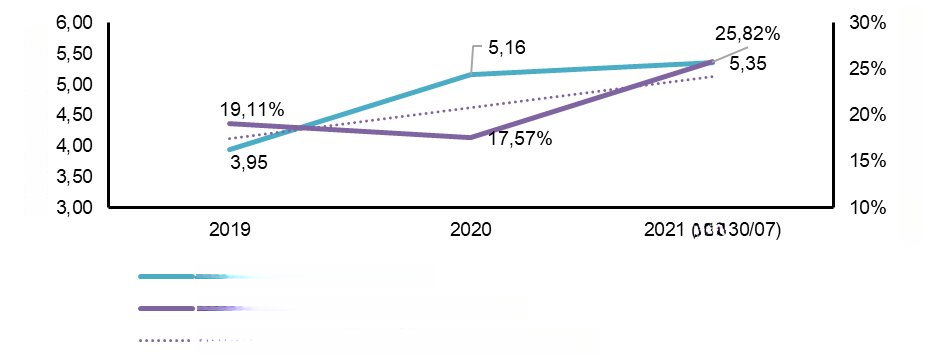
Figure 11. Representativeness of NPK cost on the total production cost of second-crop corn compared to the average annual exchange rate, period from 2019 to July 2021
Source: Argus (2021)[16]; CONAB (2021)[5],[6],[7],[8]
Finally, the costs of NPK for wheat cultivation and its importance in the total cost for Paraná producers in the 2021 harvest were evaluated, according to CONAB data[5],[6],[7],[8]. In 2019, before COVID-19, fertilizers represented a little less than 20% of the total cost of cultivation, while in the following year, this number fell to about 18%, a movement similarly observed in other evaluated crops. However, it stood out negatively due to the increase to over 26% of the total cost of wheat, an increase of more than 33% compared to 2019 (Figure 12). This result indicated that the purchase moments after the soybean and corn harvest influenced the supply and demand of fertilizers in the second quarter of 2021, transferring a higher cost of fertilizers to wheat cultivation. In this sense, monitoring the fertilizer market plays an important role in choosing the best time to buy.
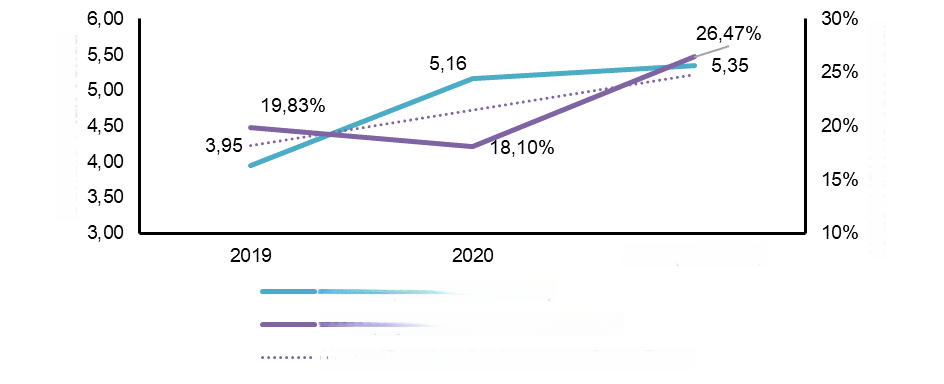
Figure 12. Representativeness of NPK cost on the total production cost of wheat compared to the annual average exchange rate, period from 2019 to July 2021
Source: Argus (2021)[16]; CONAB (2021)[5],[6],[7],[8]
The COVID-19 pandemic and its developments were responsible for diverse effects, direct and indirect, on the supply of the NPK raw materials evaluated. The exchange rate devaluation observed from February 2020 onwards was decisive for the growth in fertilizer demand. Concurrently, the restricted supply of natural gas, essential in the production chains of nitrogenous, some phosphatic, and potassic fertilizers, was directly and indirectly responsible for the rise in costs in producing countries. The same effect occurred in food demand, which resulted in the stimulus for grain production.
The relevance of fertilizers in the total production cost may increase while governmental efforts to stimulate national production do not begin to yield results. Thus, in wheat cultivation, followed by second-crop corn, these were the ones that showed the largest increases in the participation of fertilizers in the total cost due to lower market prices and later purchase times compared to soybeans. These crops are the most impacted due to the volume of fertilizers applied, which requires better efficiency and planning of production costs. Due to complex scenarios involving the raw materials market with developments and new events, the importance of monitoring information was reinforced in order to achieve greater assertiveness in decision-making. Through the indicators, it was possible to observe that the negative effects of the pandemic should remain for at least one year, making it possible to interpret that the impacts on the food supply and demand chain, and in turn on fertilizers, have created long-term repercussions. This fact reflected in higher fertilizer costs than observed in 2019, i.e., before the pandemic.
References
[1] Schneider S.; Cassol A.; Leonardi A.; Marinho M.M. Os efeitos da pandemia da Covid-19 sobre o agronegócio e a alimentação. Estud. av. 2020; 34(100). <https://doi.org/10.1590/s0103-4014.2020.34100.011>.
[2] Wilson, J. 2020. The economic impact of coronavirus: analysis from Imperial experts, Imperial College of London, 2020. Disponível em: <https://www.imperial.ac.uk/news/196514/the-economic-impact-coronavirus-analysis-from/>.
[3] The World Bank Group. O impacto da COVID-19 no mercado de commodities é maior sobre os preços de energia; baixa demanda de petróleo provavelmente continuará além de 2021. 2020. Disponível em: <https://www.worldbank.org/pt/news/press-release/2020/10/22/impact-of-covid-19-on-commodity-markets-heaviest-on-energy-prices-lower-oil-demand-likely-to-persist-beyond-2021>.
[4] Soendergaard N.; Gilio L; Sá C.D; Jack M.S. Impactos da Covid-19 No agronegócio e o Papel do Brasil. Instituto de Ensino e Pesquisa (INSPER). 2020. Disponível em: <https://www.insper.edu.br/wp-content/uploads/2020/06/impactos-da-covid-19-no-agronegocio-e-o-papel-do-brasil-vf-a.pdf>.
[5] Companhia Nacional de Abastecimento (CONAB). Planilha de custos de produção. 2021. Disponível em: <https://www.conab.gov.br/info-agro/custos-de-producao/planilhas-de-custo-de-producao/itemlist/category/403-planilhas-de-custos-de-producao-culturas-de-inverno>.
[6] Companhia Nacional de Abastecimento (CONAB). Planilha de custos de produção. 2021. Disponível em: <https://www.conab.gov.br/info-agro/custos-de-producao/planilhas-de-custo-de-producao/item/download/36848_c03c19eb5a6b86a951a79db251fae18d>.
[7] Companhia Nacional de Abastecimento (CONAB). Série histórica do milho safrinha. 2021. Disponível em: <https://www.conab.gov.br/info-agro/custos-de-producao/planilhas-de-custo-de-producao/itemlist/category/414-planilhas-de-custos-de-producao-series-historicas?start=20>.
[8] Companhia Nacional de Abastecimento (CONAB). Perspectivas para a agropecuária. 2021. Disponível em: <https://www.conab.gov.br/institucional/publicacoes/perspectivas-para-a-agropecuaria/item/16668-perspectivas-para-a-agropecuaria-volume-9-safra-2021-2022-edicao-graos>.
[9] Associação Nacional para Difusão de Adubos (ANDA). O Uso de Fertilizantes Minerais e o Meio Ambiente. 2018. Disponível em: <http://anda.org.br/wp-content/uploads/2018/10/OUsodeFertilizantesMinerais.pdf>.
[10] Empresa Brasileira de Pesquisa Agropecuária (EMBRAPA). Árvore do conhecimento – milho. 2018. Disponível em: <https://www.agencia.cnptia.embrapa.br/gestor/milho/arvore/CONT000fya0krse02wx5ok0pvo4k3mp7ztkf.html#>.
[11] Centro de Estudos Avançados em Economia Aplicada (CEPEA). Custos Grãos. 2020. Disponível em: <https://www.cepea.esalq.usp.br/upload/revista/pdf/0691526001567691145.pdf>.
[12] Secretaria Da Agricultura e do Abastecimento (SEAB). Relatórios de Preços. 2021. Disponível em: <https://www.agricultura.pr.gov.br/deral/precos>.
[13] Banco Central do Brasil (BACEN). Cotações e boletins. 2021. Disponível em: <https://www.bcb.gov.br/estabilidadefinanceira/historicocotacoes>.
[14] Empresa de Pesquisa Energética (EPE). Estudo de Caso na Indústria de Fertilizantes Nitrogenados. 2019. Disponível em: <https://www.epe.gov.br/sites-pt/publicacoes-dados-abertos/publicacoes/Documents/EPE-DEA-IT-01-19%20-%20GN_Fertilizantes.pdf>.
[15] Empresa de Pesquisa Energética (EPE). Fatos relevantes da indústria do óleo & gás. 2021. Disponível em: <https://www.epe.gov.br/sites-pt/publicacoes-dados-abertos/publicacoes/PublicacoesArquivos/publicacao-410/topico-472/Fatos%20Relevantes%20da%20Ind%C3%BAstria%20do%20%C3%93leo%20e%20G%C3%A1s%20-%20Fevereiro_2021_2021.03.16.pdf>.
[16] Argus Media (ARGUS). Histórico de Preços CFR Brasil de Ureia, (MAP), (MOP) e Gás Natural. 2021. Disponível em: <https://www.argusmedia.com/pt>.
[17] Centro de Estudos Avançados em Economia Aplicada (CEPEA). Custos Grãos. 2019. Disponível em: <https://www.cepea.esalq.usp.br/upload/revista/pdf/0723193001600198255.pdf>.
[18] Instituto de Pesquisa Econômica Aplicada (IPEA). Visão Geral da Conjuntura. 2021. Disponível em: <https://www.ipea.gov.br/portal/images/stories/PDFs/conjuntura/210930_nota_33_visao_geral.pdf>.
[19] Osaki M. Alto preço de fertilizante desafia produtor. Centro de Estudos Avançados em Economia Aplicada (CEPEA). 2021.Disponível em: <https://cepea.esalq.usp.br/br/opiniao-cepea/alto-preco-de-fertilizante-desafia-produtor.aspx>.
[20] Cardoso, C.A; De Faria, R. T; Folegatti, M. V. 2004. Simulação do rendimento e riscos climáticos para o milho safrinha em Londrina – PR, utilizando o modelo CERES-Maize. Disponível em: <https://doi.org/10.1590/S0100-69162004000200007>.
Como citar
Erthal K.T.; Mota E.P. Tendências mercadológicas no segmento de fertilizantes na produção de grãos. Revista E&S. 2022; 3: e20220020.
Sobre os autores
Kessler Teixeira Erthal, Especialista em Agronegócios pela Escola Superior de Agricultura “Luiz de Queiroz” – Universidade de São Paulo (USP), Piracicaba, SP, Brasil
Edson Pereira da Mota, Doutor em Ciências (Solos e Nutrição de Plantas) pela Escola Superior de Agricultura “Luiz de Queiroz” (ESALQ/USP), Professor da Faculdade de Ensino Superior Santa Bárbara (FAESB), Tatuí, SP, Brasil
Editorado por: Revista E&S
Link para download: https://cms.revistaes.com.br/wp-content/uploads/2022/02/20.pdf