
Economy, Investments And Banking
August 17, 2026
Return, Volatility, and Impact of Interest Rates on Aggressive Investments: a Brazil-USA Comparison
Caroline Schwaizer Silveira; Mariane Pires Batista
DOI: 10.22167/2675-6528-202601574
Article derived from a Final Course Work (TCC), with content based on the student’s original work and adapted to the editorial format of the E&S Magazine with the support of the ResumeAI tool, an artificial intelligence solution developed by Instituto Pecege for textual synthesis and organization.
Abstract
The macroeconomic environment plays a central role in determining the performance of variable income assets, especially in contexts of intense monetary cycles. The present study aimed to compare the performance of assets with similar characteristics that represent variable income in the Brazilian and North American markets between 2015 and 2025, identifying risk-return differences and the impact of interest rates on asset performance. The research was conducted as a case study with a comparative quantitative approach, using secondary data from financial markets. The Ibovespa and S&P 500, representing the stock market, and the IFIX and VNQ, representing real estate investment funds, were analyzed through base-100 normalization, average annual return, volatility, Sharpe Ratio, and correlation with the basic interest rates of each country. The results indicated that the stock markets delivered similar cumulative returns in the period, but through distinct trajectories, with the Brazilian market showing higher volatility and sensitivity to macroeconomic events. In real estate investment funds, the contrast was significant: the IFIX largely outperformed the VNQ, a result attributed to local institutional characteristics, such as inflationary adjustment of contracts and tax exemption for individual investors, more than to the macroeconomic environment. Correlation analysis indicated that monetary policy influences the returns of variable income assets, but does not determine them in isolation, with multiple macroeconomic and structural factors acting jointly. The findings contribute to the understanding of structural differences between emerging and developed markets in the context of bold investments.
Keywords: Macroeconomic scenario; Asset performance; Real estate funds; Equities; Risk-return.
1. Introduction
Investing is a fundamental process in the global economy, involving the allocation of financial resources in the present with the expectation of obtaining future returns. This practice is characterized by different time horizons and risk levels, which are intrinsically linked to the investor’s profile and tolerance. Investment options are vast, ranging from productive ventures and investment funds to public securities and stocks, reflecting the diversity of instruments available in the financial market (Cardozo et al., 2019).
Global financial markets, in turn, present inherent complexity, offering a diverse range of investment options. The risk and return characteristics of these applications vary significantly, influenced by both the type of asset and the economic condition of the country, whether it is an emerging or developed economy. Specialized literature points out that emerging markets, such as Brazil’s, tend to exhibit higher volatility compared to developed markets, such as the United States. Despite the potential for higher return premiums in emerging markets, high volatility often acts as a disincentive for capital allocation in stocks (Araújo et al., 2020).
For investors with a more aggressive profile, who possess in-depth knowledge of the financial market, adaptability, and crucially, high risk tolerance, the opportunities for allocating financial resources are broader and the potential return is significantly higher (Teixeira, 2023). In this context, investing in stocks is a common choice. Stocks represent ownership stakes in companies, granting investors the right to participate in profits and capital appreciation. In the United States, this type of asset is widely known as “stocks” (Bekaert et al., 2001).
Besides stocks, another investment modality that attracts bold investors are real estate funds, known as FIIs in Brazil and “Real Estate Investment Trusts” (REITs) in the United States. These instruments allow indirect investment in the real estate market, providing income from rents and the appreciation of underlying properties. Although FIIs and REITs are functionally equivalent in their proposal, studies indicate that they present relevant structural and regulatory differences, which reflect the particularities of their respective markets (Passos et al., 2025).
An element of extreme importance in investment analysis is the macroeconomic environment, with emphasis on the basic interest rates of each country. In Brazil, the Selic rate functions as the main monetary policy instrument, historically maintained at high levels to control inflation. The Selic directly impacts the return of fixed-income investments and adjusts the risk premium of variable-income investments (Central Bank of Brazil [BCB], 2026). In contrast, in the United States, the Federal Funds Rate (FFR) has historically operated at lower levels and with greater stability, contributing to lower perceived volatility in variable income (Federal Reserve Economic Data [FRED], 2026).
The difference between the basic interest rates of Brazil and the United States is crucial for understanding the distinct behavior of the markets in both countries over time. This distinction becomes even more evident during periods of intense monetary cycles, such as that observed between 2021 and 2023, when both nations implemented more restrictive monetary policies in response to high inflation in the post-pandemic period (International Monetary Fund [IMF], 2022). The analysis of these differentials is fundamental to understanding the risk and return dynamics in each context.
Despite the vast existing literature on financial market performance, there is still a significant gap in studies that directly compare the behavior of variable income assets between emerging and developed economies, considering risk and return metrics and the impact of interest rates. This gap was pointed out by Bekaert et al. (2023), who highlight the need for comprehensive comparative analyses in a globalized market scenario. Therefore, this work is justified by the need to deepen the understanding of the structural and behavioral differences of these markets, providing valuable information for investors with a higher risk tolerance.
Given this context, the present study proposes a comparative quantitative analysis between bold investments in Brazil and the United States, considering total return, historical volatility, and the impact of each economy’s interest rates. The objective is to compare the performance of assets with similar characteristics that represent variable income in the Brazilian and North American markets over the same historical period, identify risk-return differences, and analyze the impact of each economy’s interest rates, contributing to the understanding of different markets in investment with higher risk tolerance.
2. Material and Methods
The study was conducted as a comparative quantitative case study, aiming to analyze the performance of aggressive investments. This methodology is suitable for exploratory and descriptive investigations, which seek to understand phenomena in their real context and examine the relationships between economic and financial variables (Gil, 2017). The instrumental case study approach was employed to compare variable income investments between Brazil and the United States, contributing to the knowledge of a broader area (Yin, 2015).
The study focused on the analysis of secondary data from the financial markets of Brazil and the United States. The empirical focus was on assets with a bold profile, specifically stocks and real estate funds, in addition to the basic interest rates of each country. The analysis period covered the years 2015 to 2025, an interval selected for allowing the observation of various economic cycles and for being considered appropriate for calculating risk, return, volatility, and correlation metrics with interest rates.
The selection of assets for analysis was guided by market representativeness and trading history, essential criteria to ensure the sample’s relevance. For the Brazilian market, the Ibovespa index (IBOV), which represents the stocks of the most traded companies with broad sector coverage, and the IFIX index, considered the main indicator of real estate investment funds on B3 (B3, 2026), were included. These indices were chosen because they reflect the aggregate behavior of the national stock and real estate markets.
In the context of the United States, the S&P 500, a global benchmark index covering stocks from various sectors, and the Vanguard Real Estate ETF (VNQ) were selected. The VNQ was used to represent the North American Real Estate Investment Trusts (REITs) market, given the absence of an index directly equivalent to the IFIX, as noted by Ling and Naranjo (2015). The choice of VNQ was justified by its broad sector and geographic diversification, trading history exceeding twenty years, and net assets above US$30 billion (Vanguard, 2025).
Secondary data collection was carried out from public sources that provide historical series of prices and financial indices. For Brazilian assets, Ibovespa and IFIX prices were obtained from B3, while the evolution of the Selic rate was consulted at the Central Bank of Brazil. For North American assets, S&P 500 and REIT prices were extracted from the Investing.com website, and the Federal Funds Rate was accessed through the Federal Reserve Economic Data (FRED). Data processing and analysis were performed in Excel spreadsheets, and visualizations were generated with the aid of Microsoft Power BI.
For the data analysis, widely recognized financial metrics were employed. Initially, the indices were normalized to a base of 100, allowing for the comparison of the percentage performance of assets over time. In this approach, all indices were assigned the value of 100 at the beginning of the period, and subsequent variations indicated the accumulated percentage growth or decline, regardless of the asset’s original value (Bodie et al., 2015; Fabozzi, 2021). Subsequently, the average annual return was calculated by transforming historical prices into monthly periodic returns and using the geometric mean to obtain the compounded effective annual rate, according to the literature (Bodie et al., 2015).
The annual volatility was determined by the standard deviation of the monthly returns of the historical series, annualized by a factor of the square root of twelve, to represent the risk associated with return uncertainty. The sample standard deviation was used, considering the series as a representative sample of the future behavior of the assets (Bodie et al., 2015). Additionally, a risk-return analysis was performed, which correlates the average annual return of each asset with its annual volatility. This approach allowed for the evaluation of the trade-off between risk and return, being visualized through scatter plots, where each point represented the annual performance of an asset in relation to its risk (Bodie et al., 2015).
The Sharpe Ratio was calculated to relate the asset’s excess return to the assumed risk, being the ratio between the risk premium (average asset return above the risk-free rate) and its volatility. The risk-free rate was defined by the average interest rate of each country in the analyzed period, ensuring temporal consistency (Bodie et al., 2015). Finally, the correlation with interest rates was evaluated, calculating the annual Pearson linear correlation, based on twelve months of data, to verify the degree and direction of the association between the monthly variation of interest rates and asset returns (Gujarati and Porter, 2011). The metrics were calculated on a monthly basis and the results presented annually.
3. Results and Discussion
The period from 2015 to 2025 was marked by distinct economic cycles of high magnitude in the Brazilian and North American markets, which requires contextualizing the results in light of the main macroeconomic events. In Brazil, the 2015-2016 recession, driven by a fiscal crisis, sovereign rating downgrade, and impeachment process, generated a strong contraction in the stock market, followed by a gradual recovery between 2017 and 2019 (IMF, 2020; Barbosa Filho, 2017). In contrast, the United States experienced sustained economic expansion in the same period, supported by accommodative monetary policy and the robust performance of the technology sector (FRED, 2026; Bekaert et al., 2001).
In 2020, the COVID-19 pandemic caused an abrupt and synchronized shock, resulting in significant drops in all analyzed markets, but it was followed by an equally rapid recovery, driven by fiscal and monetary stimulus (IMF, 2020; Alfaro et al., 2020). Between 2021 and 2023, high global inflation led central banks to aggressive interest rate hike cycles: the Federal Funds Rate (FFR) rose from 0.25% to 5.50%, and the Selic reached 13.75%, impacting the attractiveness of equities relative to fixed income (FRED, 2026; BCB, 2026; IMF, 2022). From 2024 onwards, gradual disinflation created room for interest rate cuts, rekindling interest in equities, especially in Brazil (IMF, 2024; BCB, 2026). This macroeconomic landscape is crucial for interpreting the following results. Evolution of Normalized Indices (base 100)
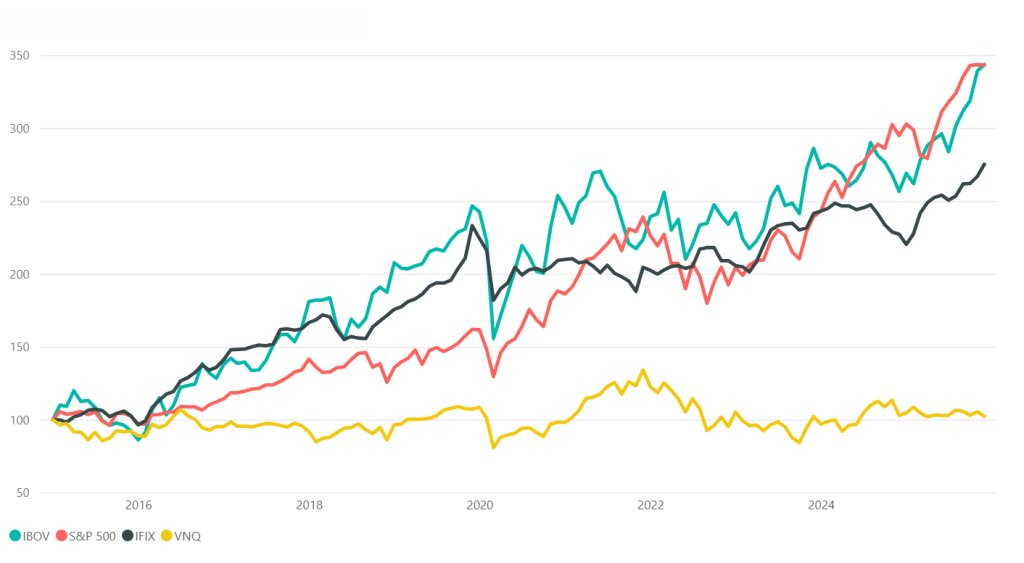
To understand the historical performance of assets and allow comparability between them, the analysis began with the normalization of data to a base of 100, covering the period from 2015 to 2025. This approach allows visualization of the accumulated percentage growth or decline, regardless of the asset’s original value, as proposed by Bodie et al. (2015) and Fabozzi (2021). Figure 1 illustrates the accumulated percentage evolution of the Ibovespa (IBOV), S&P 500, IFIX, and VNQ indices.
Figure 1 – Evolution of normalized indices (base 100) of stocks and real estate funds (2015-2025)
Source: Original survey data
In the equity segment, the Ibovespa and the S&P 500 ended the period at similar accumulated levels, reaching 343.5 and 343.1 points on a base of 100, respectively. However, this superficial equivalence hides a fundamental difference in their trajectories: the S&P 500 showed a relatively continuous evolution, with significant oscillations concentrated in the COVID-19 period, while the IBOV accumulated gains through more abrupt cycles and significant drops at various times. This divergence highlights the greater sensitivity of the Brazilian market to crises and macroeconomic events, in contrast to the stability of the North American market, attributed to the resilience of Big Techs and more stable monetary policies (IMF, 2020; Alfaro et al., 2020).
Real estate investment funds, represented by IFIX and VNQ, showed more moderate evolution and a more pronounced discrepancy between countries. IFIX exhibited continuous and moderately volatile appreciation, ending the period at 275 points, while VNQ remained close to 100, with limited growth and greater stability. VNQ’s trajectory is notable, as, after reaching its peak at the end of 2021, the index consistently declined until the end of 2023, returning a large portion of accumulated gains. This movement coincides with the FFR’s rate hike cycle, which began in 2022, making U.S. Treasury bonds more competitive and reallocating capital from REITs (Nareit, 2024).
Despite their similar proposal, IFIX and VNQ have distinct structural and regulatory characteristics. In Brazil, FIIs are predominantly focused on commercial and logistics real estate, with a predominantly local investor base. In the US, REITs present greater sectoral and geographic diversification, attracting international capital more expressively (Fabozzi, 2021; Passos et al., 2025; Bekaert et al., 2001). This difference in capital flows and investor composition contributes to the distinct behavior observed, with FIIs depending more on local investors and periods of high growth expectations or favorable macroeconomic adjustment (Bekaert et al., 2001; BCB, 2026). Analysis of Average Annual Return
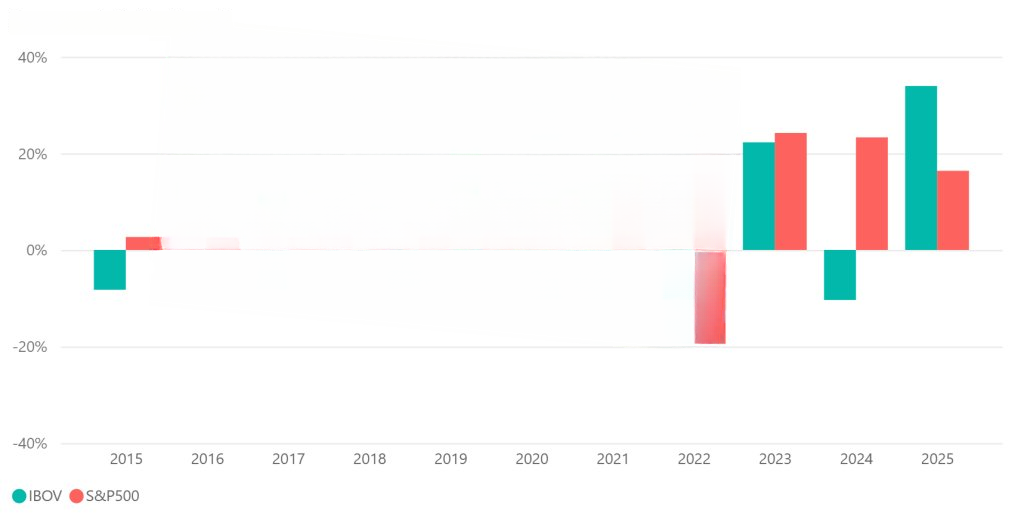
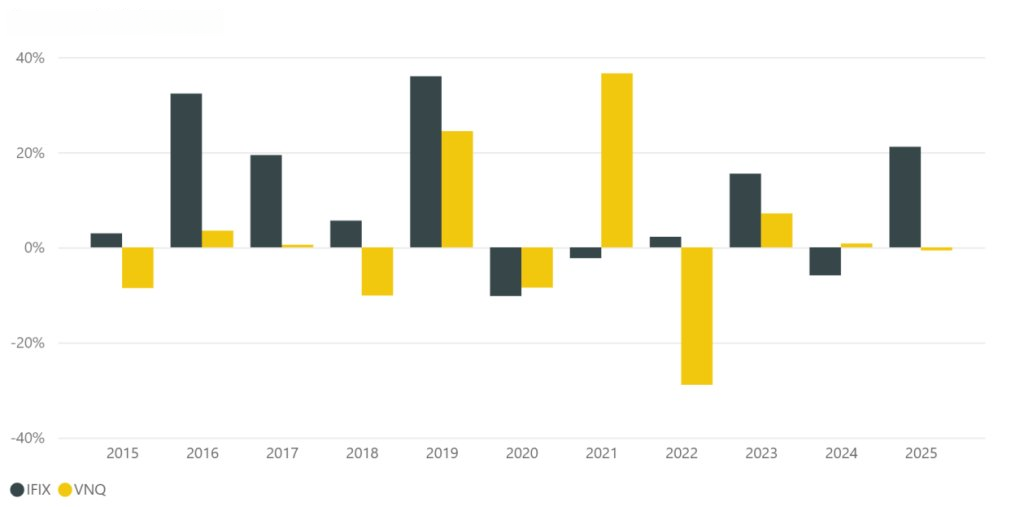
The average annual returns were calculated from historical prices, revealing the performance variations between the Brazilian and North American markets for stocks and real estate funds. These results are consistent with the movements identified in the base 100 analysis, reinforcing the cyclical behavior of the Brazilian market. Figures 2 and 3 illustrate these average annual returns, respectively, for stocks and real estate funds, highlighting the particularities of each country in response to specific events of the period.
Figure 2 – Average annual return of IBOV and S&P 500 assets (2015–2025)
Source: Original survey data
Figure 2 shows that the S&P 500 registered a negative return of -19.44% in 2022, reflecting the impact of restrictive monetary policy, with the aggressive increase of the FFR from 0.08% to 4.10% during the year, aiming to contain post-pandemic inflation. This movement primarily affected technology companies and interest-sensitive sectors (IMF, 2022). In contrast, the IBOV showed a significant appreciation of +33.95% in 2025, driven by a substantial inflow of foreign capital into the Brazilian market, totaling over R$ 25.5 billion in net flows (XP Investimentos, 2025).
Figure 3 – Average annual return of IFIX and VNQ assets (2015–2025)
Source: Original survey data
In the real estate investment fund segment, the IFIX showed positive returns in seven of the eleven years analyzed, with declines concentrated in 2020 and 2024, associated, respectively, with the pandemic shock and the domestic Selic high interest rate cycle. The VNQ, in turn, was the asset with the least consistent returns, registering a decline in five of the eleven years, with the worst result in 2022. The contrast between the two real estate funds is one of the most relevant findings of the study: assets of a similar nature, operating in the same period, produced accumulated returns of 175% for the IFIX and 2% for the VNQ, a difference that cannot be attributed exclusively to the macroeconomic environment, as the interest rate alone does not explain the observed divergence (Passos et al., 2025).
Dois fatores estruturais são mais determinantes para o desempenho superior do IFIX: os contratos de aluguel dos FIIs são corrigidos por inflação, o que preserva a receita real dos fundos, e os rendimentos distribuídos são isentos de imposto de renda para investidores pessoa física, criando uma demanda estrutural independente do ciclo de juros (Passos et al., 2025). Esse resultado desafia a percepção de que mercados mais maduros e regulados necessariamente entregam melhor desempenho, indicando que as características institucionais locais foram mais determinantes para o retorno do IFIX do que o próprio ambiente macroeconômico (Fabozzi, 2021; Passos et al., 2025). Análise da Volatilidade Média Anual
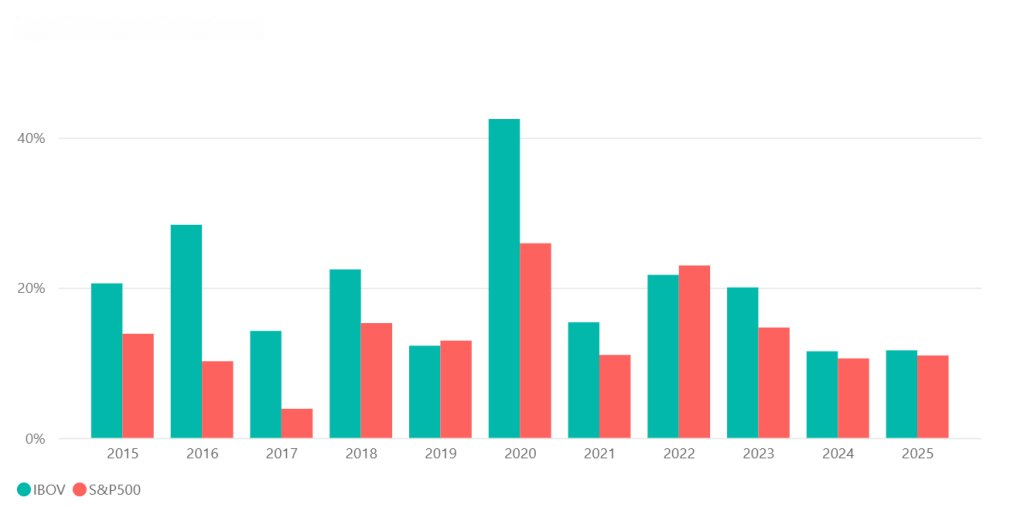
The average annual volatility reflects the risk associated with the assets and allows for the identification of variations in the analyzed markets, confirming previously observed patterns of instability. Figure 4 presents this metric for equity assets, while Figure 5 illustrates the results for real estate funds, allowing for a direct comparison between asset classes and markets.
Figure 4 – Average annual volatility of IBOV and S&P 500 assets (2015–2025)
Source: Original survey data
The results of Figure 4 highlight the high volatility of the IBOV, which led in practically all years, with extreme values concentrated in 2020. During the COVID-19 crisis, the IBOV reached over 40% annualized volatility, while the S&P 500 remained close to 26%. This behavior reflects the combination of the pandemic shock with the structural fragilities of the Brazilian market, resulting in strong risk aversion and high uncertainty in emerging markets (Alfaro et al., 2020).
Figure 5 – Average annual volatility of IFIX and VNQ assets (2015–2025)
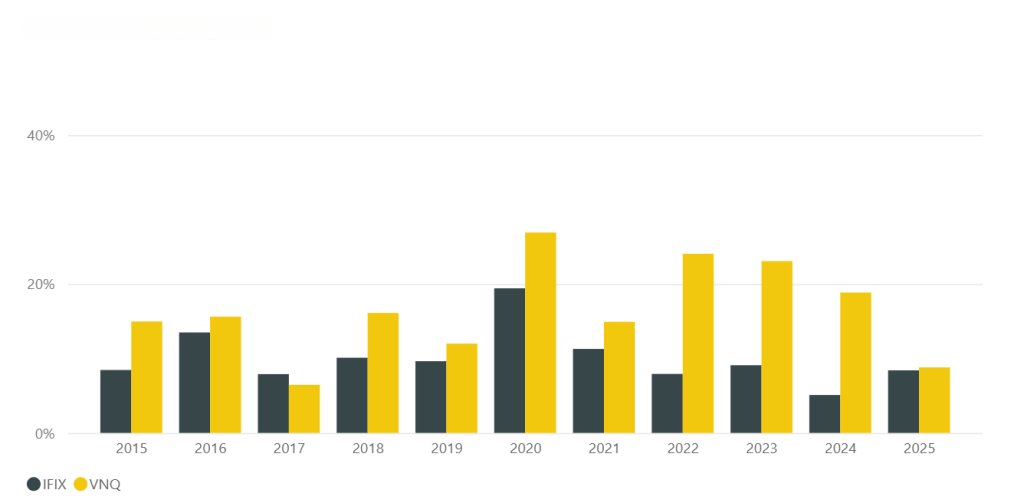
Source: Original survey data
Figures 4 and 5, presented on the same scale for ease of interpretation, highlight the greater instability of stocks compared to real estate funds. This phenomenon can be explained by the greater predictability of rental income in real estate funds, often with long-term contracts, in contrast to the volatility of corporate profits. This makes the IFIX less volatile than the IBOV, even in times of crisis. For REITs, geographical and sectoral diversification helped mitigate losses, although sectors such as hotels and shopping malls suffered significant impacts (Fabozzi, 2021). Risk-Return Analysis
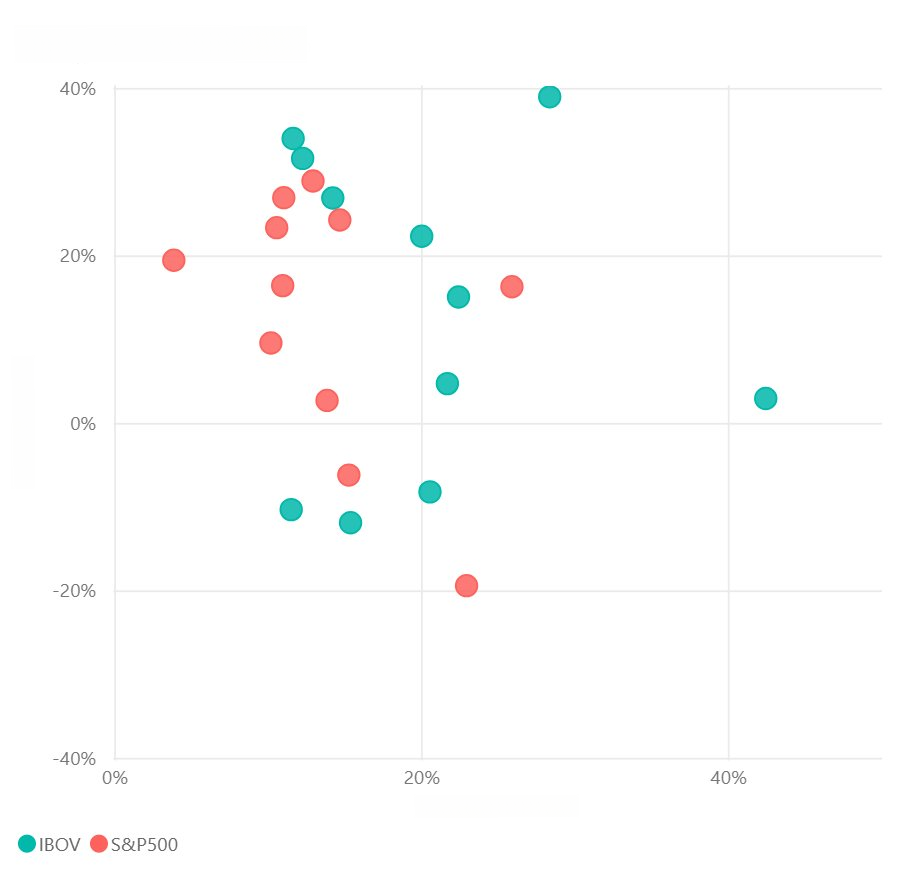
The risk-return analysis, which relates the average annual return of each asset to its annual volatility, offers a consolidated perspective on asset behavior in each period. This approach helps in identifying assets with higher risk-adjusted returns or with a more conservative profile (Bodie et al., 2015). Scatter plots were generated to visualize this metric, presented in Figures 6 and 7, for stocks and real estate investment funds, respectively.
Figure 6 – Risk-return relationship of IBOV and S&P 500 assets (2015–2025)
Source: Original survey data
The risk-return analysis reveals distinct profiles among the assets. The IBOV, as shown in Figure 6, presented the highest average annual return among all assets, but also the highest average volatility, a characteristic often associated with emerging markets. In these markets, macroeconomic events, foreign capital flows, and lower market depth amplify price oscillations, although they offer greater return potential (Bekaert et al., 2023). This high volatility profile demands investor discipline to remain positioned during times of uncertainty, as behavioral finance literature indicates that, in critical scenarios, many investors realize anticipated losses, compromising long-term returns (Kahneman, 2011; Alfaro et al., 2020).
Figure 7 – Risk-return relationship of IFIX and VNQ assets (2015–2025)
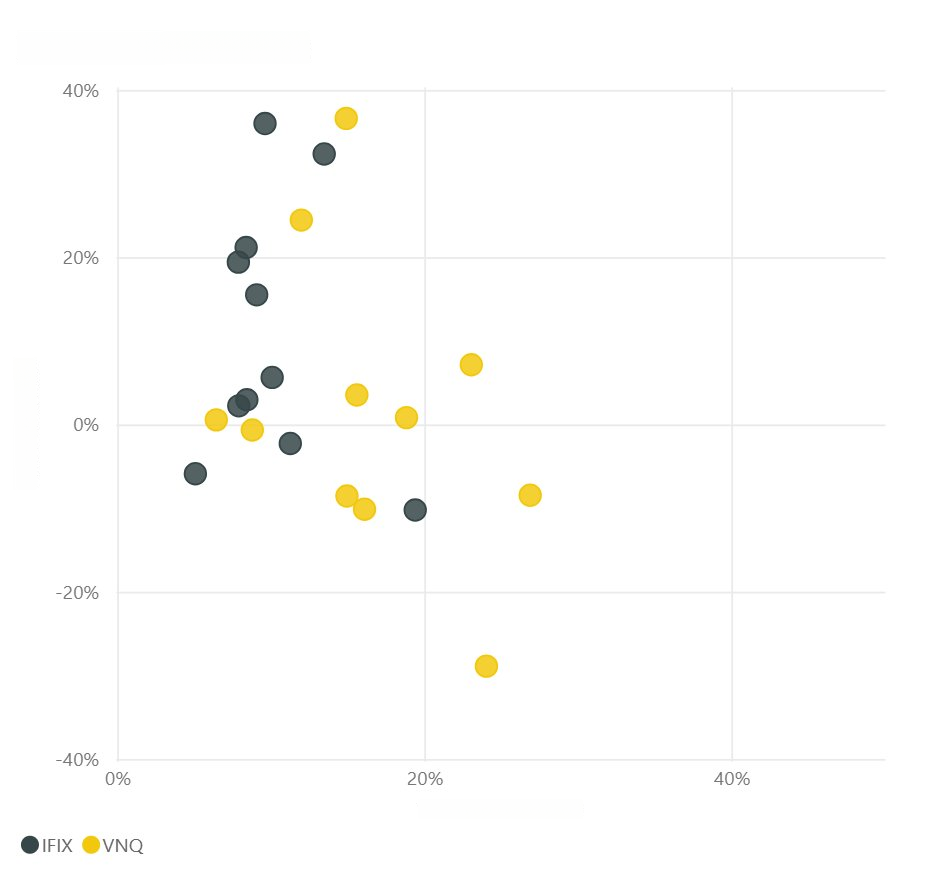
Source: Original survey data
The S&P 500, in turn, was predominantly concentrated in the low volatility quadrants, with high and predominantly positive average return values, as observed in Figure 6. The year 2022 was an exception, isolated in the high volatility and negative return quadrant, reinforcing its atypical character in the series. These results indicate a more stable risk-return profile for the United States stock market, associated with the high participation of institutional investors, greater market depth, and the sectoral breadth of the S&P 500 index (Bodie et al., 2015). However, the growing sectoral concentration of the S&P 500, with the ten largest companies representing more than 40% of the index in 2025 (Boston Trust Walden, 2025), suggests that part of the return and stability may not stem from diversification, but from the exceptional performance of a specific sector, increasing vulnerability to future shocks (Bodie et al., 2015; Bekaert et al., 2023).
The IFIX, as shown in Figure 7, stood out for presenting consistently low volatility, with all years below 20%, and high average return, although lower than that of stocks. This consistency, unusual for variable income assets, positions the IFIX prominently in the study’s risk-return relationship, making it attractive to investors seeking returns superior to fixed income without tolerating large fluctuations. In contrast, the VNQ demonstrated higher volatility and inconsistent returns, reflecting the exposure of certain REIT sectors (such as hotels and retail) to macroeconomic fluctuations, even in a more diversified and regulated market (Fabozzi, 2021). In aggregate terms, the Brazilian real estate investment fund presented a superior risk-return relationship to its North American equivalent in the analyzed period. Sharpe Ratio Analysis
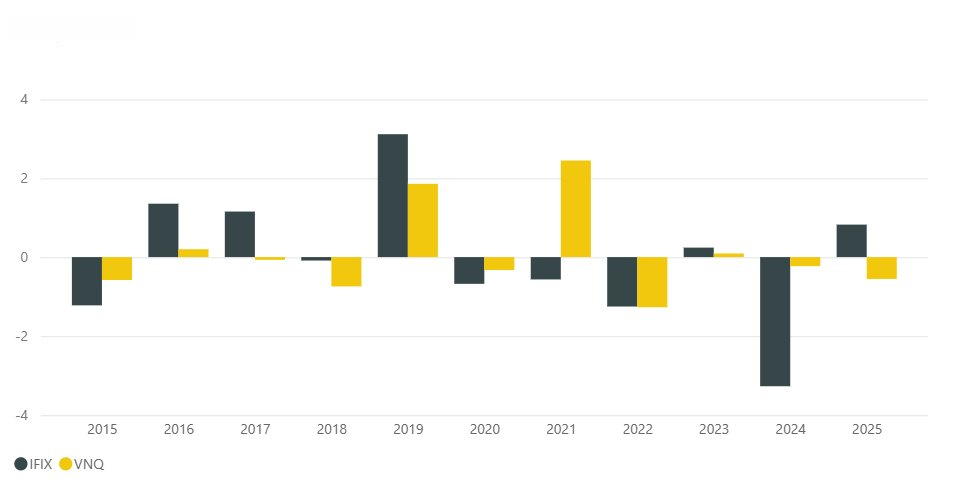
The Sharpe Ratio assesses the relationship between an asset’s excess return and the assumed risk, considering the risk-free rate of each country, allowing for the identification of years with better risk-adjusted performance (Bodie et al., 2015). To maintain consistency with previous analyses, the relationships are presented separately for stocks in Figure 8 and for real estate funds in Figure 9.
Figure 8 – Annual Sharpe ratio of IBOV and S&P 500 assets (2015–2025)
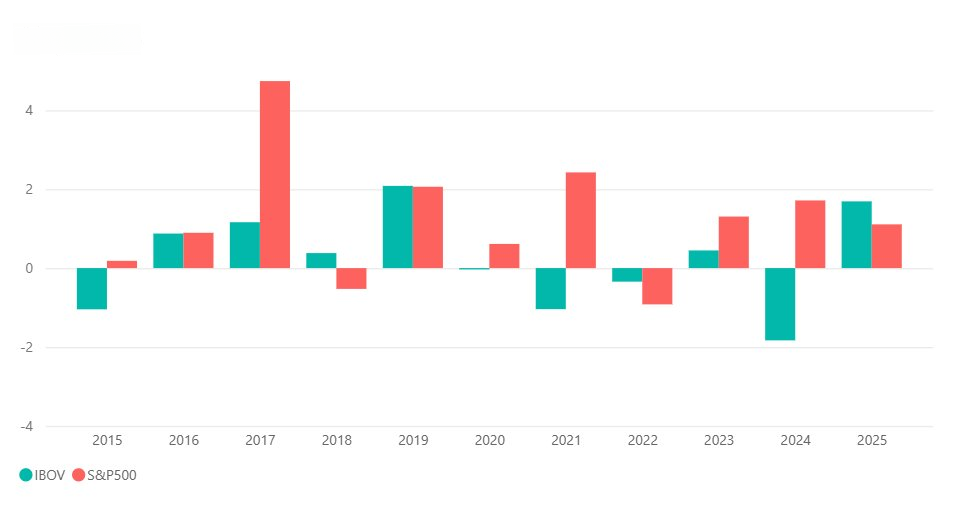
Source: Original survey data
Figure 8 shows that the IBOV presented more oscillations in the Sharpe Ratio than the S&P 500, with some negative years, indicating that the return was not satisfactory considering its volatility. The S&P 500, in turn, demonstrated a better risk-return trade-off, with higher and rarely negative Sharpe Ratios. The S&P 500’s results in 2017 and 2021 stand out, years in which the interest rate remained between 0% and 1%, and any positive return of the index represented a significant premium over the risk-free rate, a condition that the Brazilian market did not experience in the period.
Figure 9 – Annual Sharpe ratio of IFIX and VNQ assets (2015-2025)
Source: Original survey data
For real estate funds, a negative Sharpe Ratio is a relevant pattern, as illustrated in Figure 9, indicating that there is not always a return compensation for the risk assumed. This behavior can be explained by the low liquidity of FIIs and REITs in certain periods, by variations in rental contracts, and by the sectoral sensitivity of some segments (Fabozzi, 2021). The year 2024 is particularly illustrative for the IFIX: with a return of –5.89% and a high Selic rate, the asset delivered a Sharpe Ratio of -3.27, the worst in the series and the most negative among all assets in any analyzed year. This highlights that domestic interest rate hike cycles can strongly impact the index’s results, suggesting that, in 2024, investors would have obtained a superior return by simply holding capital in public bonds indexed to the Selic rate, without assuming market risk.
In contrast, 2019 was the best year for IFIX in terms of Sharpe Ratio, outperforming all other assets that year, which reinforces that the asset’s risk-adjusted performance is highly dependent on the Selic cycle (Fabozzi, 2021). This suggests that real estate funds, both Brazilian and American, perform better as an investment in low or falling interest rate cycles, and that maintaining a position in this class during rising interest rate cycles implies a relevant opportunity cost. This is an important practical conclusion for the aggressive investor to consider in their capital allocation. Correlation between Equities and Interest Rates
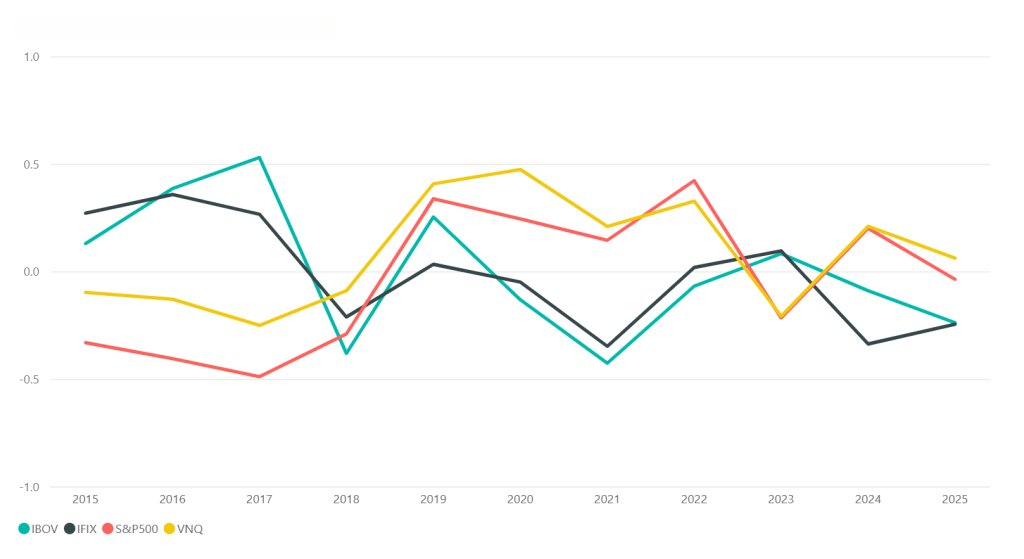
Finally, the annual correlation between asset returns and the variation in basic interest rates (Selic and FFR) was analyzed, allowing us to observe how changes in monetary policy can relate to the performance of major variable income assets in different markets. It is crucial to emphasize that, although Pearson’s correlation is widely used to identify linear associations, this metric does not imply direct causality (Gujarati and Porter, 2011). The results should be interpreted as indicative of statistical association. Figure 10 presents the obtained results.
Figure 10 – Evolution of the correlation between equity assets and real estate funds and the interest rate (2015-2025)
Source: Original survey data
Figure 10 reveals that, regardless of the asset class or country, the correlation between returns and interest rates behaves similarly, but not constantly over time. The sign of the correlations alternates between positive and negative for both countries, indicating that the impact of interest rates on equity markets occurs with moderate and variable intensity. This suggests that multiple macroeconomic factors, such as economic growth expectations, international capital flow, and global financial conditions, influence the outcomes (Bodie et al., 2015; Fabozzi, 2021).
An interesting finding is that the correlations rarely leave the range of -0.5 to 0.5, suggesting that, although there is an association between interest rate variations and asset returns, neither exhibits extreme sensitivity. This reinforces that, despite monetary policy influencing financial markets, other macroeconomic and structural factors play an important role in determining the profitability of equity assets. In other words, interest rates impact market behavior, but they are not sufficient to solely explain the returns observed in the analyzed assets.
Although the direction of the correlation is similar between IBOV and IFIX, the magnitude of the reaction differs. In interest rate hike cycles, IFIX tends to suffer sharper declines than IBOV, as observed in 2024, reflecting the greater sensitivity of real estate funds to the long-term interest rate curve and direct competition with fixed-income securities for individual investor capital (Fabozzi, 2021; Passos et al., 2025). IBOV, in turn, responds more to expectations of economic growth and corporate profit, variables influenced by the Selic, but not exclusively determined by it (Bodie et al., 2015).
The IBOV in 2016 and 2017 exemplifies this mechanism: the market prematurely priced the Selic rate cut cycle initiated in October 2016, showing a positive correlation with the rate and appreciating before any effective reduction. This behavior reflects the principle of rational anticipation in financial markets, where asset prices are driven by expectations about the future path of interest rates, not just the current level (Bodie et al., 2015). A similar pattern was observed in the US in 2023, when the S&P 500 significantly appreciated in the second half of the year, even with the FFR still at high levels, anticipating the cuts that the Fed would announce (FRED, 2026).
In general, the results indicate that the relationship between interest rates and returns on variable income assets is dynamic and contextual. The sign and intensity of the correlation depend on what the interest rate variation signals about the future economic scenario, and not just on its direction. This reflects the complexity of the interaction between monetary policy, economic expectations, capital flows, and investor behavior. This conclusion converges with the findings of Bekaert et al. (2023) on the determinants of returns in globalized markets, reinforcing the idea that multiple factors act together to shape asset performance.
In summary, the research revealed that the Brazilian and North American stock markets delivered similar accumulated returns in the period from 2015 to 2025, but through distinct trajectories, with the Brazilian market exhibiting greater volatility and sensitivity to macroeconomic events. In real estate funds, the IFIX largely outperformed the VNQ, a result attributed to local institutional characteristics, such as inflationary adjustment of contracts and tax exemption for individual investors, which proved more determinant than the macroeconomic environment. Correlation analysis indicated that monetary policy influences the returns of variable income assets, but does not determine them in isolation, with multiple macroeconomic and structural factors acting jointly and dynamically.
4. Conclusion
This study sought to compare the performance of variable income assets in the Brazilian and North American markets between 2015 and 2025, identifying risk-return differences and the impact of interest rates. It was found that stock markets, represented by Ibovespa and S&P 500, delivered similar cumulative returns in the period, but through distinct trajectories, with the Brazilian market exhibiting greater volatility and sensitivity to macroeconomic events. In real estate funds, the contrast was notable: the IFIX largely outperformed the VNQ, a result attributed to local institutional characteristics, such as the inflationary adjustment of contracts and tax exemption for individual investors, which proved more decisive than the macroeconomic environment. Correlation analysis indicated that monetary policy influences the returns of variable income assets, but does not determine them in isolation, with multiple macroeconomic and structural factors acting jointly and dynamically. The findings contribute to the understanding of structural differences between emerging and developed markets in the context of bold investments, offering practical insights for capital allocation.
However, the study presents limitations that should be considered. The S&P 500 and VNQ series were obtained in US dollars, without adjustment for exchange rate variation, which requires caution in interpreting absolute return comparisons for Brazilian investors. Additionally, the comparison between IFIX and VNQ has structural asymmetry, as VNQ is an ETF with management costs, while IFIX is a pure index, which may underestimate the real return of an investment in REITs. From a methodological standpoint, Pearson correlation captures only linear relationships, restricting the analysis at inflection points of the monetary cycle, where the relationship between interest rates and assets tends to be non-linear. It is suggested for future studies to expand the analysis to other emerging markets, testing whether local institutional characteristics similar to those identified in IFIX explain superior performance. It is also recommended to apply non-linear econometric models to capture more accurately the relationship between interest rates and returns, and to investigate to what extent the growing sectoral concentration of indices like the S&P 500 affects the validity of traditional diversification and risk metrics.
Bibliographic References
Alfaro, L.; Chari, A.; Greenland, A.; Schott, P. 2020. Aggregate and firm-level stock returns during pandemics, in real time. National Bureau of Economic Research Working Paper 26950. Disponível em: https://www.nber.org/papers/w26950. Acesso em: mar. 2026.
Araújo, E.; Brito, R.D.; Sanvicente, A.Z. 2020. Long-term stock returns in Brazil: volatile equity returns for U.S.-like investors. International Journal of Finance & Economics.
B3 S.A. – Brasil, Bolsa, Balcão [B3]. 2026. Índices de ações e fundos imobiliários. Disponível em: https://www.b3.com.br/pt_br/. Acesso em: jan. 2026.
Banco Central do Brasil [BCB]. 2026. Séries históricas da taxa Selic. Disponível em: https://www.bcb.gov.br/controleinflacao/taxaselic. Acesso em: jan. 2026.
Barbosa Filho, F.H. 2017. A crise econômica de 2014/2017. Estudos Avançados.
Bekaert, G.; Harvey, C.R.; Lundblad, C. 2001. Emerging equity markets and economic development. Journal of Development Economics 66(2): 465-504.
Bekaert, G.; Harvey, C.R.; Mondino, T. 2023. Emerging equity markets in a globalized world. Emerging Markets Review.
Bodie, Z.; Kane, A.; Marcus, A.J. 2015. Investimentos. 10ed. AMGH, Porto Alegre, RS, Brasil.
Boston Trust Walden. 2025. The S&P 500 index: considerations for investors. Disponível em: https://www.bostontrustwalden.com/sp500-index-considerations/. Acesso em: mar. 2026.
Cardozo, T.T.M.; Modesto, N.L.P.; Magalhães, N.P.; Fonseca, R.V.S.; Policarpo, R.V.S. 2019. Análise do perfil de investidores brasileiros. In: Congresso Brasileiro de Engenharia de Produção, 9., 2019, Ponta Grossa, PR, Brasil. Anais… p. 1-10.
Fabozzi, F.J. 2021. Foundations of Financial Markets and Institutions. 5ed. Pearson, New York, NY, USA.
Federal Reserve Economic Data [FRED]. 2026. Federal funds rate. Disponível em: https://fred.stlouisfed.org/series/FEDFUNDS. Acesso em: jan. 2026.
Fundo Monetário Internacional [FMI]. 2020. World Economic Outlook: The Great Lockdown. Disponível em: https://www.imf.org/en/publications/weo/issues/2020/04/14/weo-april-2020. Acesso em: mar. 2026.
Fundo Monetário Internacional [FMI]. 2022. World Economic Outlook: Countering the Cost-of-Living Crisis. Disponível em: https://www.imf.org/en/publications/weo/issues/2022/10/11/world-economic-outlook-october-2022. Acesso em: mar. 2026.
Fundo Monetário Internacional [FMI]. 2024. World Economic Outlook: Steady but Slow — Resilience Amid Divergence. Disponível em: https://www.imf.org/en/publications/weo/issues/2024/04/16/world-economic-outlook-april-2024. Acesso em: mar. 2026.
Gil, A.C. 2017. Como Elaborar Projetos de Pesquisa. 6ed. Atlas, São Paulo, SP, Brasil.
Gujarati, D.N.; Porter, D.C. 2011. Econometria Básica. 5ed. AMGH, Porto Alegre, RS, Brasil.
Kahneman, D. 2011. Thinking, Fast and Slow. Farrar, Straus and Giroux, New York, NY, USA.
Ling, D.C.; Naranjo, A. 2015. Returns and information transmission dynamics in public and private real estate markets. Real Estate Economics 43(1): 163-208.
Nareit – National Association of Real Estate Investment Trusts. 2024. Fed rate cut bodes well for REITs. Disponível em: https://www.reit.com/news/articles/fed-rate-cut-bodes-well-for-reits. Acesso em: mar. 2026.
Passos, G.G.F.; Ribeiro, S.A.; Schmitz, E.A. 2025. Um estudo utilizando fatos estilizados na comparação entre FIIs e REITs. In: Encontro Brasileiro de Finanças, 25., 2025, São Paulo, SP, Brasil. Anais… Instituto de Ensino e Pesquisa, São Paulo, SP, Brasil. Disponível em: https://doity.com.br/anais/25ebfin/trabalho/438454. Acesso em: mar. 2026.
Teixeira, M.L.M. 2023. Perfil do Investidor Pessoa Física: Uma Análise sob a Perspectiva de Profissionais de Instituições Financeiras. Monografia em Ciências Contábeis. Universidade do Extremo Sul Catarinense, Criciúma, SC, Brasil. Disponível em: https://repositorio.unesc.net/handle/1/10248. Acesso em: fev. 2026.
Vanguard. 2025. Vanguard Real Estate ETF (VNQ): fund overview. Disponível em: https://investor.vanguard.com/investment-products/etfs/profile/vnq. Acesso em: fev. 2026.
XP Investimentos. 2025. Raio XP – Retrospectiva 2025: um ano muito positivo para as ações brasileiras. Disponível em: https://conteudos.xpi.com.br/estrategia-acoes/raio-xp-retrospectiva-2025-um-ano-muito-positivo-para-as-acoes-brasileiras/. Acesso em: mar. 2026.
Yin, R.K. 2015. Case Study Research: Design and Methods. 6ed. Sage, Thousand Oaks, CA, USA.
Article originating from the Course Conclusion Work of the Specialization in Economics, Investments and Banking of the MBA USP/Esalq
To learn more about the course, click here and access the MBX Academy platform