
Quality
January 20, 2026
Estimation of measurement uncertainties in bromatological analyses for quality control of animal feed
Author: Marco Aurélio dos Santos
DOI: 10.22167/2675-6528-2025050
E&S 2026, 7: e2025050
The animal nutrition market represents one of the fastest-growing sectors of agribusiness in recent years, driven by the increasing demand for formulated foods. Despite the notable growth of this economic segment, the competitive dynamics of the market require manufacturers to supply safe and high-quality products, in compliance with the established guarantee levels[1]. This compliance is verified through bromatological analyses performed on finished products and raw materials. To this end, it is essential that quality control laboratories operate competently, produce valid results, and ensure the reliability of measurements[2].
This guarantee is relevant, given that laboratory analytical results can be used to make decisions about releasing products for trade. A possible deficiency in the reliability of this data could lead to erroneous conclusions and approvals[3].
In this sense, quality control laboratories must demonstrate the reliability of their analytical results through method validation documented by the Brazilian Association of Technical Standards (ABNT) – International Organization for Standardization (ISO) 17025[2]. Furthermore, the standard establishes that testing laboratories perform measurement uncertainty estimates in their analyses, as well as the respective evaluations of their uncertainty contributors[2],[4].
Measurement uncertainty is a range of dispersion of values around a quantified result at an established confidence level, generally expressed in the form of standard deviation[5]. Its estimation around the measurand (quantity to be measured) involves a series of components, each estimated according to the type of associated distribution. Type A evaluation corresponds to uncertainty estimates of standard deviations obtained in intermediate precision studies, while Type B evaluation refers to uncertainties of standard deviations from external documents, such as calibration certificates, manuals, or literature reviews[6].
The estimation of measurement uncertainties provides greater reliability in the decision to release batches according to specification criteria. This reliability stems from the thorough investigation of the variability factors of the measurands, which enables the comparison of results between different laboratories and with standardized specifications[7].
The application of this parameter is well-established in the pharmaceutical and food industries, driven by the need to ensure robust product quality and compliance. However, there is a growing demand for research focused on the animal nutrition industry, with the aim of improving the implementation of this parameter in quality control laboratories. In this context, Molognoni et al.[6] highlighted the relevance of uncertainty in chemical analyses of feed composition to assess product specification compliance.
Given the above, the objective of this research was to estimate the measurement uncertainty intervals in bromatological analyses aimed at quality control of animal feed, focusing on crude protein, mineral matter, and ether extract.
The uncertainty estimation process was based on method validation, as repeatability and intermediate precision standard deviations were used for the calculation of the combined standard uncertainty[6]. Figure 1 presents the macroprocess of uncertainty estimation adopted for each assurance level analysis.
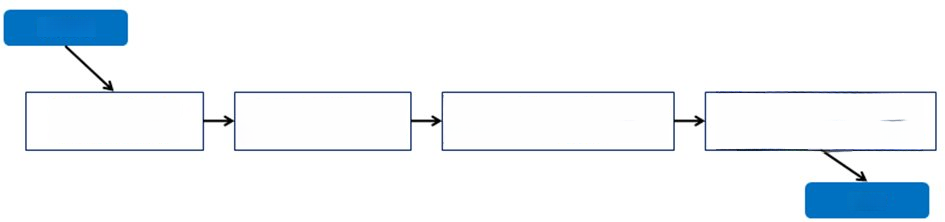
Source: Ellison et al.[8].
The first step consisted of the specification of the measurand, whose objective was to define the measured component and its relationship with the input quantities. This relationship corresponds to the algebraic expression that links the input quantities to the value of the measurand[8]. Subsequently, a structured analysis of the possible uncertainty contributions to the value of each measurand was carried out. The evaluation was conducted through a cause-and-effect diagram[8],[9].
After the diagram was elaborated, the third stage consisted of classifying each uncertainty component as type A or type B[10]. Type A evaluation involved the experimental determination of repeatability and intermediate precision standard deviations[11]. For this, each analyst performed serial analyses under repeatability conditions, and the change of analyst was adopted as a factor for intermediate precision in the intralaboratory study[12]. In turn, type B evaluation was based on standard uncertainty information from external sources, such as equipment manuals[7],[10],[13].
Bromological analyses
The bromatological analyses were carried out in the quality control laboratory of an animal feed industry, located in São Leopoldo, Rio Grande do Sul, Brazil. In this study, the measurement uncertainty was estimated for the crude protein, mineral matter, and ether extract assays.
Crude protein determination was based on the AOAC 968.06 method – crude protein in animal feed: Dumas method [14],[15]. Mineral matter was analyzed using the AOAC 942.05 method – animal feed ash[14],[16]. Ether extract analysis followed the AOAC 954.02 method – crude fat or ether extract in pet foods: gravimetric method[14],[17].
Samples
Samples of three marketed products were selected: a protein mineral supplement, a concentrated input for pigs, and a premium feed for adult cats. Crude protein analyses were performed on the protein mineral supplement, mineral matter analyses on the concentrated input for pigs, and ether extract analyses on the cat feed. All analytical results were expressed as a mass percentage on a natural basis. Additionally, the moisture content of the samples was determined by oven drying, according to the dry matter method[18].
To estimate the uncertainty of the crude protein analysis, samples from seven pallets of the same batch of protein mineral supplement were evaluated. The supplement, in a meal form, had the following composition: soybean meal, ground corn, wheat meal, livestock urea, calcitic limestone, dicalcium phosphate, and sodium chloride, with a minimum specification of 40% crude protein on a natural basis.
From each pallet, three subsamples of approximately 100 g (base, middle, and top) were collected with a sampler and packed in plastic bags with a hermetic seal. The 21 subsamples were identified according to the pallet number and collection height. In the laboratory, the three subsamples from each pallet were homogenized by rotational agitation in a closed container. Then, the samples were ground in a benchtop mill (IKA model A11) without sieving and transferred to 500 g jars, properly closed and identified, resulting in seven jars, one per pallet[19],[20].
Four analysts participated in the precision assay and performed eight crude protein determinations on each of the seven flasks. This generated 56 analyses per analyst[21].
To estimate the uncertainty of the mineral matter analysis, a 5 kg bag of concentrated feed for swine, ready for commercialization, was collected. The feed, in a meal form, was mainly composed of soybean meal, rice bran, bovine meat and bone meal, calcitic limestone, and sodium chloride, with a maximum specification of 25% mineral matter on a natural basis. Sample reduction occurred by quartering and was divided into four 500 g subsamples. The subsamples were homogenized by rotational agitation in a closed container, ground in a benchtop mill (IKA model A11) without sieving, and transferred to 500 g jars, properly closed and identified (Brazilian Compendium of Animal Feed, 2023d). Four analysts participated in the precision assay and performed seven determinations per jar[21].
To estimate the uncertainty of the ethereal extract analysis, a 10 kg bag of premium commercial adult cat food was collected. The food, in extruded form and with a minimum specification of 9% ethereal extract, was mainly composed of beef and bone meal, poultry and swine liver hydrolysate, ground corn, soybean meal, wheat bran, poultry oil, and sodium chloride. The sample was reduced by quartering and divided into four 500 g subsamples. The subsamples were homogenized by rotational agitation in a closed container, ground in a benchtop mill (IKA model A11) without sieving, and transferred to 500 g jars, duly closed and identified[20]. Three analysts participated in the precision assay and performed sixteen determinations per jar[21].
Statistical analyses
The data from the bromatological determinations underwent a series of statistical tests to ensure their quality and distribution. The Grubbs test identified the presence of outliers, while the Cochran test assessed the homogeneity of variances between the levels of the analyst factor[3]. The Shapiro-Wilk test verified the normality of the data distribution. To complement the statistical analysis, “boxplots” (box diagrams) were created to visualize and compare the results among the analysts. The statistical processing and obtaining of the results used the R computational program in conjunction with the RStudio interface (version 2025).
Quantification of Type A standard uncertainties
The one-way analysis of variance (ANOVA) was applied to estimate the standard deviations of repeatability and intermediate precision, evaluated through the one-way hierarchical design, with different analysts[22],[23]. The statistical processing occurred in the R computational program, in interface with RStudio, through the “agricolae” package, which generated the ANOVA table with the variance estimators. The results were compared (Table 1) and, elaborated based on the NBR 14597 standard[22].
Table 1. ANOVA for one factor of variability (different analysts)
| Factor | Degrees of freedom (v) | Mean of the sum of squares (Q) | Variance estimators (s2) |
| Analyst | vA = p – 1¹ | QMA⁴ | sA2 = (QMA – QMr) . (n-1)⁶ |
| Remaining | vr = p(n – 1)² | QMr⁵ | sr2 = QMr⁷ |
| Total | vT = (np) – 1³ |
Note. ¹vA: degrees of freedom for the analyst factor, p: number of levels (analysts); ²vr: degrees of freedom for the residual, n: number of measurements per level; ³vT: total degrees of freedom; ⁴QMA: mean square of the analyst factor; ⁵QMr: mean square of the residuals; ⁶sA2: estimate of the variance of the analyst factor contribution; ⁷sr2: estimate of the repeatability variance.
According to Table 1, the analyst factor (A) corresponds to the variation in results between analysts, and the residual factor (r) refers to the internal variation of results obtained by analyst. Therefore, the estimate of the standard deviation of repeatability was calculated according to Equation 1.

where, sr: is the estimate of the standard deviation of repeatability; QMr: is the mean of the sum of the residual squares[22].
The variance of the analyst factor contribution to variability was calculated according to Equation 2.

where, sA2: is the estimate of the variance of the analyst factor contribution; QMA: is the mean of the sum of squares of the analyst factor; QMr: is the mean of the sum of squares of the residuals; n: is the number of measurements made by analyst[22].
The estimate of the standard deviation of intermediate precision was calculated according to Equation 3.

where, sI(A): is the estimate of the standard deviation of intermediate precision (different analysts factor); sr2: is the estimate of the repeatability variance; sA2: is the estimate of the variance of the analyst factor contribution[22].
Combined and expanded standard uncertainty estimation
Estimates of standard uncertainties of repeatability, intermediate precision, and type B were calculated. Equation 4 presents the standard uncertainty of repeatability.

where, ur: is the standard uncertainty related to repeatability; sr: is the estimate of the standard deviation of repeatability; nr: is the number of replicates per analyst (Sales et al., 2023).
Equation 5 presents the standard uncertainty related to the standard deviation of the intermediate precision of a factor (different analysts).

where, uI(A): is the standard uncertainty referring to the intermediate precision of a factor (different analysts); sI(A): is the estimate of the standard deviation of the intermediate precision; nA: is the number of analysts[12].
Regarding type B estimates, only the crude protein analysis included standard uncertainties of this category, due to the need to consider uncertainty information described in the manuals of the two equipment used in the analysis (elemental nitrogen analyzer and analytical balance). Thus, the detection limit of 0.001mg of nitrogen indicated in the analyzer manufacturer’s manual was adopted as the type B standard uncertainty associated with nitrogen detection. In turn, the resolution of the four-digit analytical balance was used as the input value for the uncertainty estimate associated with sample weighing. Equation 6 presents the standard uncertainty related to the analytical balance resolution.

where, um,a: is the type B standard uncertainty related to sample weighing on an analytical balance; R: is the resolution of the four-digit analytical balance[8].
Type B standard uncertainties were not estimated for the other analyses, as they are gravimetric analyses, in which the measurands were obtained from the mass percentage difference.
As the standard uncertainties of type B measurement units are in milligrams and the result of the measurand is in mass percentage of protein, the corresponding sensitivity coefficients were calculated. Equation 7 presents the sensitivity coefficient of the nitrogen mass detected by the analyzer.

where, Cm,N: is the sensitivity coefficient of the detected nitrogen mass (% mg-1); dPB/dm,N: is the first derivative of the crude protein concentration as a function of the detected nitrogen mass (% mg-1); ma: is the average mass of sample weighed on the analytical balance (85.0 mg)[8].
Equation 8 presents the sensitivity coefficient of the mass of the sample weighed on a four-digit analytical balance.

where, Cm,a: is the sensitivity coefficient of sample mass (% mg-1); dPB/dm,a: is the first derivative of crude protein concentration as a function of sample mass (% mg-1); mN: is the average mass of nitrogen detected in the tested matrix (5.632 mg); ma: is the average mass of sample weighed on the analytical balance (85.0 mg)[8].
The combined standard uncertainty, expressed in standard deviation format, was calculated according to Equation 9.

where, uc(y): is the combined standard uncertainty; ur: is the standard uncertainty for repeatability; uI(A): is the standard uncertainty for intermediate precision; Ci,B: is the type B sensitivity coefficient in i; uB(xi): is the type B standard uncertainty in xi[8],[9].
The measurement uncertainty was expressed as expanded uncertainty, calculated according to Equation 10.

where, U: is the expanded uncertainty; uc(y): is the combined standard uncertainty; k: is the coverage factor, generally 2, which corresponds to a confidence level of approximately 95%[8].
The expanded uncertainty was also in terms of the general average of the results, according to Equation 11.

where, U%: is the expanded relative uncertainty; ӯ: is the general average of the results obtained by all analysts[8],[24].
The number of degrees of freedom was calculated for each standard uncertainty according to Equation 12.

where, ϑ: is the number of degrees of freedom; n: is the number of measurements[10].
To elaborate the balance charts of the uncertainty contributors, the relative standard uncertainties of each uncertainty component were calculated using Equation 13.

where, ui(%): is the relative standard uncertainty in i; Ci,B: is the B-type sensitivity coefficient in i (the numerical value is equal to 1.0 for type A standard uncertainties); ui: is the standard uncertainty in i; uc(y): is the combined standard uncertainty[8].
The ratio between the expanded uncertainty and the product specification limit (U/L) was calculated to verify if the laboratory analysis is adequate for the quantification of the assurance level (Equation 14).

where, U: is the expanded measurement uncertainty; L: is the product specification limit[25].
The application of the uncertainty estimation macroprocess in each bromatological analysis produced expanded measurement uncertainty results in standard deviation format. These values were compared with their means and specification limits to verify the quality of the results.
Crude protein – Dumas method
Crude protein, determined according to the official AOAC 968.06 method – crude protein in animal feed: Dumas method[14],[15], constitutes the measurand of this assay and was quantified in mass percentage concentration. The quantification calculation is expressed in Equation 15.

where, PB: is the mass percentage of crude protein contained in the sample (%); mN: is the mass of nitrogen detected by the Dumas elemental nitrogen analyzer (mg); ma: is the mass of sample weighed on an analytical balance with four digits (mg); 625%: is the conversion factor of 6.25 from nitrogen content to crude protein content, multiplied by 100%.
The elaboration of the cause-and-effect diagram (Figure 2) aided in the identification and understanding of the influence of uncertainty contributors on the measurand value[9].
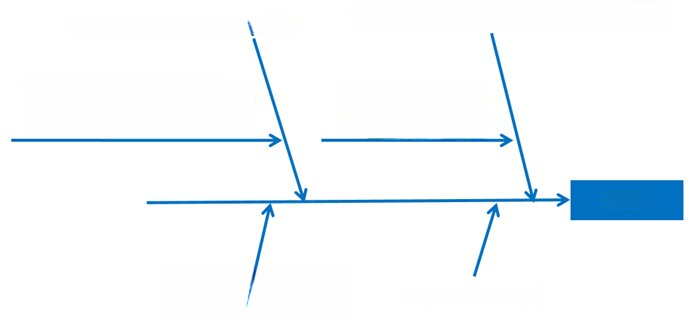
Source: Original research results.
Note. ¹CP (%): crude protein measurand, quantified in mass percentage concentration.
The measurement uncertainty of crude protein encompasses the contributors originating from the measurand equation (Equation 15) and the method validation contributors (Figure 2). As the intermediate precision and repeatability results were obtained by a precision study, based on the NBR 14597 standard, the evaluation is classified as type A. The other contributors are type B, as they were extracted from the manuals of the analytical balance and elemental analyzer manufacturers[10].
The experimental results of the determination in a sample of protein mineral supplement for cattle, whose specification guarantees a minimum content of 40% crude protein, are presented in Table 2.
Table 2. Crude protein content measurement results (%)
| Analysts | Analyst 1 | Analyst 2 | Analyst 3 | Analyst 4 |
| Number of replicates per analyst | 56 | 56 | 56 | 56 |
| Average (%) | 41,89 | 43,20 | 41,20 | 41,36 |
| Standard deviation (%) | 1,73 | 1,99 | 1,69 | 1,95 |
| Variance (%²) | 2,99 | 3,96 | 2,85 | 3,80 |
| Amplitude (%) | 7,41 | 7,36 | 8,23 | 10,52 |
| Median (%) | 42,00 | 42,64 | 41,32 | 41,19 |
224 crude protein analyses were performed, with a global average of (41.91 ± 1.99)% (Table 2). However, the Shapiro-Wilk test applied to this data indicated a statistically different distribution from normal, with p = 0.008224. Therefore, a possible anomaly in the results is observed.
The highest crude protein value was 47.63% and the lowest was 36.71%, resulting in an overall range of 10.92%. The Grubbs test did not reject the null hypothesis for both extreme values, with a 95% confidence level, p = 0.4302 (test for the highest value) and p = 0.9717 (test for the lowest value). Therefore, both values are not considered outliers with 95% confidence.
Furthermore, Analyst 2’s results showed the largest variance and the greatest distance between the mean and the median. Despite this, Cochran’s test indicated that Analyst 2’s maximum variance of 3.96%² is not extreme with 95% confidence (p = 0.6314). It is also observed that Analyst 4 obtained the second largest variance and the largest range among their results. Figure 3 shows the boxplot graph of the results from Table 2.
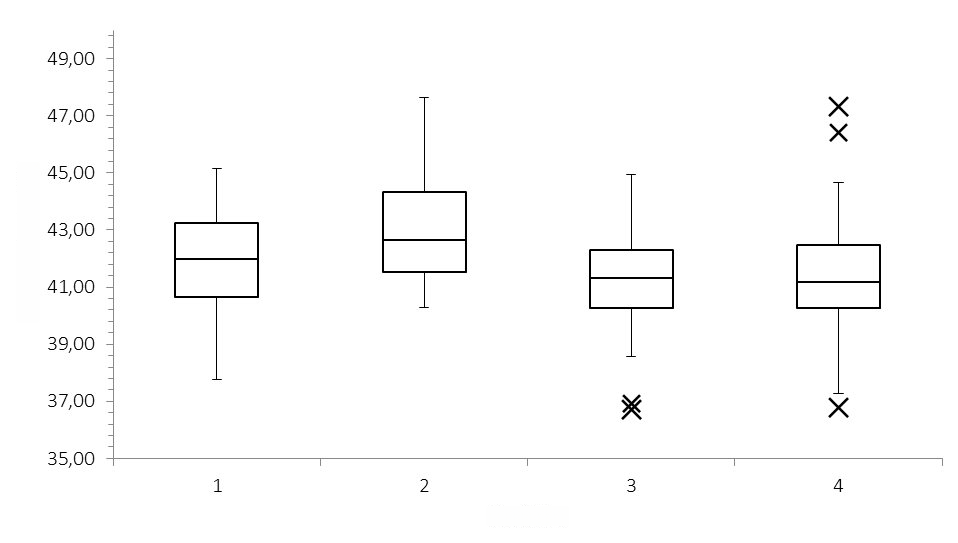
Source: Original research results.
Note. x – outlier values.
Although Grubbs’ test did not identify the presence of outliers, the plot (Figure 3) pointed out these values in the results sets of analysts 3 and 4. Furthermore, the greater variability of the results was evidenced by the larger interquartile range of Analyst 2. Other evidence suggests that the mean of Analyst 2’s results differs significantly from the other means, which may explain why the distribution does not exhibit normal behavior.
Although the graphical method indicated the presence of extreme values, they were kept in the ANOVA hypothesis test to highlight the influence of intermediate precision on the uncertainty estimation. Table 3 presents the analysis of variance of the crude protein results.
Table 3. ANOVA for crude protein results (%)
| Factor | Degrees of freedom | Mean of the sum of squares | Calculated ¹ | Critical zone² | p-value³ |
| Analyst | 3 | QMA = 46.34 ⁴ | 13,62 | 2,65 | 3.47 x 10⁻⁸ |
| Remaining | 220 | QMR = 3.40 ⁵ | |||
| Sum | 223 |
Note. ¹Fcalculated: value calculated by the test; ²Fcritical: critical reference value; ³P-value: statistical evidence of null hypothesis rejection; 4QMA: mean square of the analyst factor; ⁵QMr: mean square of the residuals.
The repeatability variance was 3.40%² (Table 3). By applying Equation 1, the repeatability standard deviation was estimated at 1.84%. The variance attributed to the Analyst factor was 0.77%² (Equation 2). Substituting these values into Equation 3 resulted in an intermediate precision standard deviation of 2.04%.
Furthermore, the calculated Fvalue being higher than the critical Fvalue demonstrates that the Analyst factor presented a significant contribution, indicating that the differences between the means were influenced by causes beyond random errors[22]. One of these causes may be associated with the difference between the mean of Analyst 2’s results and the others, as evidenced in Figure 3, since this mean was the furthest from the overall mean and presented a higher variance. Although the range of Analyst 4’s results was the highest, its mean was closer to the overall mean.
These variations may arise from deviations in the sample preparation procedure or in weighing, critical steps due to the fact that the protein-mineral supplement is composed of solid particles of livestock urea (source of total nitrogen). Inadequate execution of these phases compromises the proportional distribution of nitrogen in the sample volume and results in high variability in crude protein results. Thus, monitoring and training of analysts in these steps are suggested.
The substitution of the unknown ma by 85 mg (average of the weighed sample mass) in Equation 7 resulted in a nitrogen detection sensitivity coefficient of 7.35 % mg-1. The substitution of the unknown mN by 5.7 mg (average of the detected nitrogen mass in the 85 mg sample) in Equation 10 resulted in a sample mass sensitivity coefficient of -0.49 % mg-1. These coefficients were used for the conversion of units of type B standard uncertainties.
After obtaining the input values from each source of uncertainty, the standard uncertainties were calculated using Equations 8, 9, and 10. Table 4 presents the standard uncertainty results for each contributor, as well as their respective sensitivity coefficients.
Table 4. Standard uncertainty results for each uncertainty contributor
| Uncertainty contributor | Entry value | Standard uncertainty | Sensitivity coefficient | Degrees of freedom |
| Repeatability | 1,84 % | 0,25 % | 1 | 55 |
| Intermediate Precision | 2,04 % | 1,02 % | 1 | 3 |
| Nitrogen detection limit | 0.00 mg | 0.00 mg | 7.35% mg-1 | Infinity |
| Analytical balance resolution | 0.10 mg | 0.03 mg | -0.49 % mg-1 | Infinity |
Intermediate precision represented the largest contributor to uncertainty, as it presented the highest value among all contributors (Table 4). Based on Equation 13, the uncertainty balance histogram was elaborated (Figure 4).
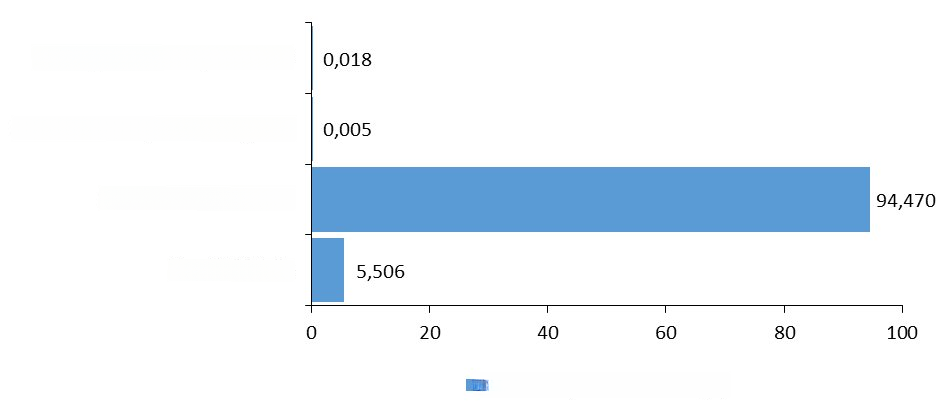
Source: Original research results.
The uncertainty regarding intermediate precision corresponds to 94.47% of the combined standard uncertainty, indicating that the Analyst factor exerts significant influence on the variability of the results (Table 4).
The substitution of the standard uncertainty values in Equation 9 resulted in a combined standard uncertainty of 1.05%. This value, multiplied by the coverage factor of k = 2 (Equation 10), produced an expanded standard uncertainty of ± 2.10%.
Therefore, the expression of the crude protein result in a protein mineral supplement for cattle, with measurement uncertainty, is as follows: crude protein = (Result ± 2.10) %. The reported uncertainty corresponds to an expanded uncertainty with a confidence level of approximately 95%. The uncertainty value, in relative terms, is 5.01% in relation to the overall average of the results, equal to 41.91% (Equation 11).
Molognoni et al.[6] estimated measurement uncertainty values in bromatological analyses of pig and poultry feed. The traditional approach (evaluation of all contributors to the measurand equation, bottom-up) and the approach based on an interlaboratory validation study (“top-down”) were applied. The average crude protein in pig feed was 33.5%, obtained from results of 86 laboratories, and the relative uncertainty values were 8.35% (“bottom-up”) and 11.04% (“top-down”), both in relation to the average. For poultry feed, the average crude protein was 23.6%, obtained from 83 laboratories, and the relative uncertainty values were 10.59% (“bottom-up”) and 8.05% (“top-down”).
The comparison between the means of crude protein content and the relative expanded uncertainties (traces) of each mentioned research (Figure 5).
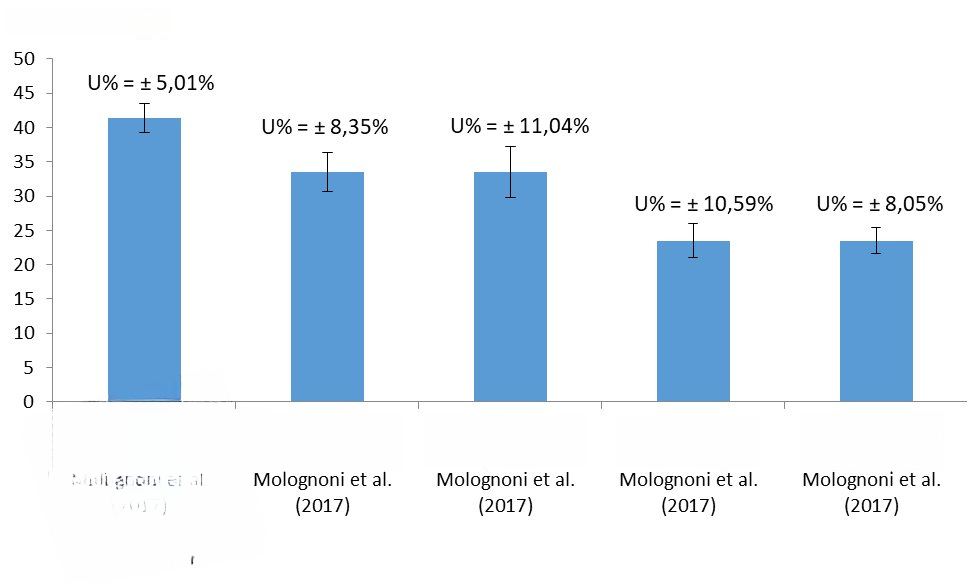
Source: Original survey results.
Note. U%: relative expanded standard uncertainty.
The uncertainty values obtained by Molognoni et al.[6] were the highest, even though the matrices showed greater homogeneity in relation to the protein supplement (Figure 5). This variation stems from the type of precision study performed, as more than 80 laboratories participated in Molognoni et al.’s study[6]; in contrast, this research was conducted in only one laboratory. Furthermore, the analytical methods differ between studies: Molognoni et al.[6] used the Kjeldahl method, which involves reagent preparation, digestion, and titration; the supplement, in turn, was analyzed by the Dumas method, a combustion method, which is less complex to perform than Kjeldahl, thus reducing the number of uncertainty contributors.
Mineral matter
The measurand for the quantification of inorganic residue obtained after sample calcination is mineral matter (MM) and its physical quantity was expressed as a mass percentage, according to official method AOAC 942.05 – animal feed ash[14],[16]. The calculation of this determination is expressed in Equation 16.

where, MM: is the percentage content of mineral matter contained in the sample (%); mf: is the mass of the crucible with the inorganic residue obtained after burning the sample (g); mi: is the mass of the empty crucible (in g); ma: is the mass of the sample weighed in the crucible (g).
After the specification of the measurand, the uncertainty contributions were identified through the cause-and-effect diagram (Figure 6).
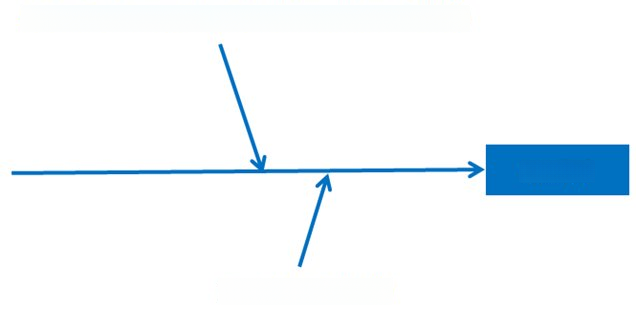
Source: Original research results.
Note. ¹MM (%): mineral matter measurand, quantified in mass percentage concentration.
Only the standard deviations of repeatability and intermediate precision were considered for the uncertainty calculation (Figure 6). In this study, type B uncertainty contributors in gravimetric analyses (mineral matter and ethereal extract) were not included. Table 5 presents the experimental results of mineral matter in concentrate input samples for pigs, whose specification guarantees a maximum content of 25%.
Table 5. Measurement results of mineral matter content (%)
| Descriptive measures by analyst | Analyst 1 | Analyst 2 | Analyst 3 | Analyst 4 |
| Number of replicates per analyst | 7 | 7 | 7 | 7 |
| Arithmetic mean (%) | 23,94 | 24,24 | 23,89 | 24,00 |
| Sample standard deviation (%) | 0,52 | 0,57 | 0,53 | 0,75 |
| Variance (%²) | 0,27 | 0,32 | 0,28 | 0,57 |
| Magnitude (%) | 1,58 | 1,83 | 1,80 | 2,19 |
| Median (%) | 24,02 | 24,21 | 23,85 | 24,02 |
28 mineral matter assays were performed (Table 5). The average of the measurements was (24.02 ± 0.58) %. The Shapiro-Wilk test indicated that the mineral matter data follow a normal distribution (p = 0.5631).
The highest result was 25.12% and the lowest, 22.52%, generating a range of 2.60%. For these values, the Grubbs test indicated that neither is an outlier with 95% confidence, with p = 0.7222 (test for the highest value) and p = 0.08501 (test for the lowest value).
Cochran’s test showed that the maximum variance of 0.57%², obtained by Analyst 4, is not extreme with 95% confidence, p = 0.5065. Figure 7 presents the boxplot graph of the results from Table 5.
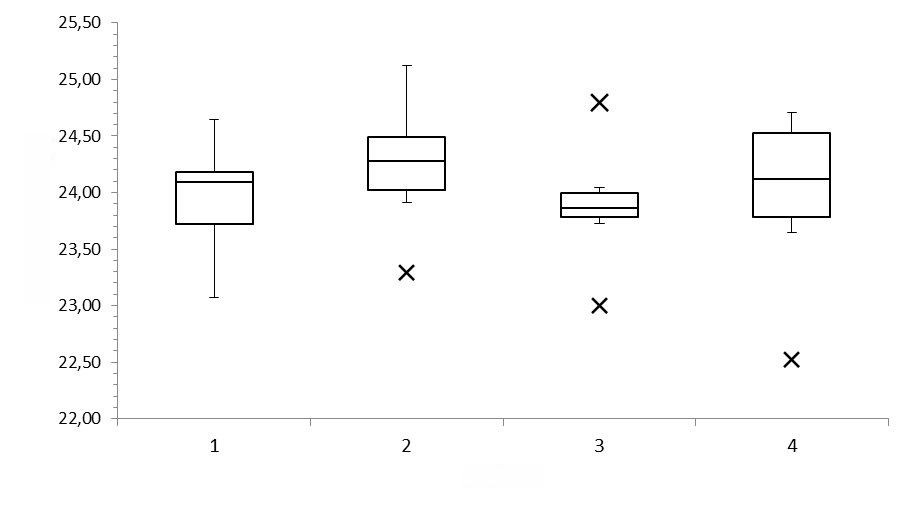
Source: Original research results.
Note. x – outlier values.
Although Grubbs’ test did not identify outliers, only the set of results from Analyst 1 showed no discrepancies (Figure 7). The interquartile range of Analyst 4’s results shows greater variability compared to the other sets. Table 6 shows the analysis of variance of all mineral matter results obtained by the four analysts.
Table 6. ANOVA table for mineral matter results (%)
| Factor | Degrees of freedom | Mean of the sum of squares | Calculated¹ | Fcritical² | p-value³ |
| Analyst | 3 | QMA = 0.1715 ⁴ | 0,4787 | 3,009 | 7.00 x 10⁻¹ |
| Remaining | 24 | QMR = 0.3583 ⁵ | |||
| Total | 27 |
Note: ¹Fcalculated: calculated value from the test; ²Fcritical: critical reference value; ³P-value: statistical evidence for rejecting the null hypothesis; 4QMA: mean square of the analyst factor; ⁵QMr: mean square of residuals.
The repeatability variance was 0.3583%², substituting this value into Equation 1 resulted in an estimate of 0.60% for the repeatability standard deviation (Table 6). The variance of the Analyst factor contribution was disregarded, since QMA < QMR. Thus, the intermediate precision standard deviation estimate was equal to the repeatability estimate. Table 7 summarizes the input values for the type A standard uncertainty estimates.
Table 7. Standard uncertainty results for each uncertainty contributor
| Uncertainty contributor | Entry value (%) | Standard uncertainty (%) | Degrees of freedom |
| Repeatability | 0,60 | 0,23 | 6 |
| Intermediate Precision | 0,60 | 0,30 | 3 |
The input value for the intermediate precision standard deviation estimate is equal to the repeatability, since the variance of the contribution of the Analyst factor was disregarded (Table 7). Figure 8 shows the uncertainty balance histogram, elaborated from Equation 13.
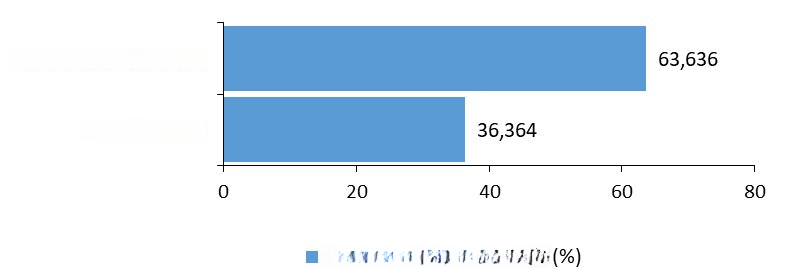
Source: Original research results.
The uncertainty associated with intermediate precision represents 63.65% of the combined standard uncertainty, while the uncertainty related to repeatability corresponds to 36.36% (Figure 8). The substitution of standard uncertainty values into Equation 9 resulted in a combined standard uncertainty of 0.38% and an expanded uncertainty of ±0.75% (Equation 10).
The expression of a mineral matter result in concentrate for swine, with measurement uncertainty, is as follows: mineral matter = (Result ± 0.75) %. The reported uncertainty corresponds to an expanded uncertainty with a confidence level of approximately 95%. The uncertainty value, in relative terms, is 3.12% in relation to the overall average of the results, equal to 24.02% (Equation 11).
According to Molognoni et al.[6], the average mineral matter in the feed for pigs was 15.60%, obtained from the results of 101 participating laboratories, and the relative uncertainty values were 1.99% (“bottom-up”) and 10.83% (“top-down”), both in relation to the average. The avian feed showed an average of 6.28%, obtained from 102 laboratories, and the relative uncertainty values were 2.07% (“bottom-up”) and 14.81% (“top-down”).
Figure 9 illustrates the comparison between the means of the mineral matter content of each cited research.
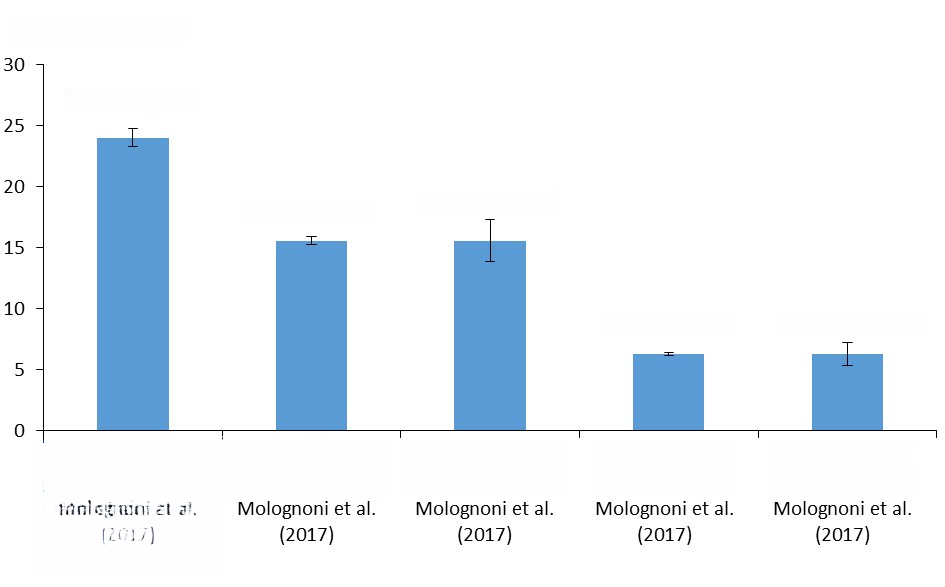
Source: Original survey results.
Note. U%: relative expanded standard uncertainty.
The relative uncertainties obtained by Molognoni et al.[6] using the “top-down” approach presented values greater than 10%, possibly arising from the variability of more than 100 participating laboratories.
Ether extract
The measurand for the quantification of fat extracted by hexane in a closed extractor block is the ethereal extract (EE), and its physical quantity was expressed as a mass percentage, according to the official method AOAC 954.02 – fat (gross) or ethereal extract in pet food: gravimetric method[14],[17]. The calculation of this determination is expressed in Equation 17.

where, EE: is the percentage content of ethereal extract contained in the sample (%); mf: is the mass of the extractor cup with the extracted fat (g); mi: is the mass of the empty extractor cup (in g); mH: is the mass of the sample to be analyzed (g).
After the measurand specification, the uncertainty contributions were identified through the cause-and-effect diagram (Figure 10).
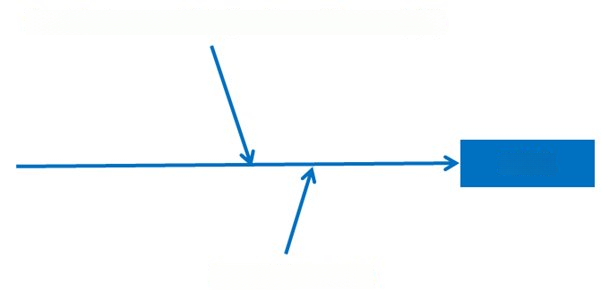
Source: Original research results
Note. ¹EE (%): measuring ethereal extract, quantified in percentage mass concentration.
Only the standard deviations of repeatability and intermediate precision were considered for the uncertainty calculation (Figure 10). Table 8 presents the experimental results of EE in cat food samples, whose specification guarantees a minimum content of 10%.
Table 8. Ether extract content measurement results (%)
| Descriptive measures by analyst | Analyst 1 | Analyst 2 | Analyst 3 |
| Number of replicates per analyst | 16 | 16 | 16 |
| Arithmetic mean (%) | 10,94 | 11,45 | 10,89 |
| Sample standard deviation (%) | 0,43 | 0,40 | 0,57 |
| Variance (%²) | 0,18 | 0,16 | 0,33 |
| Magnitude (%) | 1,63 | 1,28 | 1,68 |
| Median (%) | 10,92 | 11,59 | 10,95 |
48 ether extract trials were performed. The average of the measurements was (11.09 ± 0.53) %. The Shapiro-Wilk test indicated that the data follow a normal distribution, with p = 0.1904 (Table 8).
The largest result was 11.99% and the smallest 10.04%, with an amplitude of 1.95%. The Grubbs test indicated that neither are outliers with 95% confidence, with p = 1.0000 (for the largest and smallest value).
Cochran’s test indicated that the maximum variance of 0.33%², obtained by Analyst 3, is not extreme with 95% confidence, p = 0.1995. Figure 11 presents the “boxplot” graph of the results from Table 8.
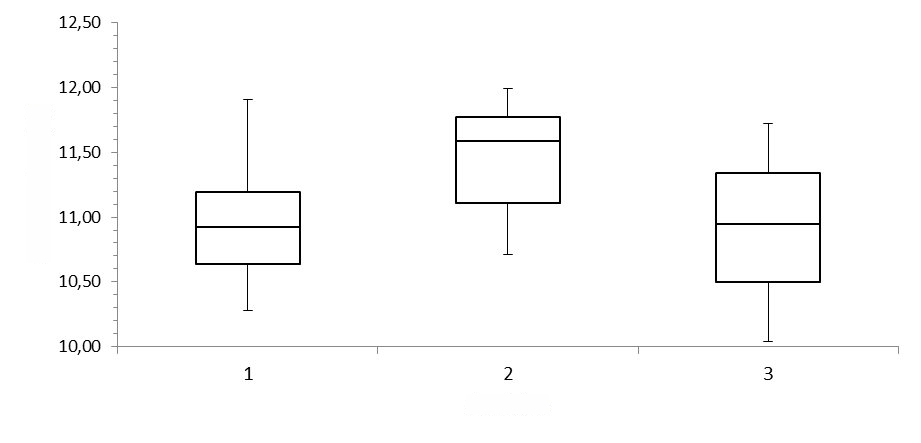
Source: Original research results.
Note: x – outlier values.
The graph in Figure 11 indicates the absence of outliers in each set of results. Analyst 2’s interquartile range is between 11.10% and 11.78%, Analyst 1’s is between 10.64% and 11.20%, and Analyst 3’s is between 10.50% and 11.34%. This data suggests that Analyst 2’s results differ from the others.
Although the graphical method suggested a difference between means, the results of Analyst 2 were kept in order to highlight the influence of intermediate precision on the uncertainty estimation. Table 9 presents the analysis of variance of the ethereal extract results.
Table 9. ANOVA for ethereal extract results (%)
| Factor | Degrees of freedom | Mean of the sum of squares | Calculated¹ | Fcritical² | p-value³ |
| Analyst | 2 | QMA = 1,567 ⁴ | 7,010 | 3,204 | 2.24 x 10⁻³ |
| Remaining | 45 | QMR = 0.2236 ⁵ | |||
| Total | 47 |
Note. ¹Fcalculated: value calculated by the test; ²Fcritical: critical reference value; ³P-value: statistical evidence of null hypothesis rejection; 4QMA: mean square of the analyst factor; ⁵QMr: mean square of the residuals.
The repeatability variance was 0.22%² (Table 9). Substituting this value into Equation 1 resulted in an estimate of 0.47% for the repeatability standard deviation.
The variance of the contribution of the Analyst factor was 0.084%² (Equation 2). Substituting these values into Equation 3 resulted in an estimate of 0.55% for the standard deviation of intermediate precision.
Furthermore, the fact that the calculated Fvalue is greater than the critical Fvalue demonstrates that the Analyst factor contributes significantly, which shows that the differences between the means arise from causes other than random errors[22]. Table 10 shows the input values for the standard uncertainty estimates of type A.
Table 10. Standard uncertainty results for each uncertainty contributor
| Uncertainty contributor | Entry value (%) | Standard uncertainty (%) | Degrees of freedom |
| Repeatability | 0,47 | 0,12 | 15 |
| Intermediate precision | 0,55 | 0,32 | 2 |
The standard uncertainty regarding intermediate precision was 0.32%, with degrees of freedom equal to 2 (Table 10). Figure 12 shows the uncertainty budget histogram for the ethereal extract analysis.
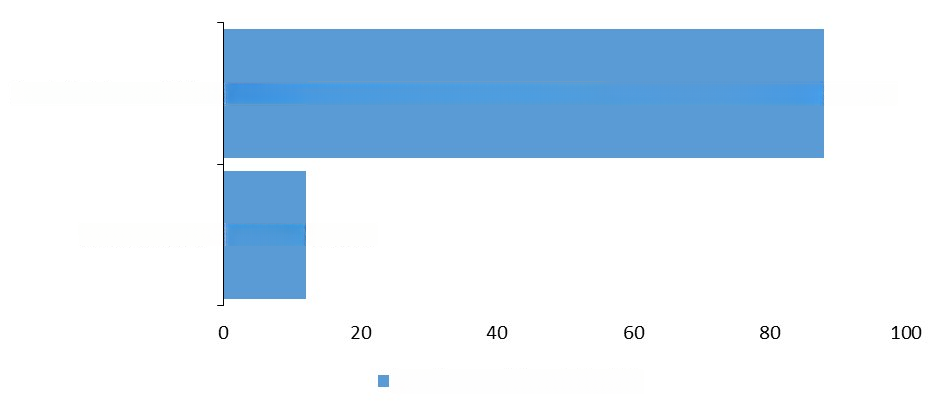
Source: Original research results.
The uncertainty associated with intermediate precision corresponds to 88.01% of the combined standard uncertainty, while that of repeatability represents 12.00% (Figure 12). By substituting the standard uncertainty values into Equation 9, a combined standard uncertainty of 0.34% and an expanded uncertainty of ± 0.68% (Equation 10) were obtained.
Thus, the expression of the ethereal extract result in cat food, considering measurement uncertainty, is: ethereal extract = (Result ± 0.68) %. The reported uncertainty corresponds to an expanded uncertainty with a confidence level of approximately 95% and is equivalent to 6.16% of the overall average of 11.09% (Equation 11).
Zarpelon et al.[26] validated an automated method for acid hydrolysis and fat extraction in dulce de leche samples with fat contents of 6% and 9%. For both samples, the expanded measurement uncertainty was ± 0.3874% and resulted in relative uncertainties of 6.46% in the 6% sample and 4.30% for the 9% one.
In comparison, Molognoni et al.[6] determined an average ethereal extract of 9.92% in pig feed, with the participation of 72 laboratories, and relative uncertainties of 8.27% (“bottom-up”) and 26.62% (“top-down”). In avian feed, the average was 5.29%, with the participation of 80 laboratories, and relative uncertainty values of 15.50% (“bottom-up”) and 27.41% (“top-down”). Figure 13 presents the comparison between the averages of ethereal extract content and the respective expanded uncertainties (traces).
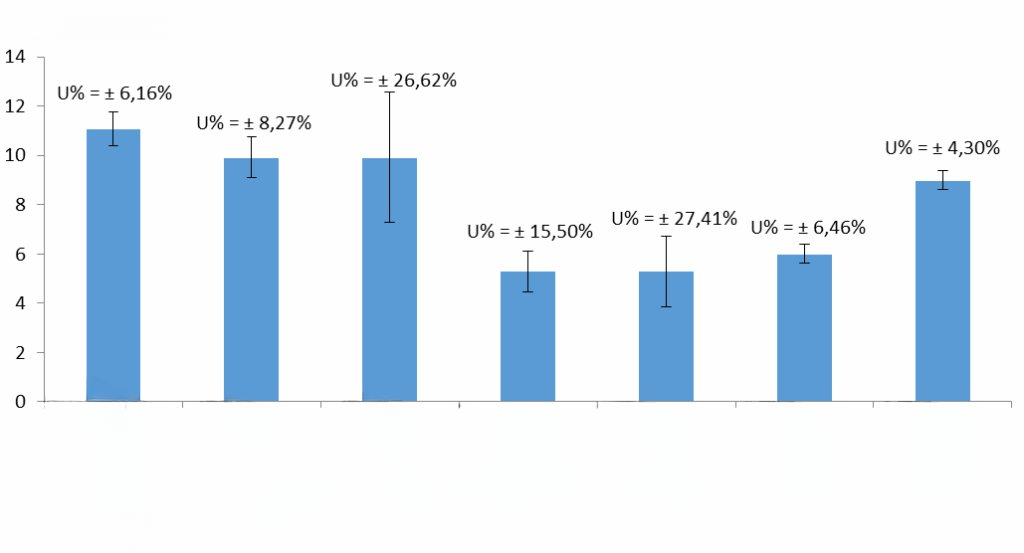
Source: Original survey results.
Note. U%: relative expanded standard uncertainty.
The measurement uncertainty of the ethereal extract was lower in this study compared to the results of other studies with animal feed matrices (Figure 13). This is due, in part, to the inclusion of interlaboratory variability in the work of Molognoni et al.[6]. Another source of variation is the mass of the fat extractor cups, about a hundred times larger than that of other gravimetric containers and the extracted fat[6],[26]. Furthermore, the type of extractor solvent used in the analysis also contributes to the variability, as the determination of ethereal extract is considered empirical due to the influence of the solvent[8].
Despite these contributors, the relative uncertainty obtained in this study was similar to the results of Zarpelon et al.[8], who applied an automated hydrolysis method with fat extraction. As they did not conduct interlaboratory studies, the variability of the results is limited to the internal conditions of each laboratory.
Performance of analytical methods
Table 11 shows the performance results of the chemical analyses evaluated in this research, with the natural basis moisture values of the tested products.
Table 11. Analytical method performance results
| Chemical analysis | Crude protein | Mineral matter | Ether extract |
| Tested matrix | Protein mineral supplement for cattle | Concentrated input for pigs | Premium food for adult cats |
| Sample moisture on a natural basis | 5,70 ± 0,10% | 9,30 ± 0,10% | 5,20 ± 0,10% |
| Specification limit (L) | Min. 40% | Max. 25% | Minimum 9% |
| Average | 41,91% | 24,02% | 11,09% |
| Absolute expanded measurement uncertainty (U) | ± 2,10% | ± 0,75% | ± 0,68% |
| Relative expanded measurement uncertainty (U%) | ± 5,01% | ± 3,12% | ± 6,16% |
| Performance ratio (U/L) | 5,25% | 3,00% | 7,56% |
According to Separovic and Lourenço[25], performance ratios below 10% indicate that the analytical method is fit for the purpose of measurement; high values suggest risks to the consumer and producer regarding incorrect approval or rejection. The performance ratios of the protein, mineral, and ether extract analyses in this research demonstrate that the analytical methods meet the requirements for product release (Table 11).
The expanded standard uncertainty results obtained in this research refer to the tested matrices, while the laboratory performs assays on samples with different analyte levels. The application of absolute uncertainty values for other concentrations may generate incorrect interpretations. However, estimating uncertainty for various concentrations is not economically viable. Therefore, a pragmatic approach adopted in laboratories is to express the expanded uncertainty in terms of relative standard deviation or coefficient of variation relative to the mean of the measurements from the interlaboratory precision study[8],[24].
The statistical tests applied in this research demonstrated that the intermediate precision analyst factor is primarily responsible for variations in the crude protein and ether extract analyses. Consequently, the relative measurement uncertainty values were higher than 5%. Although they meet the performance ratio for the tested matrices, this variability can be reduced through operational training and statistical controls[24],[25]. In addition to internal quality controls, participation in proficiency testing is recommended to compare performance with other laboratories and estimate reproducibility standard deviations[6].
The results of this study demonstrate that the analytical methods evaluated present satisfactory performance. The values obtained indicate that the methods are suitable for the measurement purpose and offer sufficient reliability for decisions in quality control processes. Thus, the assays meet the metrological requirements necessary for product release in the respective matrices tested, which increases food safety and traceability in the production chain.
However, it is necessary to continuously evaluate sources of uncertainty to reduce them, which ensures greater reliability of analytical measurements. Furthermore, participation in proficiency testing and the adoption of analytical quality control tools can improve laboratory performance.
REFERENCES
[1] Szefer, P.; Grembecka, M. 2022. Bromatological, analytical and chemometric assessment of animal and plant foods based on mineral composition. European Journal of Translational and Clinical Medicine 5(1):77-106. https://doi.org/10.31373/ejtcm/137919.
[2] Associação Brasileira de Normas Técnicas. 2017. ABNT NBR ISO/IEC 17025: Requisitos Gerais para a Competência de Laboratórios de Ensaios e Calibração. ABNT, Rio de Janeiro, RJ, Brasil.
[3] Bergamin, L.; Postali, T.P.; Bridi, D.; De Almeida, M.O.P.; Bassani, G.L.; Dal Magro, J. 2022. Validation and estimation of the incertainty of the spadns method for determining fluoride in water. Revista Acta Ambiental Catarinense 20(1): 01-19. https://doi.org/10.24021/raac.v20i1.6680.
[4] Mello, M.R.P.A.; Barbosa, J. 2015. Confiabilidade dos resultados analíticos no monitoramento do teor de iodo em sal para o consumo humano – validação da metodologia e incerteza de medição. Revista Vigilância Sanitária em Debate: Sociedade, Ciência e Tecnologia – Visa em Debate 3(2): 65-74. https://doi.org/10.3395/2317-269x.00496.
[5] Srivastava, M.; Singh, M.; Maurya, P.; Srivastava, N.; Gupta, N.; Shanker, K. 2019. Simultaneous quantification of five bioactive phenylethanoid, iridoid, and flavonol glycosides in Duranta erecta L.: ultra performance liquid chromatography method validation and uncertainty measurement. Journal of Pharmaceutical and Biomedical Analysis 174(2019): 711-717. https://doi.org/10.1016/j.jpba.2019.06.044.
[6] Molognoni, L.; Ploêncio, L.A.S.; Machado, A.M.L.; Dag, H. 2017. The role of measurement uncertainty in the conformity assessment of the chemical composition of feeds. Microchemical Journal 131(2017): 79-91. http://dx.doi.org/10.1016/j.microc.2016.11.014.
[7] Santos, J.T.A.; Silva, P.A.L.; Guimarães, A.C.R. 2022. Determinação da incerteza de medição nos ensaios de deformação permanente de solos lateríticos. Revista Transportes 30(2): 01-15. https://doi.org/10.14295/transportes.v30i2.2678.
[8] Ellison, S. L. R.; Rosslein, M.; Williams, A. 2012. Quantifying Uncertainty in Analytical Measurement: Eurachem/CITAC guide. 3th ed.. Eurachem/CITAC, Teddington, United Kingdom. Available at: https://www.eurachem.org/images/stories/Guides/pdf/QUAM2012_P1.pdf. Ae ago. 31 2025.
[9] Beasley‑Green, A.; Heckert, N.A. 2023. Estimation of measurement uncertainty for the quantification of protein by ID‑LC–MS/MS. Journal Analytical and Bioanalytical Chemistry 415(16): 3265-3274. https://doi.org/10.1007/s00216-023-04705-8.
[10] Cox, M.; O’Hagan, A. 2022. Meaningful expression of uncertainty in measurement. Journal of Accreditation and Quality Assurance (2022) 27: 19-37. https://doi.org/10.1007/s00769-021-01485-5.
[11] Miranovich-Kachur, S.A.; Haiduk, M.V. 2019. Uncertainty of analytic measurements: classical and new approaches to estimation. Journal of Measurement Techniques 62(5): 402-409. https://doi.org/10.1007/s11018-019-01637-7.
[12] Sales, R.F.; Barbosa-Patrício, L.C.; Silva, N.C.; Brito, L.R.; Silva, M.E.F.; Pimentel, M.F. 2023. Gasoline discrimination using infrared spectroscopy and virtual samples based on measurement uncertainty. Journal Spectrochimica Acta – Part A: Molecular and Biomolecular Spectroscopy 303(2023): 01-10. https://doi.org/10.1016/j.saa.2023.123248.
[13] Huang, H. 2023. A propensity-based framework for measurement uncertainty analysis. Journal Measurement 213: 01-09. https://doi.org/10.1016/j.measurement.2023.112693.
[14] AOAC. 1990. Official Methods of Analysis. 15th ed. Association of Official Analytical Chemists, Arlington, VA, USA.
[15] Compêndio Brasileiro de Alimentação Animal 2023. 2023a. Métodos analíticos: Método 2021.045 – Determinação de proteína bruta (nitrogênio total) pelo método de combustão-Dumas. 6ed. Sindirações, São Paulo, SP, Brasil.
[16] Compêndio Brasileiro de Alimentação Animal 2023. 2023b. Métodos analíticos: Método 2021.005 – Determinação de cinzas pelo método gravimétrico. 6ed. Sindirações, São Paulo, SP, Brasil.
[17] Compêndio Brasileiro de Alimentação Animal 2023. 2023c. Métodos analíticos: Método 2021.012 – Determinação de gordura total extração por hidrólise ácida. 6ed. Sindirações, São Paulo, SP, Brasil.
[18] FAO. 2011. Quality assurance for animal feed analysis laboratories. FAO Animal Production and Health Manual No. 14. Rome. Part II – Analytical procedures – Dry Matter: 83-85. Available at: https://www.fao.org/4/i2441e/i2441e00.pdf. Access on: set. 10 2025.
[19] van Raamsdonk, L.; van der Voet, H. 2022. Measurement uncertainty for detection of visual impurities in granular feed and food materials in relation to the investigated amount of material. Journal Food Additives and Contaminants – Part A Chemistry, Analysis, Control, Exposure and Risk Assessment 39 (7): 1265-1283. https://doi.org/10.1080/19440049.2022.2066193.
[20] Compêndio Brasileiro de Alimentação Animal 2023. 2023d. Métodos analíticos: Amostragem. 6ed. Sindirações, São Paulo, SP, Brasil.
[21] Ministério da Agricultura, Pecuária e Abastecimento (MAPA). 2011. Guia de validação e controle de qualidade analítica: fármacos em produtos para alimentação e medicamentos veterinários / Ministério da Agricultura, Pecuária e Abastecimento. Secretaria de Defesa Agropecuária. Brasília, DF, Brasil. Disponível em: Ministério da Agricultura, Pecuária e Abastecimento [MAPA]. 2011. Guia de validação e controle de qualidade analítica: fármacos em produtos para alimentação e medicamentos veterinários / Ministério da https://www.gov.br/agricultura/pt-br/assuntos/lfda/arquivos-publicacoes-laboratorio/guia-de-validacao-controle-de-qualidade-analitica.pdf. Acesso em: 25 ago. 2025.
[22] Associação Brasileira de Normas Técnicas. 2012. ABNT NBR 14597: Programa Intralaboratorial de Métodos Analíticos – Determinação da Repetibilidade e Precisão Intermediária. ABNT, Rio de Janeiro, RJ, Brasil.
[23] Pivoto, D.; Becker, J.M.; Bremm, C.; Albano, F.M. 2016. Uncertainty measurement in the homogenization and sample reduction in the physical classification of rice and beans. Revista Ciência Rural 46(4): 599-603. https://doi.org/10.1590/0103-8478cr20150328.
[24] Coskun, A.; Theodorsson, E.; Oosterhuis, W. P.; Sandberg, S. 2022. Measurement uncertainty for practical use. Journal Clinica Chimica Acta 531 (2022): 352-360. https://doi.org/10.1016/j.cca.2022.04.1003.
[25] Separovic, L.; Lourenço, F.R. 2020. Frequentist approach for estimation of false decision risks in conformity assessment based on measurement uncertainty of liquid chromatography analytical procedures. Journal of Pharmaceutical and Biomedical Analysis 184(2020): 113203. https://doi.org/10.1016/j.jpba.2020.113203.
[26] Zarpelon, J.; Molognoni, L.; Valese, A.C.; Ribeiro, D.H.B.; Daguer, H. 2016. Validation of an automated method for the analysis of fat content of dulce de leche. Journal of Food Composition and Analysis 48(2016): 1-7. http://dx.doi.org/10.1016/j.jfca.2015.12.011.
COMO CITAR
Santos, M.A. Estimação de incertezas de medição em análises bromatológicas para controle de qualidade de ração animal. 2026; 7: e2025050.
ABOUT THE AUTHOR
 Marco Aurélio dos Santos – Specialist in Production Engineering, Quality, and Productivity. Chemical Engineer. Avenida Dr. Maurício Cardoso, 977, Novo Hamburgo, 93510-250, RS, Brazil.