
Performance Analysis
Retirement
Pension Investment
Fixed Income
March 06, 2024
Risk and return of open supplementary pension funds through peer group and quartiles
DOI: 10.22167/2675-6528-20230105
E&S 2024, 5: e20230105
Natalia Cavalcante Henrique; Rogiene Santos
Private pension plans have become an increasingly popular alternative for individuals who, at the peak of their productive capacity, plan their financial lives to achieve a retirement that guarantees a better quality of life in old age. Open complementary pension funds are the long-term investment vehicles most sought after by these investors. The National Institute of Social Insurance (INSS), the public pension system, has proven insufficient to guarantee the purchasing power of retirees, that is, to maintain them in the socioeconomic conditions experienced throughout their lives[1].
Complementary pension plans were born in Brazil on January 10, 1835, when an imperial decree created the General Provident Fund for State Employees (Mongeral). From 1835 to 1976, private pension plans went through several stages and modifications, until they were regulated in 1977 by law nº 6.435[2]. However, despite complementary pension entities already being regulated since that time, the sector’s more pronounced growth only began to occur in the 1990s, driven by the monetary stability achieved with the Real Plan[1].
In recent years, there has been an explicit growth of interest in investments in the pension segment. According to the National Pension and Life Federation (Fenaprevi)[3], private pension fund collection grew 11% in 2022, reaching the highest volume in six years. The open private pension market reached R$ 156.2 billion in premiums and contributions from January to December 2022, representing an advance of 11.1% over 2021, and contributions exceeded withdrawals by R$ 33.4 billion that year. The Life Generator of Free Benefit (VGBL) model led the Brazilian market, with 90% of investments allocated to this modality in 2022.
By the end of 2022, approximately 10.8 million Brazilians had contracted some type of pension plan, about 8% of the population aged between 20 and 65 years. Of the R$ 156.2 billion raised in the year, 8% were allocated to the Free Benefit Generator Plan (PGBL), and 2% to traditional plans. This means over R$ 140.3 billion in premiums in VGBL, R$ 12.7 billion in contributions in PGBL, and R$ 3.2 billion in traditional plans. Redemptions recorded in that year were R$ 122.8 billion, resulting in a positive net inflow (i.e., when inflow is greater than redemption volume) of R$ 33.4 billion[3].
Of the 13.8 million plans marketed in 2022, 61% were VGBL, 21% were PGBL, and 18% were traditional risk, accumulation, or Individual Programmed Retirement Fund (FAPI) plans. Of this total, 65,000 (0.5%) are in the benefit reception phase. The total assets of the sector, which represent the society’s pension savings, amount to R$ 1.2 trillion, or about 12.5% of the national Gross Domestic Product (GDP), according to Fenaprevi data.
The main factors that motivated investors’ search for private pensions were[4]:
- the 2019 Labor Reform;
- the lack of confidence in social security (INSS);
- the technological advancement, which generated the offering of applications, investment platforms, digital banks, fintechs and insurtechs, facilitating the product offering;
- the substantial growth of independent managers also acting in private pension funds (2016);
- the open banking;
- the adequacy of the offer to the client’s profile;
- the cheapest, most sophisticated and best pension products;
- the economic context, such as variations in the Selic interest rate.
Among the benefits that make complementary pension funds more attractive are[4]:
- the possibility of having a source of income in old age;
- financial planning;
- tax benefits;
- the non-requirement of a minimum age for commencement;
- the flexibility in portability of the investment fund (from which the amount is contributed) and of the insurer, free of charge and income tax;
- the exemption from the “come-cotas’’;
- succession planning.
As the pension market evolves, so does the quantity of available products, in a constant attempt to adapt to investors’ tastes and profiles. With the change in resolution no. 4.444, of November 13, 2015, it became possible to invest up to 100% of resources in stocks, and 40% in foreign assets for qualified investors (with values exceeding R$ 1 million invested or deep market knowledge)[5]. For retail investors, the limits are up to 20% for foreign assets and 70% in stocks. Also in 2019, regulatory changes occurred in resolution no. 4.769, and, from then on, it was possible to allocate to assets subject to exchange rate variation[6]. Such changes contributed to independent firms and managers having greater interest in launching new pension products.
According to the Brazilian Association of Financial and Capital Markets Entities (Anbima)[7], the number of pension funds available in the country increased by 79% from 2019 to 2022, while the number of multi-market funds grew by 40%. In the case of equity funds, the growth was 68%; in fixed income, 17%. Currently, the pension fund category represents 20% of all allocations in Brazil’s fund sector. The increase in the number of funds and players makes the saver’s task of deciding how and where to invest resources safely for supplementary retirement more difficult.
The objective of this study was to analyze the performance of fixed-income (RF) pension funds of the main players in the market, namely the assets — asset managers legally constituted and supervised by the Securities and Exchange Commission (CVM) — that have the largest net worth (PL) for private pension allocation in Brazil: Bradesco Vida e Previdência, BrasilPrev, Caixa Vida e Previdência, and Itaú Vida e Previdência.
The adopted research method was exploratory and quantitative[8], with the application of a performance analysis model through classification by peer group and monitoring by quartiles, using statistical techniques. After selecting the fixed-income pension funds from the main players in the market for the composition of the peer group, the resulting sample consisted of one fund for each player.
The criterion for classifying the players was the ranking of technical provisions (the amount an insurance company needs to reserve on its balance sheet to meet its commitments to policyholders), released annually by Fenaprevi[3]. The composition of the analysis for this study consisted of four funds, whose results were compared to the returns of the Interbank Deposit Certificate (CDI) and the Anbima Market Index (IMA-S), provided by Anbima, in order to assist in the search for funds with better performance.
Figure 1. Technical provisions
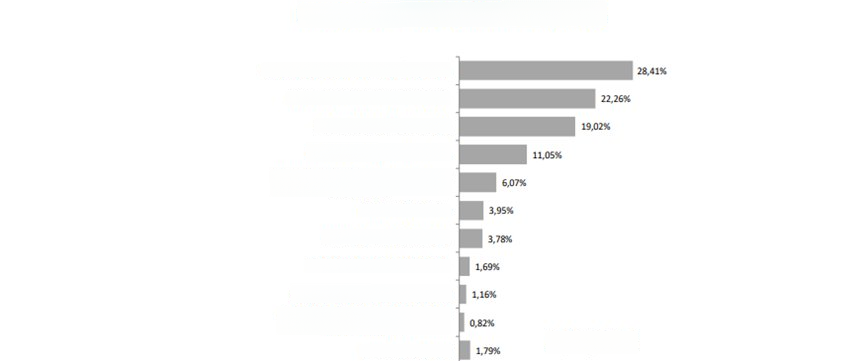
Source: Fenaprevi[3].
Data collection for this research was conducted on the Quantum Axis platform, at CVM and Anbima, in addition to seeking information in books, regulations, academic articles, and current legislation. Information on the disclosure of the studied funds was also collected.
The peer group by quartile — a process by which a reference group of funds comparable to investment theses and philosophies was established — enabled constant monitoring of PGBL and VGBL management to measure the relative performance (return) of investment funds, comparing them to competitors. The quartile is composed of the values of a series that are divided into four equal parts, and three of them (Q1, Q2, and Q3) are necessary to divide the series into four. Q2 will always be equal to the median of the series, as shown in Figure 2:
Figure 2. Illustration of the quartile division
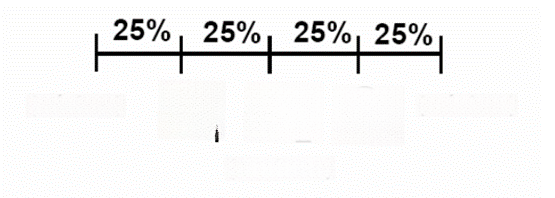
Source: Original survey data.
This methodology makes it possible to encompass the largest possible representative market sample, mainly in monetary terms, and, in parallel, to present relative stability in its composition in terms of competitors, in order to obtain a consistent periodic comparison with the market of operation. The quartiles are as follows:
a) first quartile (Q1 or lower quartile — Qi): is the set that delimits the 25% smallest values. Thus, 25% of the values are smaller than Qi, and 75% are larger than Qi;
b) second quartile (Q2 = median): is the median itself (Md), which separates the smallest 50% from the largest 50% of values;
c) third quartile (Q3 and Q4 or upper quartile — Qs): delimits the largest 25% of values. Thus, 75% of the values are smaller than Qs, and 25% are larger than Qs.
Quartiles aid in quantitative analysis, using statistical criteria to verify adherence in terms of return and risk, with the aim of making the process as objective as possible. The data used were information on volatility and return of fixed-income funds in the 18-month period between October 2021 and March 2023.
For the formation of the peer group, it was necessary to apply qualitative filters to exclude non-comparable backgrounds and strategies (with distinct net worths, for example). In this study, the quantitative analysis was performed by selecting one fund from each Open Complementary Pension Entity that was among the top four in the ranking of net worth of technical provisions in 2022. Another important quantitative analysis was the classification based on Anbima’s categorization. This analysis worked only with funds classified by Anbima as fixed-income pension funds.
Finally, the fund with the oldest creation date was selected, and as an arbitration criterion among the oldest funds, the one with the largest Net Asset Value (NAV), thus adapting a base of comparable pension fixed-income funds that sought returns through diversification of investments in fixed-income assets, without concentration in a specific class or benchmark index, with a conservative and moderate risk profile. The review frequency of the peer group was set as annual, in the last month of each year.
To obtain the necessary data related to investment funds, the Quantum Axis system was used, which is an online platform that allows access, analysis, comparison, and monitoring of the financial information of selected funds. Quantum Axis has analysis tools and a database of net worth, profitability, and administration fees for various types of funds. For this research, information from Private Pension Fixed Income funds was used.
It is worth noting that the data extracted from the platform are available on various websites in the fund sector, such as Anbima Data and CVM. The Quantum tool was used to facilitate the consolidation of such data. Additionally, return and volatility, extracted from Quantum, were also used to analyze the historical series.
This study used the CDI rates (B3 calculation that generates the average interest rate among banks) and Selic (basic interest rate) as comparison guidelines with the funds in the sample. The selected pension investment funds are represented in Figure 3.
Figure 3. Selected funds
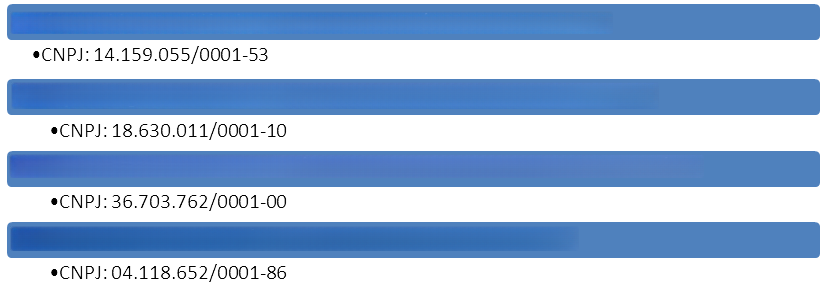
Source: Original survey data.
The model of this work sought to measure the performance of four fixed-income pension funds from the four main bancassurance companies — that is, from the banking insurance sector — in Brazil, against the main fixed-income financial market indices. The risk-return relationship of the funds and indicators in the audited period was developed to allow a comparison, the result of which is shown in Figure 4.
Figure 4. Risk and return analysis of the sample funds versus CDI and IMA-S
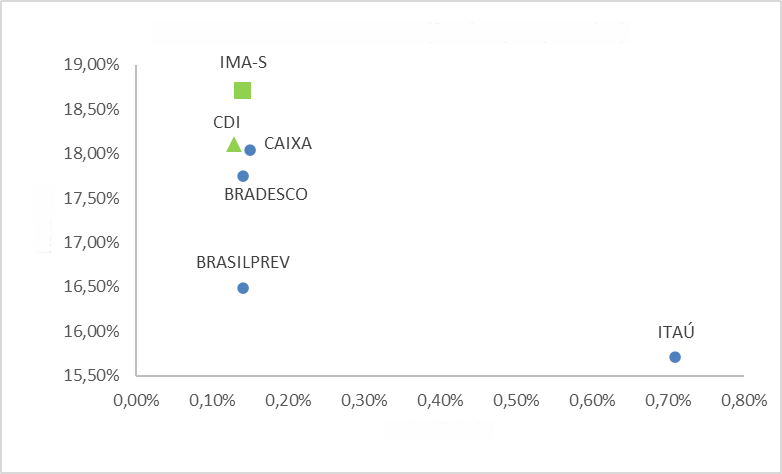
Source: Elaborated by the author with data extracted from Quantum Axis from October 2021 to March 2023.
It is observed that the fixed-income pension funds evaluated in this peer group have similar risk and return to the post-fixed income market indicators IMA-S and CDI. Only the Itaú Vida e Previdência fund behaved as an outlier, with volatility higher than the other funds in the peer group. It is possible to observe that the accumulated return value over the 18 months of the study was close to its benchmarks, and the same happened with volatility (with the exception of the Itaú fund).
Figure 5. Return of the peer group (selected funds in the survey) versus market indicators (CDI and IMA-S)
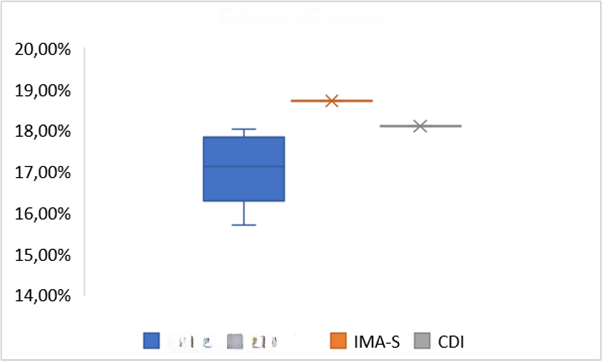
Source: Elaborated by the author with data extracted from Quantum Axis from October 2021 to March 2023.
Figure 6. Return of the peer group (funds selected in the survey) versus market indicators (CDI and IMA-S)
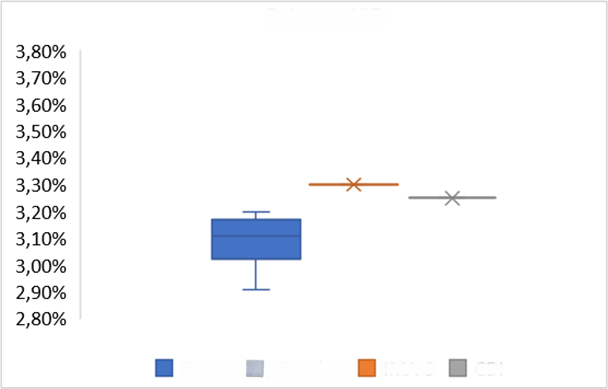
Source: Elaborated by the author with data extracted from Quantum Axis from January 2023 to March 2023 — “Year-to-date” (YtD).
Figure 7. Volatility of the peer group (funds selected in the survey) versus market indicators (CDI and IMA-S)
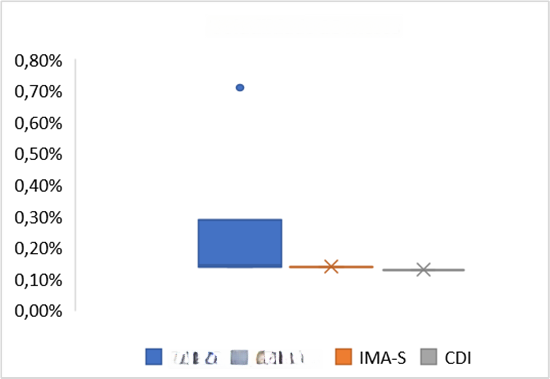
Source: Elaborated by the author with data extracted from Quantum Axis from October 2021 to March 2023.
Figure 8. Volatility of peer group (funds selected in the survey) versus market indicators (CDI and IMA-S)
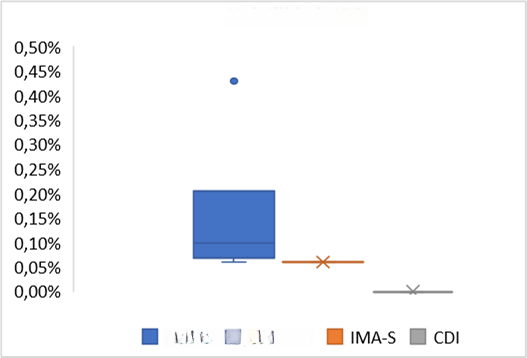
Source: Elaborated by the author with data extracted from Quantum Axis from January 2023 to March 2023 —Year-to-date (YtD).
Table 1 presents the return and volatility position of the graphs above.
Table 1. Volatility
| 18 months | YtD* | |||
| Volume (%) | Return (%) | Volume (%) | Return (%) | |
| Minimum | 0,13 | 15,71 | 0,00 | 2,91 |
| Median | 0,14 | 17,90 | 0,07 | 3,18 |
| Maximum | 0,71 | 18,71 | 0,43 | 3,30 |
Note: *Year-to-date (YtD): accumulated for the year
The present study enabled the understanding of the performance analysis methodology of the selected pension investment funds, through the comparison of risk versus return with similar funds. The sample was analyzed with the help of the peer group model, a tool that facilitates observation within a numerous universe, providing the investor with the possibility of comparing various scenarios.
The intention of this research was not to state which fund has the best performance, although it facilitates this understanding. The idea here was, in fact, to demonstrate how to understand the return of pension funds. It was observed that, by using graphs and quartile positions, it is possible to monitor the performance of investments, which can help the investor decide which pension fund best fits their situation.
It is important to mention that the analysis period covered the recovery from the crisis caused by the covid-19 pandemic, which influenced the high interest rate and the performance of the funds. It is also essential to consider that the pension market is cyclical and, in the period covered by this study, there was a significant expansion of the sector in relation to fund inflows. Finally, it is also worth pointing out that the analysis of fund performance via peer group should be carried out not only at the time of the investment decision, but also to maintain a history of profitability of the chosen fund. It is a fact that positive past performance does not guarantee the same future result, but observing whether the result is in line with the proposed policy and objective helps in the analysis for making a more assertive decision.
References
[1] Alves C.; Namilton N.; Camargos, M.A. Investimentos em previdência privada fechada: uma análise comparativa com outras opções de aplicações financeiras no Brasil. Contextus — Revista Contemporânea de Economia e Gestão. 2012; 10(2): 7-24. DOI: 10.19094/contextus.v10i2.32146.
[2] Brasil. Lei n.º 6.435, de 15 de julho de 1977. Dispõe sobre as entidades de previdência privada, e dá outras providências. Diário Oficial da União. 1977 jul. 20. Disponível em: https://www.planalto.gov.br/ccivil_03/leis/l6435.htm. Acesso em: 23 fev. 2024.
[3] Federação Nacional de Previdência Privada e Vida (Fenaprevi). Captação da previdência privada cresceu em 11% em 2022 e alcança maior volume em seis anos. 2023. Disponível em: https://valorinveste.globo.com/produtos/previdencia-privada/noticia/2023/02/17/captacao-da-previdencia-privada-cresce-11percent-em-2022-e-alcanca-maior-volume-em-seis-anos.ghtml. Acesso em: 17 fev. 2023.
[4] Scolese D. 2022. Análise dos fundos de previdência complementar aberta. In: Comite de Fundos de Previdência, 2022, São Paulo, SP, Brasil.
[5] Banco Central do Brasil. Resolução nº 4.444, de 13 de novembro de 2015. Dispõe sobre as normas que disciplinam a aplicação dos recursos das reservas técnicas, das provisões e dos fundos das sociedades seguradoras, das sociedades de capitalização, das entidades abertas de previdência complementar e dos resseguradores locais, sobre as aplicações dos recursos exigidos no País para a garantia das obrigações de ressegurador admitido e sobre a carteira dos Fundos de Aposentadoria Programada Individual (Fapi). Diário Oficial da União. 2015 nov. 13.
[6] Banco Central do Brasil. Resolução nº 4769, de 19 de dezembro de 2019. Altera o Regulamento anexo à Resolução nº 4.444, de 13 de novembro de 2015, que disciplina a aplicação dos recursos das reservas técnicas, das provisões e dos fundos das sociedades seguradoras, das sociedades de capitalização, das entidades abertas de previdência complementar e dos resseguradores locais, sobre as aplicações dos recursos exigidos no País para a garantia das obrigações de ressegurador admitido e sobre a carteira dos Fundos de Aposentadoria Programada Individual (Fapi). Diário Oficial da União. 2019 dez. 23.
[7] Ranking de Gestores de Fundos de Investimento. 2024. Associação Brasileira das Entidades dos Mercados Financeiro e de Capitais. Disponível em: https://www.anbima.com.br/pt_br/informar/ranking/fundos-de-investimento/gestores.htm.
[8] Gil A.C. Como elaborar projetos de pesquisa. 6ed. Rio de Janeiro (RJ): Atlas; 2017. 192 p.
Como citar
Henrique N.C.; Santos R. Risco e retorno dos fundos de previdência complementar aberta, por meio de peer group e quartis. Revista E&S. 2024; 5: e20230105.
Sobre as autoras
Natalia Cavalcante Henrique , Avenida Aparecida do Rio Negro, 574 – Jardim Íris; CEP 05144-085 – São Paulo, SP, Brasil.
Rogiene Santos, Orientadora do Curso de MBA em Finanças e Controladoria – Rua Cezira Giovanoni
Moretti, 580 – Santa Rosa; CEP 13714-157 – Piracicaba, SP, Brasil.
Download link: PDF