
South America
Logistics
Health
Free Trade Zone
August 07, 2024
Healthcare product logistics in South America: distribution via Uruguay’s free trade zone
DOI: 10.22167/2675-6528-20240002
E&S 2024, 5: e202400002
Luana Gonçalves de Castro e Lilian Maluf de Lima
Logistics should be used as a mechanism to get ahead of the competition in the globalized market. According to Barros[1], the new concept of logistics to be incorporated by organizations is multifunctional, that is, integrated with the financial, quality, marketing, and sales spheres. The logistics of goods, previously classified as an additional expense for organizations, goes far beyond a mere storage and transportation strategy, becoming an essential element for business fluidity and for gaining competitive advantage[2].
In the case of the healthcare sector, materials play a fundamental role in ensuring that the right product is delivered to the right place, at the right time and in the right quantities, under the best possible conditions, in order to perform a life-saving, diagnostic, research, analysis or support role[3]. The high costs of international freight and taxes paid on the importation of materials disadvantage Latin America and often make business in the segment unviable[4].
In this scenario, Uruguay is considered an interesting alternative for clients from South American countries, for faster and lower-cost distribution of health products, as it presents itself as an entry point to the Southern Common Market [MERCOSUR], allowing access to a market of over 270 million people and positioning itself as a regional logistics hub[5]. It is noteworthy that Uruguay has a total of 12 free trade zones, with the most important free trade zone in the country being Zonamerica, which contributes 1.85% to the national GDP[6]. Furthermore, Zonamerica is located in an area of high technical, scientific, and informational density[7].
One of the strengths of Uruguay’s free trade zone is the possibility of carrying out just in time (producing only what is necessary) and lead time (time elapsed from order to product delivery), operations, reducing delivery time to the final customer and replacing direct factory delivery with delivery from logistics centers. This has generated new opportunities for health product distribution, replacing “traditional” logistics with speed to market logistics, with rapid response in volume, production, and time[5].
In this context, the present study sought to evaluate the advantages and disadvantages involved in the implementation of a distribution center for a laboratory products company in the Uruguay free trade zone. A case study was developed regarding this company, which was founded in 1945 and had 25 subsidiaries worldwide, with the São Paulo branch being responsible for the commercialization of products throughout Latin America. The business model of the Brazilian subsidiary was different from that used by those located in other Latin American countries; in Brazil, the company operated 100% with direct sales, while in other countries, sales occurred through 20 distributors throughout the region (Figure 1).
These partners were responsible not only for the brand’s commercialization in their area of operation, but also for the international logistics for import, storage, and distribution of the products.
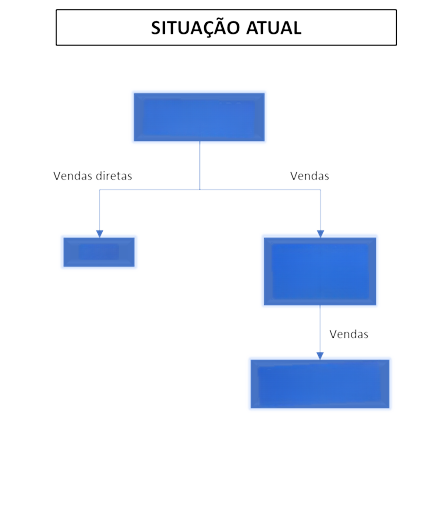 | 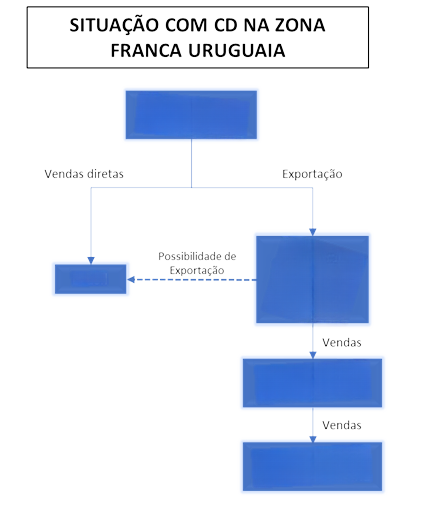 |
Note: By “current situation” is understood the situation verified in the case study.
Source: Original research data.
About 80% of South American distributors were small companies, which had limited resources and imported products from Germany on demand and in small quantities, leading to high international shipping costs and customer delivery times of 60 to 120 days. The distributors did not have the resources to maintain local inventories, especially since the company had over 10,000 stock keeping units (SKUs) — a code that identifies items —, with about 2,000 of them being fast-moving.
To leverage growth above 10% for at least five years, the company intended to implement a distribution center in Uruguay’s free trade zone that would enable sales by small distributors, having three main purposes:
1 – significant reduction in logistical cost for the distributor, who would be importing from Uruguay and no longer from Germany;
2 – reduction in delivery time from 60–120 days to 7–15 days, due to geographical location;
3 – tariff exemption from this free trade zone.
According to Martins[8], one of the strengths of data collection for a case study is the fact that it uses different sources for data verification. The author states that the main trend in all types of case studies is to try to clarify a decision or a set of decisions: what the motivation was, how they were implemented, and what the results were.
To evaluate the collected information, the strengths, weaknesses, opportunities, and threats (SWOT) analysis methodology was used, which, according to Dornelas[9], is one of the most important for business; through it, it is possible to demonstrate how prepared the company is for the risks and challenges of its market. Furthermore, this tool allows for outlining the situation and, as needed, implementing strategic changes.
The SWOT analysis technique can make the company more competitive by focusing attention on strengths, recognizing weaknesses, taking advantage of opportunities, and preparing to face threats[10]. This type of analysis prepares the ground for future strategic decisions of the company to occur in a way that is adequate to its reality, providing a competitive positioning and the capacity for action and reaction.
Thus, five stages were used for conducting the aforementioned case study. Stage 1 consisted of applying a questionnaire to eight distributors of the company studied. This information allowed us to understand the logistical difficulties faced by the distributors of the organization’s products located in South American countries (Chile, Uruguay, Paraguay, Argentina, Colombia, Bolivia, and Peru), in addition to investigating whether there would be adherence from the partners to the alteration of logistical routes, which were based on time-consuming and costly imports from the factory in Germany and the United States, to the import of the same products from Uruguay.
Based on the responses from the eight distributors, Figures 2 to 4 present information about the scenario at the time of the research, as well as about the difficulties faced by the distribution units. Regarding the costs of the company’s product import and logistics process, it was observed that half of the sample presented low satisfaction; none were satisfied or very satisfied (Figure 2).
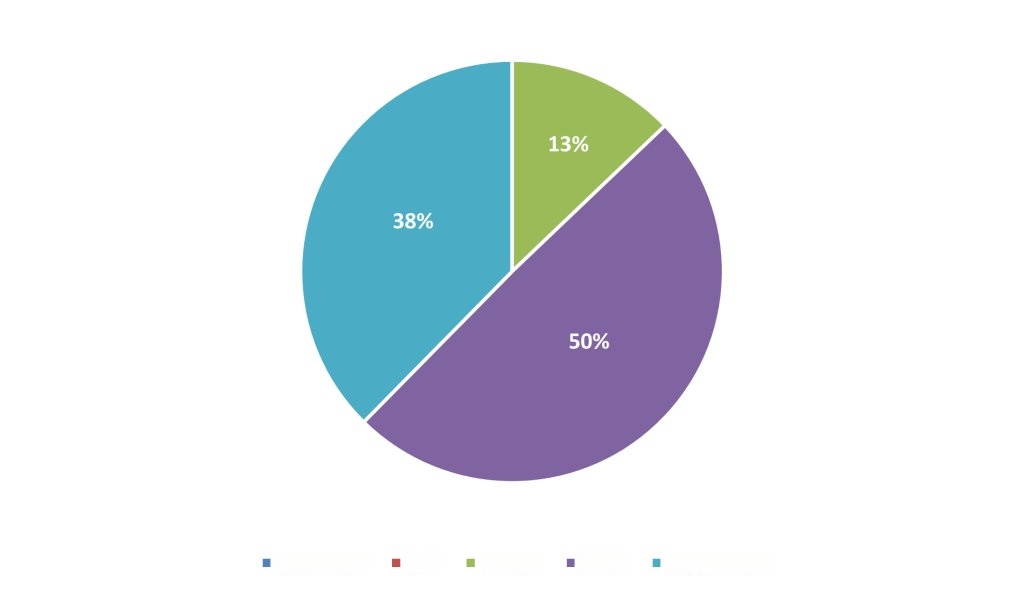
Figure 2. Degree of distributor satisfaction regarding the costs of the import process and product logistics at the time of the survey
Source: Original survey data.
Regarding the delivery times for the import process and product logistics, it was observed that more than half of the sample showed low satisfaction, and none were satisfied or very satisfied (Figure 3).
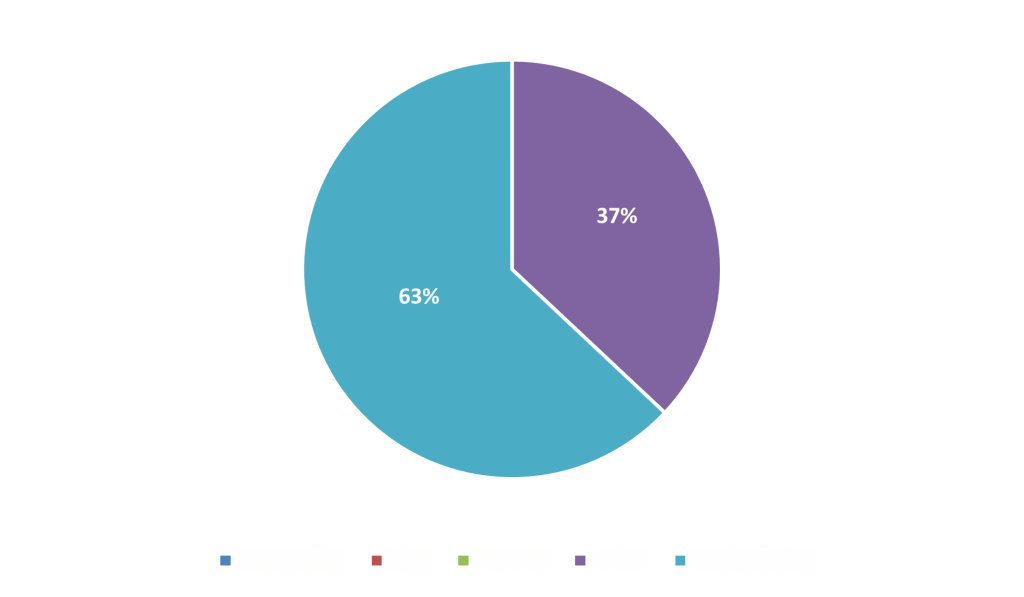
Figure 3. Degree of distributor satisfaction regarding delivery times to final customers of their import and logistics process
Source: Original survey data.
Regarding the degree of distributor adherence in a scenario of logistical route change from the Uruguay free trade zone, it was observed that all demonstrated interest (100%). When asked about the possibility of cost reduction if import processes occurred from Uruguay, 100% of respondents fully agreed. They were also unanimous in the opinion that there would be an improvement in delivery times. There was a slight division only when asked about the degree of agreement with the statement: “With the existence of a company logistics center within the Uruguay Free Trade Zone, my business would certainly be leveraged in the region, with margin gains, market share increase, and more satisfied customers.”. Although 100% of respondents agreed with the statement, 75% did so without reservations, and 25% with reservations (Figure 4).
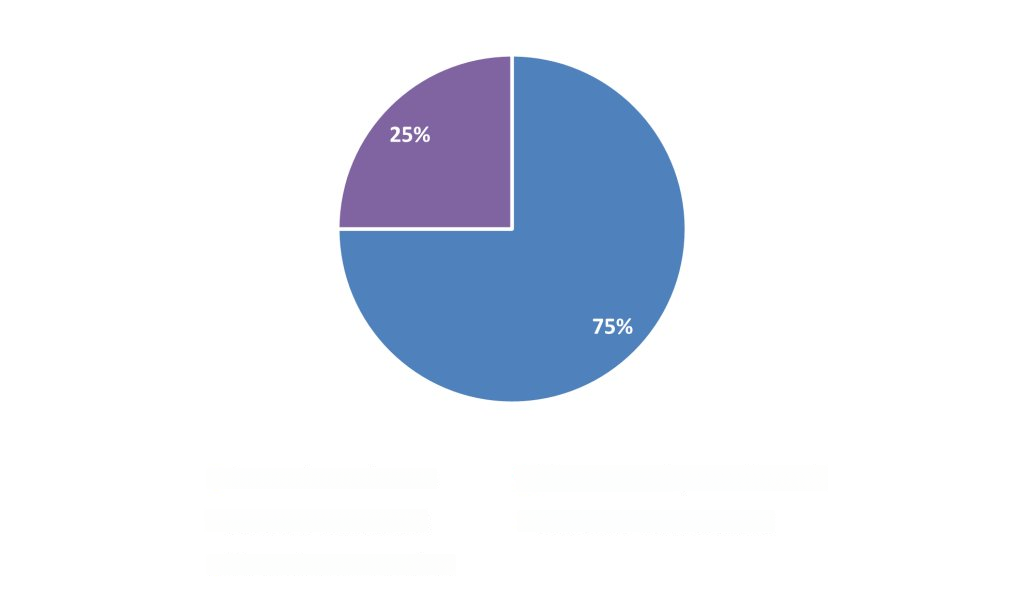
Figure 4. With the Uruguay Free Trade Zone, my business would certainly be leveraged in the region, with a gain in margin, increase in
market share and more satisfied customersSource: Original survey data.
Stage 2 was based on the search for information from the Uruguay region and academic material, in order to explore all angles of the topic. Initially, the company object of this study hired a market research firm with the aim of obtaining more assertive information regarding the sales potential of South America within the laboratory products market.
From the data presented in Figures 5 to 8, it was possible to understand that the studied company was much more dependent on Brazil for its sales and revenues than its competitors (here designated as A, B, C, and D), which demonstrated a fragility in the company’s commercial strategy, as Brazil approached its plateau in the growth curve (stabilization or decrease in sales), with even a tendency towards shrinkage (data obtained from the company hired to conduct market research for the case study segment).
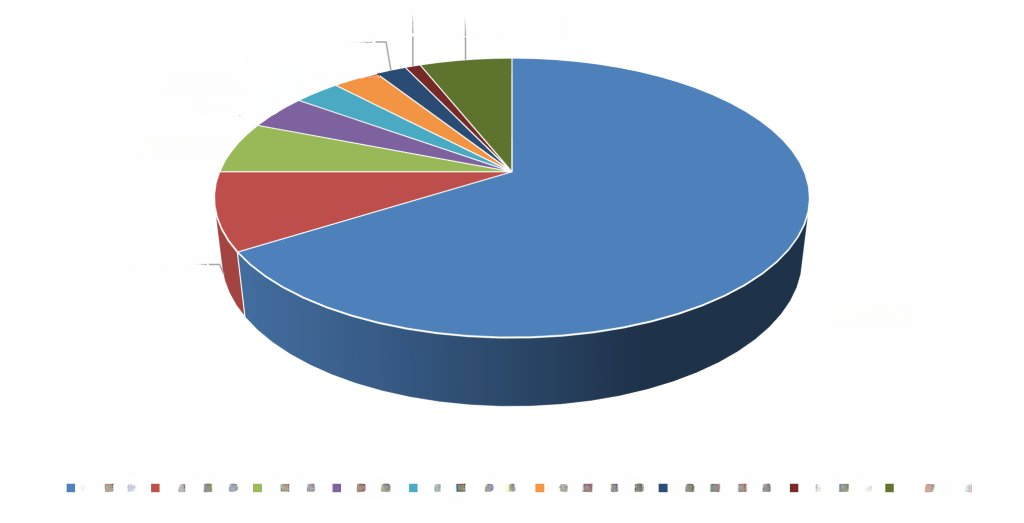
Figure 5. Company studied: representativeness of sales for Latin American countries
Source: Original research data.
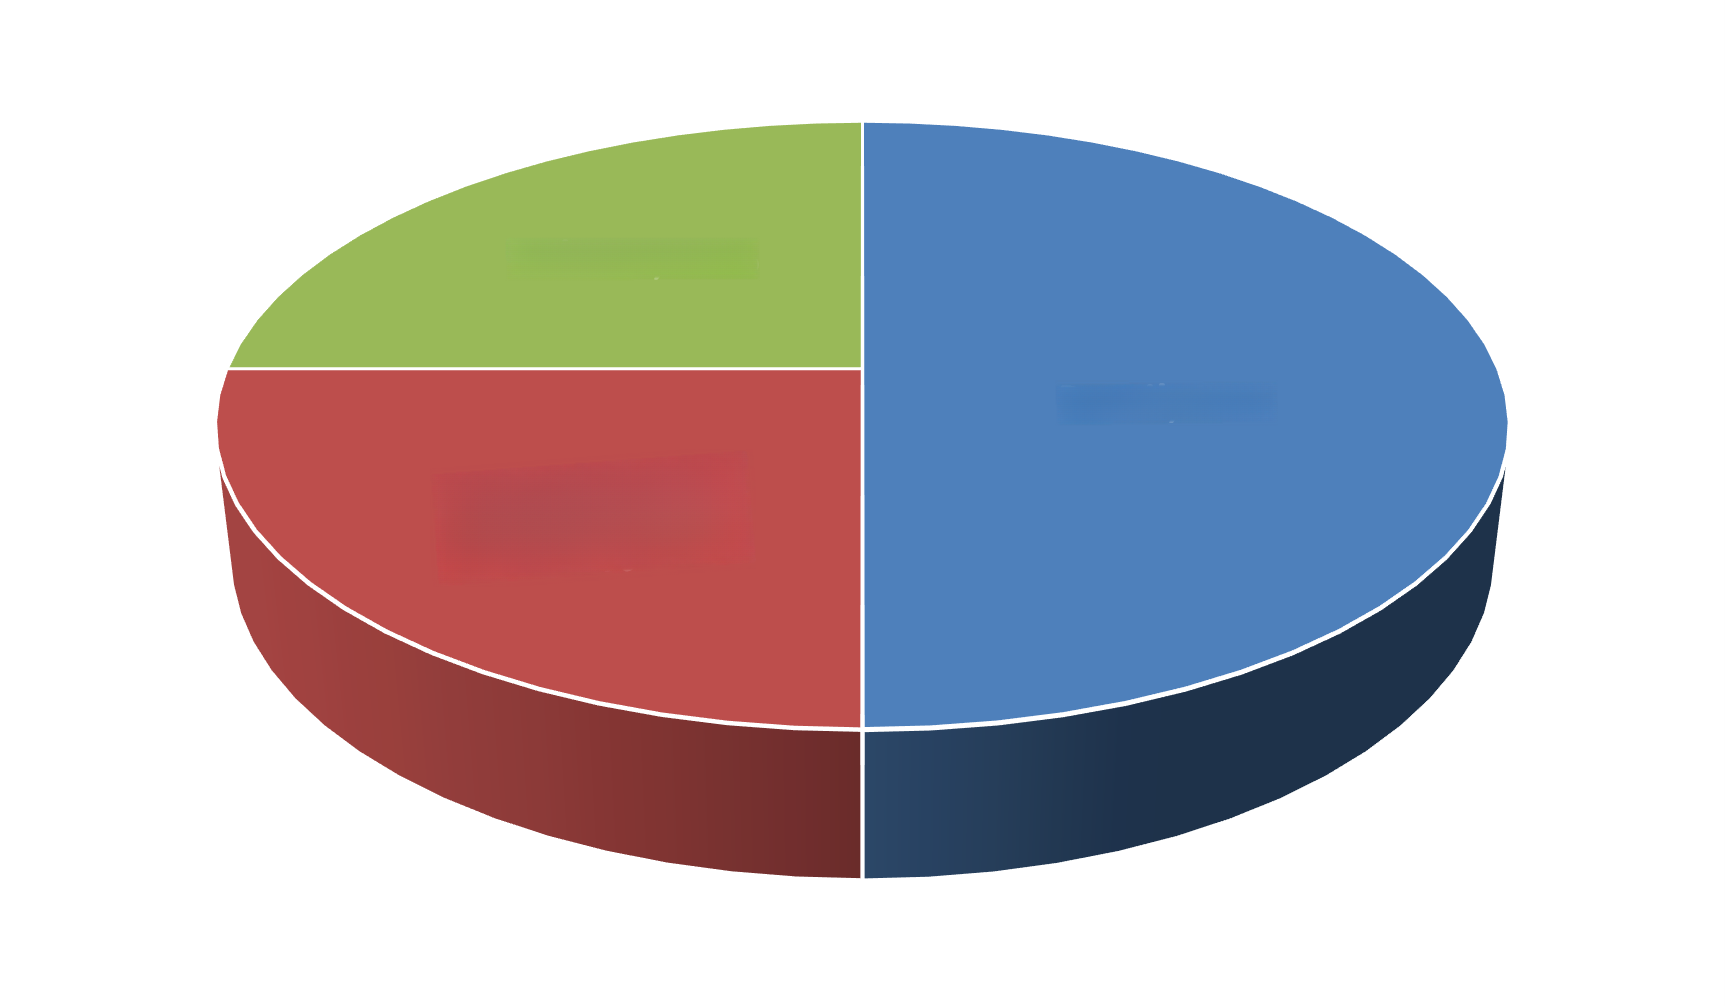
Figure 6. Competitor A: sales representativeness for Latin American countries
Source: Original survey data.
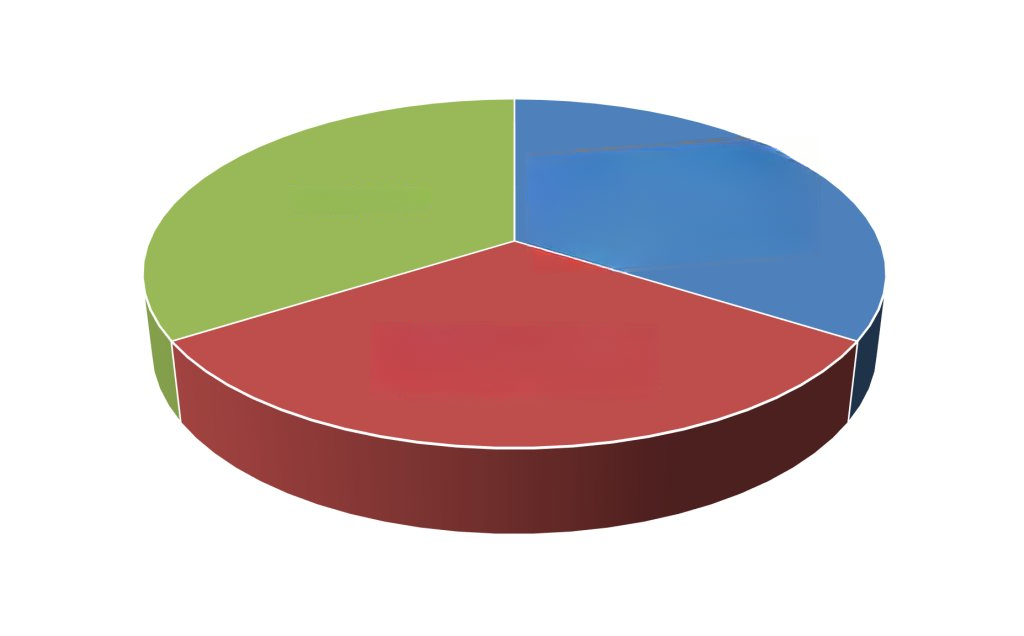
Figure 7. Competitor B: sales representativeness for Latin American countries
Source: Original survey data.
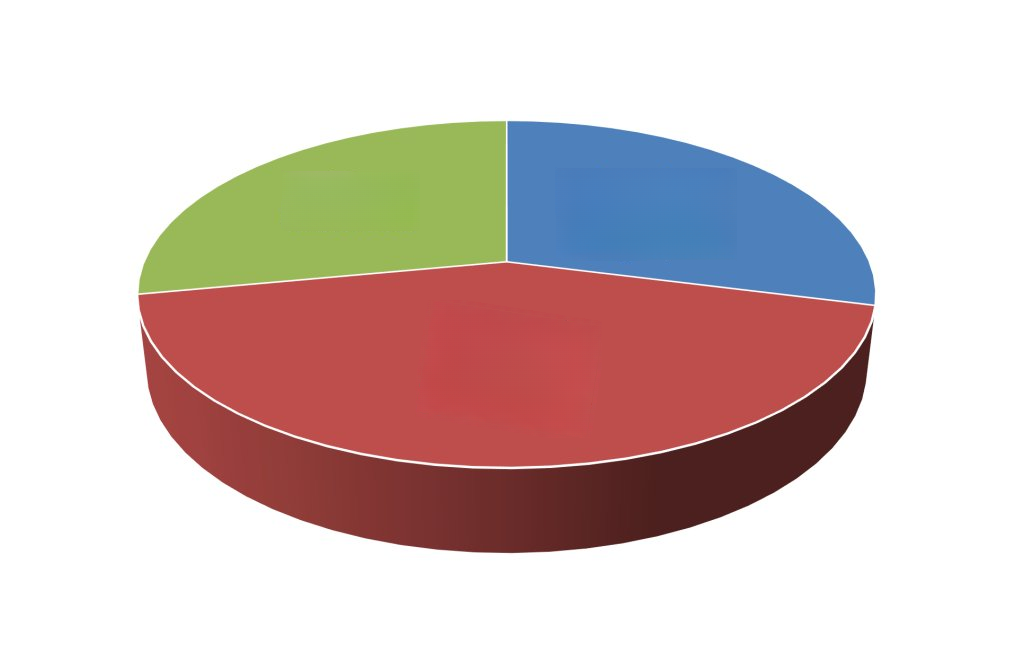
Figure 8. Competitor C: sales representativeness for Latin American countries
Source: Original survey data.
Regarding the region chosen for the present case study (Zonamerica), research was conducted on healthcare companies — the same segment as the company studied — that were already operating in the area, to lend greater reliability to the implementation process of the distribution center of the company object of the research, according to Table 1:
Table 1. Companies located in Uruguay’s Zonamerica, according to start of operations
| Company located in the Zonamerica of Uruguay | Year operations began |
| Prochem Representaciones S.R.L. | 1991 |
| Becton Dickinson Del Uruguay S.A. | 2007 |
| Optiren S.A. Uruguay | 2012 |
| M3 Pharma S.A. | 2013 |
| Shimadzu Latin America S.A. | 2014 |
| Terumo Bct Inc. Zona Franca Branch of Uruguay | 2014 |
| Abbott Operations Uruguay S.R.L. | 2016 |
| Catalent Uruguay S.A. | 2016 |
| Fresenius Kabi Latin America Exports S.A. | 2018 |
According to the Free Zone Census of 2019, Uruguay’s Zonamerica was the free zone with the largest number of exporting companies in Latin America; in 2019 the region exported a total of US$ 5.78 million in goods[12]. Table 2 shows this total by free trade zone in the country. It is important to note that, although Zonamerica was not the largest in value, as the other free zones were intended for other segments (many of them high value-added, such as electronics and agribusiness), in terms of operating companies, Zonamerica ranked first.
Table 2. Number of companies exporting from free trade zones and average value exported per company
| Free trade zone name | Number of exporting companies | Average exports per company, in millions of dollars |
| Zonamerica Corporation | 378 | 5,78 |
| WTC Free Zone S.A. | 102 | 6,70 |
| Aguadapark Corporation | 66 | 10,78 |
| Florida Free Trade Zone S.A. | 43 | 0,76 |
| Grupo Continental Free Trade Zone S.A. | 28 | 20,18 |
| Parque de las ciencias Corporation | 22 | 6,41 |
| Lideral S.A. | 15 | 2,32 |
| Colonia Suiza Free Trade Zone S.A. | 4 | 5,58 |
| UPM Fray Bentos S.A. | 3 | 125,41 |
| Punta Pereira Free Zone S.A. | 3 | 170,64 |
| Zona Nueva Palmira S.A. | 3 | 19,74 |
| Sum | 667 | 7,98 |
Another relevant factor for the present study was the fact that, once the company studied implemented its operation in Uruguay, the opportunity for sales would arise through an important e-commerce platform focused on laboratory products in the South American region, named One Lab. One Lab then operated in Argentina, Colombia, and Uruguay, with expansion plans for Peru and Paraguay[13].
For stage 3 of the present study, the SWOT matrix was developed to evaluate the strengths, weaknesses, opportunities, and threats of the project for implementing a distribution center in the free trade zone of Uruguay[14]. This information is represented in Table 3.
Table 3. SWOT matrix with research results
| Strengths (sstrengths) | Weaknesses (weaknesses) |
| Tax incentives (exemption from import taxes). Strategic location. Distributors will be able to sell through bidding and electronic purchasing portals, which require fast deliveries, which does not happen in normal operations. Consolidation of cargo from Germany and the United States in the same shipment for distributors. Reduction of costs with international freight paid by distributors. Reduction in delivery time of goods to final customers. Modern infrastructure. | Very large product portfolio of the company; it would be possible to keep only part of the items in stock, after careful demand analysis. |
| Opportunities (opportunities) | Threats (threats) |
| Sales of products through the e-commerce platform OneLab, operating in Argentina, Colombia, and Uruguay. Increased brand capillarity in the South American market. Existing free trade policy in Uruguay. | Opening a branch in the free trade zone is subject to approval by the Uruguayan government. Approval by the Uruguayan government is valid for five years; after this period, a new approval request must be submitted (with no limit on renewals). Competition is well-established in South America. Global economic instability. |
Operating in the Uruguayan free trade zone offers the main benefit of fiscal incentives, given that there is exemption from import and export taxes, as well as tax benefits for companies operating within the zone, resulting in reduced operational costs and increased competitiveness[8]. Furthermore, the free trade zone is strategically located in Latin America, providing easy access to South American markets, which offers logistical advantages, with shorter transport times and reduced freight costs. Additionally, the Uruguayan free trade zone has modern infrastructure, with state-of-the-art warehousing, transportation, and communication systems, which facilitates the operations of a distribution center, increasing the efficiency and effectiveness of operations[15].
It is important to highlight the opportunity that the studied company would have regarding the growth of foreign trade in the global scope. Uruguay is a country known for its free trade policy and favorable international trade relations, which could result in an increase in the company’s capillarity of products throughout the Latin American region[16].
A relevant threat that could cause the postponement of the approval of the project for a distribution center of the studied company in the Uruguay free trade zone is global economic instability. The economy can be volatile and negatively affect the project’s performance, due to changes in economic, political, or commercial conditions[17].
For stage 4 of the present study, a comparison was made between the operation used by the company at the time of the research and the scenario with the new distribution center, both in relation to international freight costs and the delivery time of products to distributors. It is important to mention that, once the company studied was operating in the free trade zone of Uruguay, all logistical costs for the Germany–Uruguayan free trade zone leg would be the company’s responsibility, and a portion of these costs should be passed on to distributors in the Latin American region, through an increase in the price list.
To generate the comparative data, a hypothetical scenario of a shipment in air and sea modals of four pallets of goods from the company focus of the study was considered, totaling 604 kg and 6.11 m³, and its logistics departing from Hamburg, Germany. This scenario was compared to the logistics departing from the free trade zone of Uruguay and having distributors in Chile, Colombia, Peru, and Argentina as destinations. Tables 4 and 5 detail the information.
Table 4. Costs and lead time of hypothetical shipment departing from Hamburg, Germany
| Countries | International freight cost Mode: air (EUR) | Lead time Mode: air (days) | International freight cost Mode: maritime (EUR) | Lead time Mode: maritime (days) |
| Chile | 6.756,15 | 5–7 | 1.505,00 | 30–40 |
| Colombia | 1.649,45 | 5–7 | 755,00 | 30–40 |
| Peru | 2.081,85 | 5–7 | 760,00 | 30–40 |
| Argentina | 1.793,16 | 5–7 | 630,00 | 30–40 |
Table 5. Costs and lead time of hypothetical shipment departing from the Uruguayan free trade zone
| Countries | International freight cost Mode: air Origin: Uruguay (EUR) | Lead time Mode: air Origin: Uruguay (days) |
| Chile | 1.140,09 | 3 |
| Colombia | 900,60 | 3 |
| Peru | 940,14 | 3 |
| Argentina | 890,25 | 2 |
The data above show that shipping via Uruguay had a large advantage in relation to the lead time when compared to shipping via Germany. Furthermore, in relation to air freight, costs via Uruguay were much lower, reaching 83% savings in the case of Chile. In relation to maritime freight, only values departing from Germany were considered, as the international freight forwarders used by the studied company did not have a maritime route departing from Uruguay to Chile, Colombia, Peru, and Argentina. Nevertheless, it is important to highlight that the lead times for this mode were much higher.
Based on the comparison between the established scenario and the hypothetical scenario, evidence of success was noted in the latter case, with the implementation of the Distribution Center (DC). This was reinforced by the SWOT analysis, by the responses to the qualitative questionnaires submitted to the directors of the company’s distributors in Latin America, and by the data shown in Figures 5 to 8, which provide information from the literature.
Thus, upon observing the SWOT analysis, it was perceived that some positive points and opportunities stood out in relation to the implementation of CD in the Uruguayan free trade zone: shorter delivery times and freight, and tax incentives. Furthermore, the possibility of making sales through the One Lab platform signaled a possible increase in sales volume and the prospecting of new markets, which could culminate in the diversification of the company’s product buyers. These points could pave the way for a probable decrease in the studied company’s dependence on the Brazilian market and a consequent increase in competitiveness.
The answers obtained from the qualitative questionnaires applied to the directors of the studied company’s distributors in Latin America indicated low or no satisfaction regarding the costs and delivery times of the product import and commercialization process. The respondents were unanimous in agreeing that moving to a DC in the Uruguay free trade zone could bring benefits, such as reduced freight costs and delivery times, in addition to providing greater customer satisfaction, also increasing the market share.
The results obtained with this research indicate that Uruguay’s free trade zone offers competitive advantages, such as tax benefits, strategic location, and adequate infrastructure, which can attract investments for the implementation of a distribution center. However, challenges were also identified, such as the stability of competition in the region, logistical and regulatory issues, and the volatility of the global economy.
For possible future studies, it is suggested to conduct investigations on the supply chain and distribution logistics in the Uruguay free trade zone that encompass a more comprehensive market analysis, in addition to evaluations of economic and social impact regarding the implementation of distribution centers in the region.
It should be noted that the installation of a distribution center in the Uruguay Free Trade Zone presents opportunities and challenges that require careful and strategic analysis. It is considered that the survey presented here suggests, as a future related work, a financial feasibility analysis of this implementation.
References
[1] Barros P.; Melo, R.B.; Estender A.C. Visão sistêmica da cadeia logística: como a cadeia logística pode ajudar na satisfação do cliente final. In: Anais do X Simpósio de Excelência em Gestão e Tecnologia (SEGeT); 2013. Resende, RJ, Brasil. p. 1-13. Disponível em: <https://www.aedb.br/seget/arquivos/artigos13/771836.pdf>. Acesso em: 22 out. 2022.
[2] Leocadio T.C. O planejamento tático e operacional logístico de uma indústria de bebidas do estado do maranhão – estudo de caso. Trabalho de conclusão de curso. São Luís: Universidade Federal do Maranhão; 2019. Disponível em: <https://monografias.ufma.br/jspui/handle/123456789/5510>. Acesso em: 21 out. 2022.
[3] Machline J.C.B.C. Logística hospitalar teoria e prática. 3ed. São Paulo: Saraiva; 2017.
[4] Abreu D. 9 causas da baixa integração logística na América do Sul. 2016. Disponível em: https://noticias.portaldaindustria.com.br/listas/9-causas-da-baixa-integracao-logistica-na-america-do-sul/. Acesso em: 31 jan. 2023.
[5] Instituto Nacional de Logística (INALOG). Por que o Uruguai? 2016. Disponível em: <http://www.inalog.org.uy/pt/porque-uruguay/>. Acesso em: 21 out. 2022.
[6] Instituto Nacional de Estatística do Uruguai. 4º Censo de Zonas Francas 2009-2010. 2012. Disponível em: https://www5.ine.gub.uy/documents/Estad%C3%ADsticasecon%C3%B3micas/PDF/Proyectos%20especiales/Censo%20zonas%20francas/4to%20Censo%20de%20Zonas%20Francas%202009-2010.pdf.
[7] Falcão F.L.; Trevisan L. Zonas francas e logística: elementos da competitividade territorial no Uruguai. In: Anais do III Encontro de Iniciação Científica da Universidade Federal da Integração Latino-Americana; 2017. Foz do Iguaçu, PR, Brasil. p. 198-200. Disponível em: < https://dspace.unila.edu.br/handle/123456789/1123?show=full>. Acesso em: 21 out. 2022.
[8] Martins G. Zonas Francas no Uruguai. 2020. Disponível em: <https://www.gov.br/empresas-e-negocios/pt-br/invest-export-brasil/exportar/conheca-os-mercados/como_exportar_privado/como-exportar.pdf/relatoriosobrezonasfrancasnouruguai.pdf>. Acesso em: 10 abr. 2023.
[9] Dornelas J.C.A. Empreendedorismo: transformando ideias em negócios. Rio de Janeiro: Elsevier; 2005.
[10] Tzu S. 2011. A arte da guerra. 1ed. Rio de Janeiro: Nova Fronteira.
[11] Zonamerica. Empresas Instaladas. Disponível em: <https://web.zonamerica.com/conozca-zonamerica/#empresas-instaladas>. Acesso em: 06 nov. 2022.
[12] Ministerio da Economia e Finanzas. Análisis de la actividad económica de las Zonas Francas en Uruguay año 2019. 2022. Disponível em: https://www.gub.uy/ministerio-economia-finanzas/datos-y-estadisticas/estadisticas/analisis-actividad-economica-zonas-francas-uruguay-ano-2019. Acesso em: 06 jan. 2023.
[13] One Lab. Disponível em: <www.onelab.com.ar>. Acesso em: 31 jan. 2023.
[14] Kotler P.; Keller K.L. Administração de marketing. 14ed. São Paulo: Pearson Education; 2012.
[15] Falcão F.L.; Trevisan, L. Usos do território uruguaio na atualidade: o papel das zonas francas e da moderna logística. In: Anais do IV Encontro de Iniciação Científica da Universidade Federal da Integração Latino-Americana; 2015. Foz do Iguaçu, PR, Brasil. p. 1-2. Disponível em: <https://dspace.unila.edu.br/handle/123456789/1225;jsessionid=D73783BFA928D09D85DD5413FD09236E>. Acesso em: 10 abr. 2023.
[16] Sarquis S.J.B. Comércio internacional e crescimento econômico no Brasil. Brasília: Fundação Alexandre de Gusmão; 2011. Disponível em: <http://funag.gov.br/loja/download/864-comércio-internacional.pdf>. Acesso em: 10 abr. 2023.
[17] Gourinchas P.-O. A guerra obscurece as perspectivas econômicas mundiais enquanto a inflação acelera. 2022. Disponível em: https://www.imf.org/pt/Blogs/Articles/2022/04/19/blog-weo-war-dims-global-economic-outlook-as-inflation-accelerates. Acesso em: 10 abr. 2023.
How to cite
Castro L.G.; Lima L.M.; Logistics of health products in South America: distribution via the Uruguay free trade zone. E&S Journal. 2024; 5: e20240002.
About the authors
Luana Gonçalves de Castro – Pharmacist – Rua Guaipá, 452, apt. 23 – Vila Leopoldina – Postal Code: 05089-000 – São Paulo, SP, Brazil
Lilian Maluf de Lima – Doctor of Science (Applied Economics). Department of Economics, Administration and Sociology. Pádua Dias Avenue, 11 – Postal Code: 13400-000 – Piracicaba, SP, Brazil